
The Cantillon Effect: Who Benefits First From Money Creation
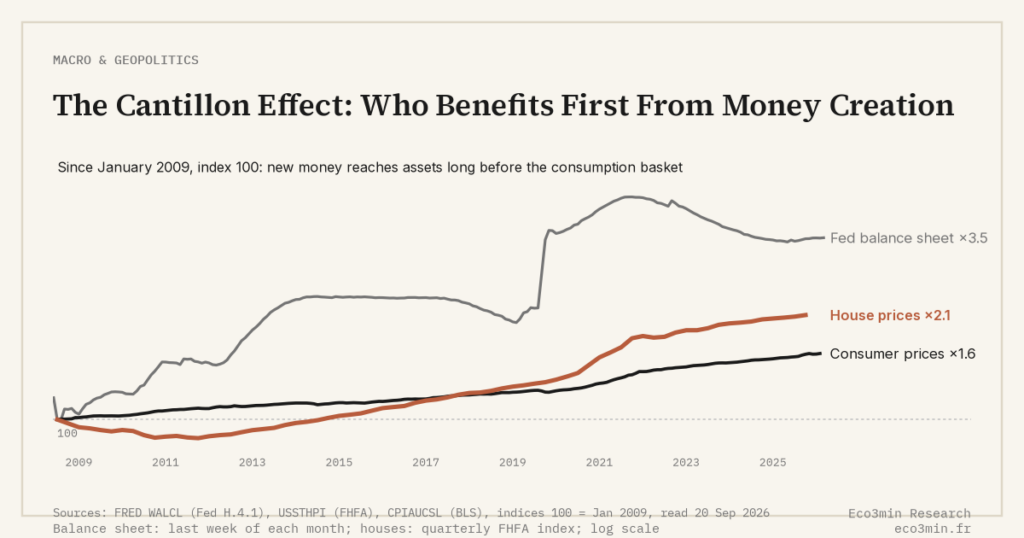
Cantillon effect: how new money never reaches the economy uniformly — the first beneficiaries capture real purchasing power before prices adjust, and the last bear the inflation cost without the gains.
Money creation is not neutral in time. The order in which new liquidity propagates through the economy determines who wins and who loses — a 270-year-old insight largely absent from modern textbook macro until QE forced its return.
Richard Cantillon, an Irish-French banker writing in the 1720s, identified a mechanism that monetary theory has periodically rediscovered: new money raises asset prices held by its first recipients well before consumer prices catch up. The 2009-2021 episode of large-scale central-bank balance-sheet expansion gave the Cantillon effect its most visible modern test.
Cantillon 1755: the original observation
Richard Cantillon’s Essai sur la nature du commerce en général, written around 1730 and published posthumously in 1755, contained an analytical insight that took two centuries to be properly absorbed by mainstream macroeconomics. Observing the price effects of New World silver flowing into Europe, Cantillon noted that the impact on prices was neither uniform nor instantaneous: silver miners and merchants in port cities saw prices for the goods they consumed rise first, while inland farmers continued to face stable prices for months or years. The relative position of an economic agent in the chain of monetary transmission determined whether they captured real gains, broke even, or lost real purchasing power.
The framework was geometric and intuitive — Cantillon spoke of money “spreading” from one sector to another like ink in water — but the implication was radical: monetary expansion is not neutral even in the short run, and its distributional effects matter as much as its aggregate effects. The classical economists who succeeded Cantillon (Hume, Smith, Ricardo) acknowledged the insight, but the marginalist revolution of the late nineteenth century and the macroeconomic synthesis of the twentieth largely set aside the question of who receives money first in favour of the question of how much money exists in aggregate.
The mechanism: who receives money first
The Cantillon mechanism operates through a simple logic. New money enters the economy at specific institutional points — historically, gold mines and royal mints; more recently, central-bank open-market operations and government spending. The recipients of that money exchange it for goods, services or assets at prices that have not yet adjusted to reflect the larger money stock. Distributional effects of that kind sit awkwardly with a framework that treats money creation as fiscally neutral, one of the objections raised against modern monetary theory as a guide to public finance. They capture real value at the expense of agents further down the transmission chain, who only encounter the new money once prices have already risen. This is precisely the dimension that aggregate frameworks miss when asking whether money creation always causes inflation: the answer depends on where the money lands first.
The injection point determines the distributional profile. Money created via central-bank purchases of government bonds flows first to the banking system and to bondholders. Money created via direct fiscal transfers flows first to households (with effects more concentrated on consumer prices). Money created via foreign-exchange interventions flows first to exporters. Each channel produces a different first-recipient profile, and therefore a different distributional outcome. The pillar piece on the complete framework of inflation mechanisms, measurement, history and effects develops how each transmission channel shapes the macro outcome.
The asset-price channel: QE and the Cantillon effect 2009-2021
The post-2008 episode of quantitative easing offered an unintentional natural experiment in Cantillon dynamics. The Federal Reserve expanded its balance sheet from $0.87 trillion in August 2008 to $4.5 trillion by 2014, then to $8.97 trillion by April 2022 (Federal Reserve H.4.1). The European Central Bank’s asset purchase programme accumulated approximately €5 trillion of securities between 2015 and 2022 (ECB). Most of that newly created liquidity entered the economy through purchases of government bonds and (in the Fed’s case) mortgage-backed securities — meaning the first recipients were holders of those securities: banks, pension funds, insurance companies, and ultimately the wealthiest households who own most financial assets.
The empirical signature was unambiguous. The S&P 500 returned approximately +517% cumulative between March 2009 and December 2021 (FactSet, total return basis), the strongest 12-year run in postwar history. The U.S. Case-Shiller home price index rose 99% over the same period (FRED). Goods CPI, by contrast, averaged 1.7% annual growth — well below the asset-price trajectory. The Cantillon mechanism was operating exactly as the framework predicts: new money inflated the prices of assets held by its first recipients, and only later (and partially) flowed into goods and services. The structural link between money supply and stock market returns documents the persistence of this asset-price channel.
The distributional dimension: who pays for non-neutral money
The distributional consequences of the QE-era Cantillon effect are well-documented. The share of total U.S. household net worth held by the top 1% rose from 28.4% in 2008 to 32.0% in 2021 (Federal Reserve Survey of Consumer Finances, 2022). The share held by the bottom 50% remained below 3% throughout. Real wage growth for the median U.S. worker averaged approximately 0.6% per year between 2009 and 2021 (BLS Real Earnings series), against an annualised S&P 500 total return of roughly 14.4% over the same period. The gap between asset-holder returns and labour returns widened in a way that closely tracks the Cantillon prediction.
The eurozone showed a similar pattern with European specificities. ECB asset purchases of €5 trillion between 2015 and 2022 coincided with a 71% rise in the EURO STOXX 600 (Bloomberg) and a 33% rise in eurozone residential real estate prices (Eurostat HPI), while real wages in most member states stagnated. The consequences when real interest rates remain negative for years compound the Cantillon distributional effects: low real rates penalise savers (who hold cash) while inflating the value of assets held by debt-financed investors.
The 2020 stimulus: a different injection point
The post-pandemic stimulus phase tested a different injection channel. U.S. federal transfers to households totalled approximately $5 trillion between March 2020 and March 2021 (CBO 2022) — direct deposits to household accounts via the CARES Act, ARPA, and enhanced unemployment benefits. This was Cantillon’s “fast” channel: money flowing directly to consumers, who spent it on goods and services. The result was the rapid 2021-2022 inflation surge, with consumer prices rising before asset prices stabilised. Read against the empirical record of M2 and US inflation since 1960, that surge is the episode where the injection point, not the aggregate, did the work.
The contrast with the 2009-2019 QE episodes is instructive. Same nominal magnitude, very different injection point, very different distributional outcome. The 2020 stimulus reduced wealth inequality temporarily (the bottom 50% saw the largest proportional gains in real terms during 2020-2021) before the subsequent inflation eroded those gains for cash-holders. The episode reinforces the Cantillon insight that where money enters matters as much as how much money is created. Our framework on the two foundational logics of cost-push and demand-pull inflation connects directly to this: demand-pull pressure depends on the share of new money flowing into transactional spending.
The Cantillon effect is not a moral judgement about monetary policy; it is an empirical regularity. The injection point of new money is at least as analytically important as its volume — and most macro forecasts ignore this dimension entirely.
Why mainstream macro ignored Cantillon for 200 years (and why it returned)
The Cantillon framework was largely sidelined by twentieth-century macroeconomics because the dominant analytical question was aggregate stabilisation. Phillips-curve-based frameworks treated the economy as a single representative agent; representative-agent models cannot, by construction, generate distributional effects from monetary policy. The absence of Cantillon dynamics from textbook macro was not a rejection of the mechanism but a methodological choice: the question being asked did not require the answer.
The post-2008 environment forced a reconsideration. When central-bank balance sheets expanded by trillions of dollars and equity markets boomed while consumer-price inflation remained at or below 2%, the question “where did the money go?” became impossible to ignore. Heterogeneous-agent macro models (HANK frameworks, developed since 2017) explicitly reintroduce distributional dynamics into monetary transmission. This is traced in detail in our analysis of inflation regimes and macro-financial implications. The IMF, BIS and central banks themselves now publish regular analyses of QE distributional effects — a research literature that essentially rediscovers Cantillon. As we explore in our work on the limits of the Fisher-Friedman quantity theory framework, the distributional gap is precisely what the aggregate QTM equation cannot capture.
Confusing the Cantillon effect with a normative critique of central banking. The mechanism is descriptive: new money has first recipients, last recipients, and a propagation chain. Whether that distribution is desirable is a separate political question. Treating it as a conspiracy or a moral failing obscures the analytical content.
The implications for the next cycle
Looking forward, the Cantillon framework structures several diagnostics. Quantitative tightening (the unwinding of central-bank balance sheets) is the reverse Cantillon mechanism: the first sectors to lose access to liquidity bear disproportionate adjustment costs. The 2022-2024 episode showed regional banks, commercial real estate and high-leverage corporate borrowers bearing the brunt of QT and rate hikes, while large-cap technology equities and AI-related sectors continued to attract capital — a distributional asymmetry consistent with reverse Cantillon dynamics in a fragmented liquidity environment.
The framework also matters for thinking about future monetary regimes. Central-bank digital currencies (CBDCs), if deployed with direct household accounts, would eliminate the banking-system intermediation step and make the Cantillon injection point much closer to consumer prices. Helicopter money, debated since Friedman’s 1969 essay and Bernanke’s 2003 speech, has the same property. Each variant changes the distributional profile of monetary expansion. The structural shift documented in our work on how the inflation regime is changing under deglobalisation pressures may require central banks to rethink injection channels precisely to manage these distributional consequences. The dataset on real rates versus the CAPE ratio since 1963 shows the asset-price footprint of monetary regimes across decades.
- The Cantillon effect, formulated by Richard Cantillon in the 1720s and published in 1755, observes that new money is not neutral in time: first recipients capture real purchasing power before prices adjust.
- The injection point of new money determines the distributional outcome: bond purchases inflate financial-asset prices first; direct fiscal transfers inflate consumer prices first.
- The 2009-2021 QE episode produced an empirical signature consistent with the Cantillon framework: S&P 500 +517% cumulative return, top 1% wealth share rising from 28% to 32%, while real median wages grew 0.6% annually.
- Mainstream macro sidelined the Cantillon framework for most of the twentieth century because representative-agent models cannot generate distributional effects; heterogeneous-agent models since 2017 have reintroduced it.
A diagnostic, not a verdict
The Cantillon framework does not deliver a policy prescription. It describes a mechanism that operates regardless of intent: any monetary expansion has first recipients, and those first recipients capture real value at the expense of those reached later in the chain. Whether this matters depends on the magnitude of the expansion, the duration of the price-adjustment lag, and the political tolerance for the resulting distribution. The post-2008 decade illustrates that even well-intentioned monetary policy can generate large distributional effects that accumulate over time. Related Q&A: how private equity creates value through multiple expansion.
For the analytically rigorous reader, the takeaway is to integrate the Cantillon dimension into any inflation forecast: not just “how much money is being created” but “where is it entering, and which sectors of the economy are most exposed to first-order price effects.” The aggregate macroeconomic models that ignore this dimension miss roughly half of the picture — the half that explains why two episodes of identical-magnitude monetary expansion can produce wildly different inflation profiles and wildly different distributional outcomes.
Last updated — 22 September 2026
Disclaimer – Financial Information: The analyses, commentary, and content published on eco3min.fr are provided for informational and educational purposes only. They do not constitute investment advice or a solicitation to buy or sell financial instruments. Past performance is not indicative of future results. All investment decisions involve risk and are the sole responsibility of the reader.
Read next
Full pillar →Inflation: France vs Eurozone vs U.S. — Divergences Explained
Identical headline shocks produced very different inflation prints in France, the eurozone aggregate and the United States during…
Fiscal Policy and Inflation: The Forgotten Role of Government Budgets
Fiscal policy is rarely framed as a cause of inflation. The dominant story since the 1970s placed monetary…
Perceived vs Measured Inflation: Why the Gap Keeps Widening
Why the gap between perceived and measured inflation keeps widening: a structural feature of how households remember prices,…