
How INSEE Calculates Inflation: Basket, Weights, Methodology
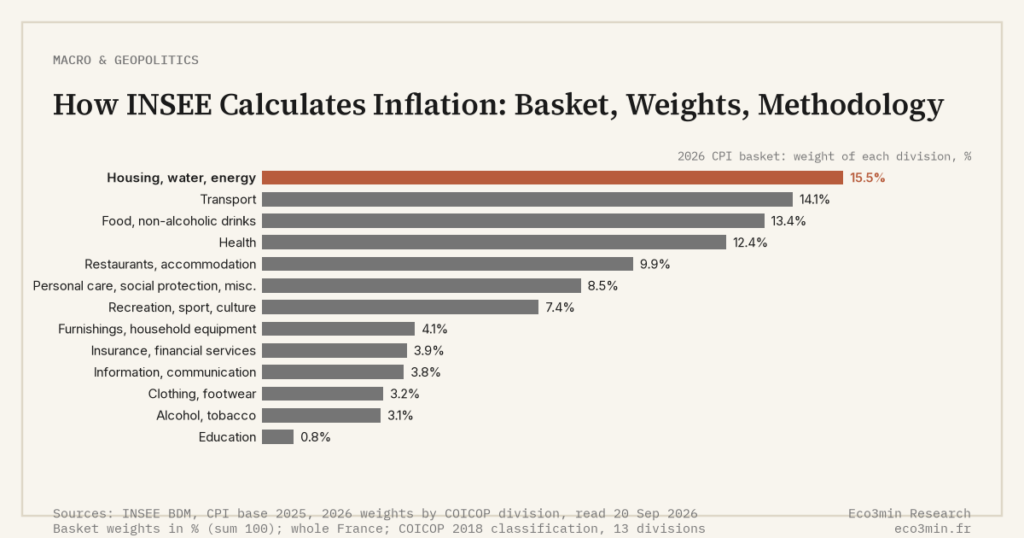
The architecture of French inflation measurement: 200,000 prices, 27,000 outlets, 1,000 product categories, annual weight revisions, and a hedonic-adjustment apparatus that makes INSEE one of the most methodologically conservative agencies in Europe.
Every monthly French inflation print is the output of a survey machine that processes more than two million prices a year. The basket choices, weight revision schedule and hedonic-adjustment rules determine the headline as much as actual price movements do.
INSEE publishes three inflation indices each month: the IPC (national), the IPCH (harmonized, used by the ECB) and the IPCN (used to revalue regulated rents). Understanding which questions each answers, and how the underlying data are collected, separates rigorous reading of French inflation from headline-grabbing approximation. Eco3min lays this out in the Eco3min framework on inflation regimes.
The architecture: scale and method
Coverage and sample design
INSEE collects roughly 200,000 prices per month across approximately 27,000 outlets in metropolitan France, covering a basket of around 1,000 product categories — known as “varieties” in INSEE terminology. The sample design uses primary sampling units (PSUs) at the level of agglomerations, with stratification by city size and region. About 700 enumerators visit physical outlets monthly; remote collection (web prices, scanner data) covers the rest. Monthly collection feeds a print that lands at a fixed early-morning hour, which is where INSEE’s release times and revision status start to matter. The methodology is documented in INSEE’s L’indice des prix à la consommation — Méthodologie, periodically revised.
Weight revision: from biennial to annual
INSEE revises basket weights every January, based on national accounts household consumption data from year N-2. The lag is mechanical: 2024 weights reflect 2022 consumption, 2026 weights will reflect 2024 consumption. This conservative timing prevents weights from being distorted by transitory consumption shifts (the 2020 pandemic distortion, for example, was largely smoothed out before it hit basket weights). The 2024 revision reduced energy weight from approximately 11% in 2022 to about 7.5% in 2024 (INSEE Insee Première No. 1980, January 2024) — reflecting the temporary nature of the energy shock and the partial pass-through to households of the price shield.
Hedonic adjustment for technology and durables
The principle
When a product’s quality changes — a more powerful laptop at the same price — INSEE attempts to isolate the pure-price component from the quality component. The technique is hedonic regression: a statistical model regresses observed prices on product characteristics (CPU speed, RAM, screen size for laptops; engine power, options package for cars), and the predicted price differential between models is used to adjust the observed price change. Without hedonic adjustment, replacing an old model with a new better model at the same price would record zero inflation when in fact the consumer is getting more for the same money — meaning real inflation is lower than the raw observation suggests.
Coverage and the controversy
INSEE applies hedonic adjustment to roughly 30 product categories — laptops, smartphones, televisions, washing machines, cars, refrigerators. The U.S. BLS applies it more broadly, the ECB through HICP harmonization imposes minimum standards. Critics argue that hedonic adjustment systematically pulls measured inflation down: by treating quality improvements as price declines, the index records less inflation than households perceive. The hedonic-adjustment controversy is one of the most consequential drivers of the perceived-versus-measured gap; the perception gap itself reached 5 to 7 percentage points in the euro area during 2022 according to European Commission consumer surveys.
IPC, IPCH, IPCN: three indices, three uses
IPC: the national reference
The IPC is the headline French inflation index, used in the press, by the social partners for wage negotiations and by INSEE for purchasing-power analysis. It includes tobacco, covers metropolitan France only, and uses Laspeyres-type weighting with annual revision. Its scope is closest to what households recognize as their cost of living. Taken as an annual average, that same index is the base on which the coefficients used to convert a sum between two years rest.
IPCH: the ECB-relevant index
The IPCH is the French component of the euro-area HICP, harmonized with Eurostat rules. It excludes owner-occupied housing (which IPC partially captures via maintenance and small repairs), covers overseas departments in addition to metropolitan France, and applies stricter weight-update rules. The ECB’s policy decisions reference euro-area HICP, which aggregates national IPCH series weighted by national consumption shares. Reading ECB statements against the French IPC rather than the French IPCH produces interpretation noise of 30 to 80 basis points typically. Picking the right one starts with having both, and the monthly INSEE consumer price index for France is the national leg of that pair.
IPCN: the rent-revaluation index
The IPCN excludes tobacco and is used legally to revalue commercial leases and certain regulated rents. Its mention in tenancy contracts has tangible economic consequences, but the index itself is a derivative of IPC computational machinery rather than a separate measurement effort.
What recent revisions reveal
The 2024 weight changes
The January 2024 revision shifted weights toward services (services weight rose from approximately 49% to 51% of the basket) and away from energy (down from 11% to 7.5%). Food weight remained roughly stable at 16%. The shifts reflected the post-pandemic recovery of services consumption and the unwinding of the 2022 energy crisis. The services-versus-goods divergence visible in 2023-2024 was therefore amplified in the 2024 print by the basket reweighting itself, not just by underlying price dynamics.
The 2026 revision (in progress)
Based on 2024 consumption, the 2026 revision will likely reduce shelter-related weights modestly (rent dynamics softened in late 2024 and 2025) and stabilize food weights. The weight schedule means that any structural shift in French household consumption affects measured inflation with a roughly two-year lag — a feature that smooths the index but reduces its responsiveness to genuinely persistent shifts.
Methodological controversies and limits
The shelter question
Owner-occupied housing is the largest single methodological gap. The U.S. CPI imputes a value via owners’ equivalent rent (giving shelter roughly 33% of basket weight); INSEE captures only out-of-pocket housing costs (maintenance, small repairs — roughly 6% of basket); HICP excludes owner-occupied housing entirely. Shelter as the dominant CPI component in the U.S. contrasts sharply with the French treatment, and explains a substantial portion of the systematic CPI-IPC wedge during housing-price cycles.
New goods, disappearing goods, quality drift
New products enter the basket with a delay (smartphones took several years to be properly weighted in the 2010s). Disappearing products are dropped, but the timing is judgment-based. Continuous quality drift in services (a hotel night with new amenities, a restaurant meal with delivery service) is harder to capture than hardware quality drift. These remain open methodological frontiers across all national statistical agencies, not just INSEE. Over a long enough window, product turnover stops being a methodological footnote and becomes the story itself, as in the US consumption basket since 1929.
Scanner data and the digital pricing problem
Since 2020, INSEE has progressively integrated retailer scanner data — actual transaction-level prices and quantities from major retail chains — alongside its enumerator-collected sample. Scanner data covers roughly 30% of the IPC food and household-goods sample by 2024. The methodology offers two advantages: weighting reflects actual purchase patterns in real time, and coverage is exhaustive within participating retailers. The trade-off is comparability: a non-trivial share of historical IPC behavior reflected the older sampling architecture, and breaks in the series during the transition introduce small but systematic discontinuities. The U.S. BLS, the German Destatis and Statistics Netherlands are running parallel programs at varying speeds. Online prices, increasingly important in household consumption, raise an additional sampling question: web prices change more frequently and respond more elastically to algorithmic pricing, which the monthly survey cadence does not fully capture.
Publication calendar and revisions
INSEE publishes a provisional estimate of the IPC around the 14th of the following month, with a final number around the 14th-15th of the same month. Revisions to recent prints are typically small (less than 10 basis points) but occasionally reflect methodological updates that propagate backward by one or two periods. The schedule means that French inflation data are slightly less timely than the U.S. CPI (released around the 12th of the following month) but slightly more timely than the euro-area aggregate HICP, which depends on national submissions. For practical analysis, the gap matters in the days immediately around publication; for regime reading over multiple quarters, the publication cadence is irrelevant.
The official French inflation number is one output of three measurement choices — basket, weights, hedonic adjustment — each of which has plausible alternatives that would produce a measurably different number.
Reading INSEE outputs in context
Three reading practices separate rigorous analysis from headline-grabbing. First, distinguish IPC from IPCH and pick the right one for the question (ECB monitoring uses IPCH; household cost of living uses IPC). Second, follow the breadth of the basket — INSEE publishes the share of varieties in inflation territory each month, a regime indicator more reliable than the headline. Third, reconcile official numbers with consumer surveys: when the perceived-measured gap widens, the policy environment hardens regardless of what the headline says. The complete inflation guide develops the regime framework that integrates these readings; the four-measure comparison places INSEE’s choices in cross-Atlantic context. The inflation sub-pillar aggregates monthly readings.
- INSEE collects roughly 200,000 prices per month across 27,000 outlets and 1,000 product categories — a survey machine processing more than two million data points per year.
- Weights are revised annually based on year N-2 consumption, smoothing temporary shifts but introducing a two-year lag in basket responsiveness.
- Hedonic adjustment, applied to roughly 30 categories, systematically pulls measured inflation down — a structural driver of the perceived-versus-measured gap.
- IPC, IPCH and IPCN measure related but distinct objects; the ECB references IPCH, French households experience something closer to IPC, and rent-revaluation contracts use IPCN.
Last updated — 22 September 2026
Disclaimer – Financial Information: The analyses, commentary, and content published on eco3min.fr are provided for informational and educational purposes only. They do not constitute investment advice or a solicitation to buy or sell financial instruments. Past performance is not indicative of future results. All investment decisions involve risk and are the sole responsibility of the reader.
Read next
Full pillar →Inflation and Debt: The Silent Erosion That Benefits Debtors
Inflation does not erase debt. It silently transfers wealth from creditors to debtors — but only when prices…
Gold and Inflation: Myth or Reality of the Safe Haven
Gold is not an inflation hedge — at least not in the way the marketing claims. The empirical…
Inflation and Taxation: Bracket Creep and Nominal Capital Gains
Inflation does not need a vote in Congress to raise the real tax burden. It does so silently,…