
Perceived vs Measured Inflation: Why the Gap Keeps Widening
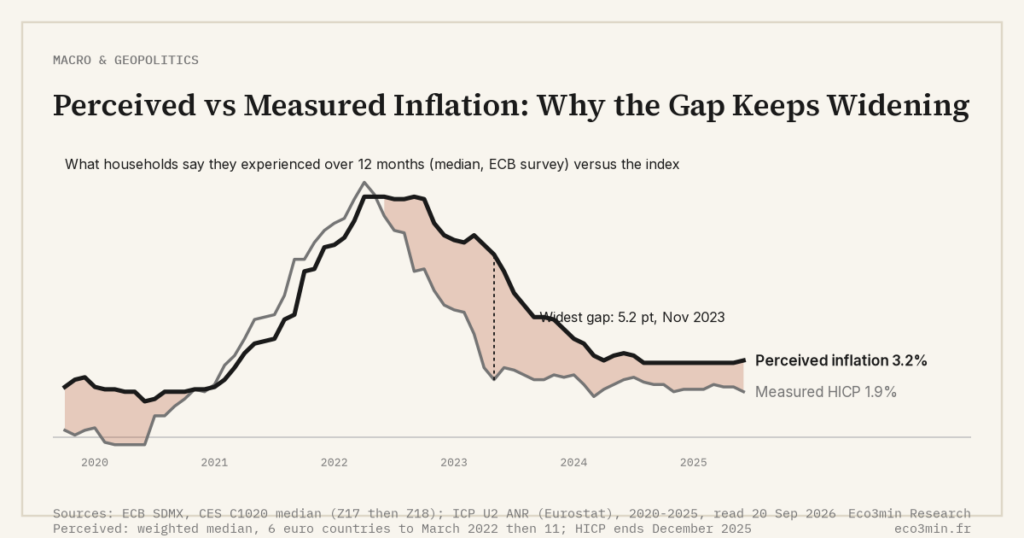
Why the gap between perceived and measured inflation keeps widening: a structural feature of how households remember prices, not a measurement error central banks can fix. On the same question: purchasing-power erosion for the household-side framing.
Perceived inflation systematically runs above official measures by several percentage points — a gap that shapes wage demands, electoral outcomes and central-bank credibility regardless of what the headline number says.
European Commission consumer surveys document the gap; academic work since Brachinger (2008) explains its mechanism; the post-2022 cycle showed why central banks ignore it at their peril. The phenomenon is not statistical noise but a feature of how human cognition processes price information.
The structural gap, in numbers
Eurobarometer and the persistent wedge
The European Commission’s Consumer Survey, which asks respondents to compare current prices with prices twelve months earlier, has tracked perceived inflation across the EU since 1985. The series consistently runs above the official HICP — typically by 3 to 5 percentage points in normal times. During 2022, the gap widened to roughly 5 to 7 percentage points across the euro area: when official HICP was at 10.6% in October 2022 (Eurostat), perceived inflation in some member states implied price increases of 15% or more. The wedge collapsed only partially during the 2023-2024 disinflation, suggesting persistence in the perceptual residue of the shock.
The U.S. picture: Michigan and New York Fed
The University of Michigan’s monthly Survey of Consumers asks households about expected one-year price changes. Expectations have run roughly 2 to 3 percentage points above realized CPI for most of the post-1980 period — a smaller gap than the European one but still systematic. The New York Fed’s Survey of Consumer Expectations, launched in 2013, confirms the pattern: median expected one-year inflation reached 6.8% in June 2022 against a CPI peak of 9.1%, but stayed elevated for several months after CPI began declining.
The ECB Consumer Expectations Survey
The ECB launched its Consumer Expectations Survey (CES) in 2020. The series confirms a euro-area gap structurally larger than the U.S. one: median twelve-month-ahead inflation expectations reached roughly 8% in late 2022 while HICP itself was at 10.6%. The CES became a key input to ECB strategy after the 2021 strategic review, partly because survey-based expectations had proven more accurate than market-based breakevens during the 2021 inflation acceleration.
Why perception differs from measurement
Frequency-of-purchase weighting
Household memory weights prices by purchase frequency, not by basket share. Groceries, fuel and small daily expenses occupy a disproportionate share of mental price-tracking, even though their basket weight is moderate. The phenomenon is documented in Brachinger’s 2008 Index of Perceived Inflation (IPI), which reweights the German CPI by purchase frequency rather than expenditure share. The IPI consistently runs above the official series, and the gap correlates strongly with food and energy moves — exactly the items households see most often. The services-versus-goods divergence amplifies this: services prices change less frequently in observable form, so a real services-led inflation episode shows up later in perception than in measurement.
Asymmetric salience: rises stick, falls fade
Behavioral research (Tversky and Kahneman, prospect theory; subsequent work on price salience) shows that price increases register more strongly in memory than equivalent decreases. A 10% rise in coffee prices is remembered; a 10% decline in television prices is barely noticed. The CPI captures both symmetrically; perception does not. Hedonic adjustment compounds the effect: when a laptop becomes 30% more powerful at the same price, the CPI records a price decline that no household subjectively experiences. The hedonic adjustment controversy is one of the most direct drivers of the perception gap.
Reference points and the comparison anchor
Households compare prices to remembered prices — sometimes from one year ago, sometimes from several years ago. Long-memory comparisons against pre-2020 levels were common in 2023-2024 European surveys, even though the technical YoY measure showed disinflation. The reference-point problem makes survey-based perception inherently lagged relative to current realized inflation, but more accurate as a measure of cumulative price-level erosion since a remembered baseline.
The role of media coverage
Media salience amplifies the asymmetric memory effect. A grocery price spike that makes headlines registers more strongly than a quiet decline in television prices, even when both are equivalently captured in the index. Studies of U.S. and European media coverage during 2021-2024 show that inflation news intensity correlated more strongly with perception surveys than with realized CPI prints, suggesting that the news cycle itself is part of the perception-formation mechanism. The implication for central banks is that communication strategy matters not just for expectations management but for closing the perception gap during disinflation phases. Perception aside, one unit needs no communication at all: everyday US prices restated in hours of work.
The basket the household actually faces
Inflation by income decile
The official basket is an average. Each household actually faces a personalized basket determined by its consumption mix. ECB Occasional Paper No. 339 (October 2024) documents that the lowest-income decile in the euro area faced effective inflation roughly 1.5 percentage points above the average household during 2022, because food and energy weigh more heavily in their consumption. The Banque de France’s “inflation par décile” series since 2021 makes the same point for France: the bottom decile experienced cumulative 2022-2023 inflation roughly 2 percentage points higher than the top decile. The regressive distribution of inflation is therefore not a perception artifact — it is a real difference in the basket faced by different households.
Healthcare, housing, education: the long-cycle items
Some categories accumulate visible price changes over multi-year windows that the YoY framing flattens. U.S. healthcare costs roughly tripled in nominal terms between 2000 and 2024 (BEA national accounts); college tuition rose at three to four times the headline CPI rate over the same period. Households experience these as memorable price shocks even when annual measurements absorb them in the average. The mismatch between “what hit my budget” and “what the index registered” widens accordingly. Budgets are not stable objects either: the categories that dominate American household spending have swapped places more than once since 1929.
Consequences for wages, voting, and credibility
Wage demands anchor on perception
Collective bargaining and individual salary negotiations reference perceived inflation, not measured inflation. The 2022-2024 wage cycle in France and Germany delivered nominal wage gains of 4 to 6% annually — substantially above forecasts based on official inflation alone, and consistent with perceived-inflation surveys. The wage transmission mechanism explains why the perception gap matters even if it is “wrong” in the measurement sense: a self-fulfilling expectation that becomes embedded in contracts.
Electoral pressure on central banks
Survey research consistently finds that voters punish incumbents for perceived inflation more reliably than for measured inflation. Several 2023-2024 European elections showed swings against incumbent parties that correlated more with consumer surveys than with HICP prints. The political-economy consequence is that central banks face credibility pressure even when their measured target is met — an issue the ECB has addressed explicitly in 2024 communications.
Self-reinforcement through expectations
If households expect 5% inflation and demand wage adjustments accordingly, the realized inflation tends to track expectations rather than the prior measurement. The role of inflation expectations in determining whether a shock becomes a regime is the channel through which perception becomes reality. Markets price this through breakeven inflation rates, but those breakevens themselves are anchored in survey-based expectations.
Perceived inflation is not a measurement error central banks can correct; it is the price signal households actually act on, which is why it shapes wages, votes and policy more reliably than the headline number.
Can the gap close?
Methodological adjustments at the margin
National statistical agencies have begun publishing supplementary indices that reweight by purchase frequency or by household decile. INSEE’s “inflation par catégorie de ménage” since 2022, the BLS’s experimental research series, and Eurostat’s experimental owner-occupied housing index all narrow the gap on specific dimensions. None eliminates it, because the structural drivers (asymmetric salience, reference-point comparisons) are cognitive rather than statistical.
The communication challenge
Central banks have started referencing perception gaps explicitly. ECB President Christine Lagarde’s 2023-2024 speeches repeatedly acknowledged that “the inflation households feel” differs from the HICP print, framing policy in terms of both. The thread is followed through in our structural reading of inflation. The Federal Reserve has used similar language since 2022. Whether this communication shift narrows the gap or merely manages its political consequences is an open question.
Reading the gap as data
The gap itself contains information. A widening perception-measurement gap during disinflation phases often signals that headline declines are not yet credible to households — which means wage demands and consumption decisions will lag the official disinflation. The 2024 European data showed this pattern: HICP at 2-3% while perceived inflation surveys still implied 5-7%, suggesting embedded inflation in wage and contract negotiations beyond what the headline measure indicated. The complete inflation guide places the gap in the broader regime framework; the four-measure comparison shows that the perception gap is just one of several measurement-versus-reality wedges; the inflation sub-pillar aggregates these into the regime reading.
- Perceived inflation runs structurally above measured inflation by 2-7 percentage points depending on country and cycle phase — a gap that is cognitive, not statistical.
- Frequency-of-purchase weighting, asymmetric salience, and long-memory reference points explain why the same data produce different subjective and objective readings.
- The gap shapes wage demands, electoral outcomes and central-bank credibility independently of the official number, making it a real economic variable.
- Methodological adjustments narrow the gap on specific dimensions but cannot eliminate the cognitive drivers; the gap itself contains diagnostic information about regime credibility.
Last updated — 22 September 2026
Disclaimer – Financial Information: The analyses, commentary, and content published on eco3min.fr are provided for informational and educational purposes only. They do not constitute investment advice or a solicitation to buy or sell financial instruments. Past performance is not indicative of future results. All investment decisions involve risk and are the sole responsibility of the reader.
Read next
Full pillar →Inflation and Taxation: Bracket Creep and Nominal Capital Gains
Inflation does not need a vote in Congress to raise the real tax burden. It does so silently,…
Inflation Expectations: How They Form and Why They Matter
Inflation expectations: the forward-looking variable central banks watch most closely — because once they de-anchor, every other inflation…
Zimbabwe 2007-2009: The Last Modern Hyperinflation
From 24% annual inflation in 1999 to 89.7 sextillion percent monthly inflation in November 2008, Zimbabwe compressed an…