
Nasdaq vs S&P 500: 8 of 9 Bear Markets Show the Nasdaq Falls Harder (1971–2026)
Across the nine Nasdaq bear markets since 1971, the Nasdaq fell harder than the S&P 500 in 8 of 9 cases. The 2007–09 Global Financial Crisis is the single exception (NDQ −51.8% vs S&P 500 −52.6%, ratio 0.99×).
A 664-month dataset tracking the Nasdaq Composite, the S&P 500 and real interest rates from February 1971 to May 2026, documenting nine Nasdaq bear markets and the regime shift in tech’s relationship with real rates around 1995.
The Nasdaq Composite has fallen harder than the S&P 500 in 8 of the 9 bear markets it has experienced since 1971. The single exception is the 2007–09 Global Financial Crisis, during which the S&P 500 fell marginally harder than the Nasdaq (−52.6% vs −51.8%, ratio 0.99×). Across all nine episodes the average drawdown ratio is 1.63× (1.71× excluding the GFC), with a range from 0.99× (2007–09 GFC) to 2.76× (1983–84). The Nasdaq’s outperformance over the same 55-year period — a cumulative return roughly 3.4× that of the S&P 500 — has been concentrated in periods when real interest rates were falling, but the relationship has not been constant: between 1972 and 1995, the Nasdaq/S&P 500 ratio moved with real rates, not against them.
Across the nine Nasdaq bear markets since 1971, the Nasdaq fell harder than the S&P 500 in 8 of 9 cases — the 2007–09 GFC is the single exception (NDQ −51.8% vs S&P −52.6%, ratio 0.99×). Mean ratio across all nine: 1.63×; excluding the GFC: 1.71×. The often-cited duration framing — that the Nasdaq behaves like a long-duration asset penalised by rising real rates — is supported empirically only since 1995: the Nasdaq/S&P 500 ratio correlation with the real 10-year yield is −0.53 in 1996–2026 but +0.67 in 1972–1995. Note: this dataset measures monthly peak-to-trough drawdowns in nominal index levels — it does not control for sector composition changes, dividends, or beta differentials (see Methodology and Limitations).
Nasdaq Composite close
S&P 500 close
NDQ/SP ratio (Feb 1971 = 100)
Real 10-year yield (ex-post)
- Across the nine Nasdaq bear markets since 1971, the Nasdaq fell harder than the S&P 500 in 8 of 9 cases — the 2007–09 GFC is the single exception (NDQ −51.8% vs S&P 500 −52.6%, ratio 0.99×). Mean ratio: 1.63× across all nine; 1.71× excluding the GFC. Range: 0.99× (GFC) to 2.76× (1983–84).
- The relationship between the Nasdaq/S&P 500 ratio and real interest rates reversed sign around 1995: the correlation with the ex-post real 10-year yield is −0.53 in 1996–2026 but +0.67 in 1972–1995 — the “long-duration tech” mechanism is a feature of the modern composition era, not a 55-year constant.
- The cumulative Nasdaq return from Feb 1971 to May 2026 is +25,800% versus +7,547% for the S&P 500 — a multiple of 3.4× — but this outperformance is concentrated in negative real-rate regimes.
- The deepest Nasdaq drawdown in the dataset is the 2000–02 dot-com decline of −75.0% (vs S&P 500’s −40.3%, ratio 1.86×); the most recent is the 2021–22 decline of −33.1% (vs S&P 500’s −19.4%, ratio 1.70×).
- The 2015–18 Fed tightening cycle is the only one in the dataset where no NDQ bear market was triggered: the Nasdaq’s monthly-close peak-to-trough decline over that cycle was −18.2%, just below the 20% bear-market threshold. Within the cycle window, the Nasdaq still fell harder than the S&P 500 (NDQ −18.2% vs S&P −14.0% monthly close), but the absolute drawdown was milder than every other tightening episode in the dataset.
- Dataset coverage: 664 monthly observations spanning February 1971 to May 2026, with proprietary derived columns for bear-market identification, tightening-cycle tagging, real-rate regime classification, and 12-month forward returns. Index levels not redistributed, source terms apply.
664 observations · Monthly · February 1971 – May 2026 · Index levels not redistributed, source terms apply ·
Methodology ·
Cite this dataset
NDQ bear markets where Nasdaq fell harder than S&P 500
Average drawdown ratio across all 9 bear markets (1.71× excl. GFC)
Worst Nasdaq drawdown (2000–02 dot-com)
Cumulative Nasdaq vs S&P 500 return (1971–2026)
NDQ/SP ratio vs real 10Y correlation: pre-1995 vs post-1995
Monthly observations (Feb 1971 – May 2026)
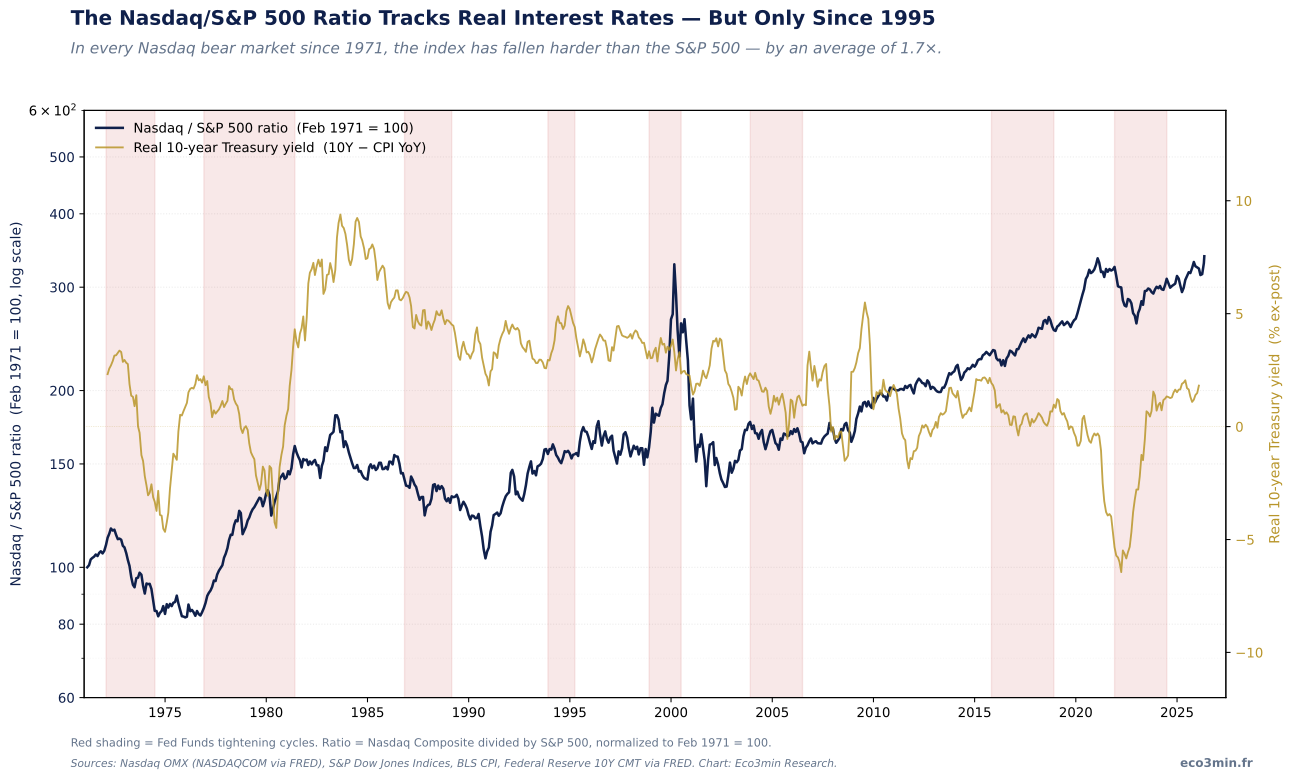
Chart A: The Nasdaq/S&P 500 Ratio Against Real Interest Rates, 1971–2026
Nasdaq / S&P 500 ratio vs real 10-year Treasury yield, 1971–2026
The Nasdaq has outperformed the S&P 500 by 3.4× over 55 years — but the relationship with real rates reversed around 1995.
The cumulative Nasdaq outperformance over 55 years is unambiguous (ratio: 100 → 339), but the path-dependency of that outperformance with respect to real interest rates is regime-specific. Pre-1995, the two series tracked together; post-1995, they diverge inversely.
Sources: Nasdaq OMX (NASDAQCOM via FRED), S&P Dow Jones Indices via Yahoo Finance, BLS CPI (CPIAUCSL), Federal Reserve 10-Year Treasury Constant Maturity (DGS10) via FRED. Chart: Eco3min Research.
How to Read This Chart
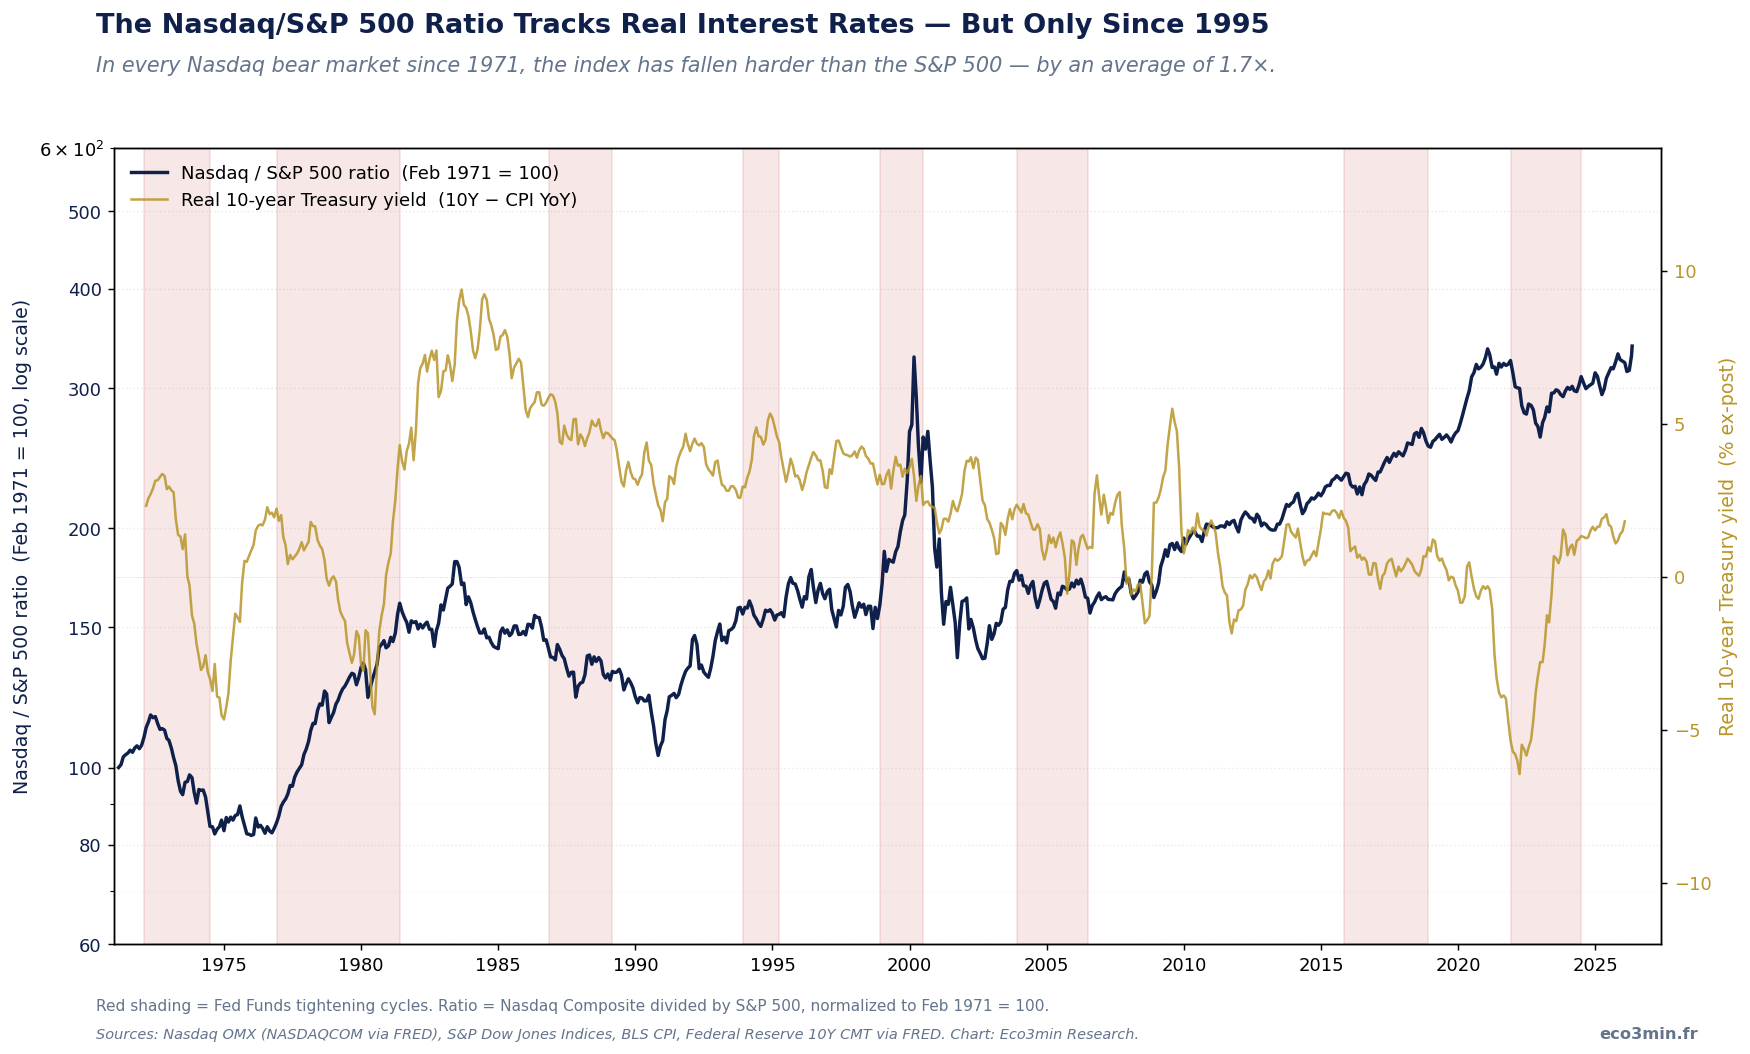
The left vertical axis (log scale) tracks the Nasdaq Composite divided by the S&P 500, normalised so February 1971 = 100. By May 2026 the ratio reaches 339, indicating the Nasdaq has cumulatively returned 3.39× as much as the S&P 500 since the start of the series. The log scale is mandatory: the linear ratio range exceeds 5×.
The right axis shows the ex-post real 10-year Treasury yield, computed as the monthly average DGS10 minus contemporaneous CPI year-over-year. This is a 55-year-consistent measure; TIPS-based real yields are only available from 2003. See our US Real Interest Rates Dataset (1962–Present) for the underlying real-rate series.
Red vertical shading marks Federal Reserve tightening cycles, defined here as periods where the Fed Funds rate rose by ≥150 basis points without an intervening cut of more than 50 basis points. Eight such cycles are identified between 1971 and 2024. The relationship between the ratio and the real yield switches regime visually around the mid-1990s — formalised in the regime-shift scatter below.
The Duration Framing — and Where It Comes from
The dominant narrative for the Nasdaq’s behaviour during periods of monetary tightening holds that technology equities are long-duration assets. A high share of expected cash flows accrues in the distant future, so any increase in the discount rate compresses present value more than for an index dominated by mature, cash-generating businesses. For the mechanics, see our primer on bond duration. By this framing, the Nasdaq would be expected to fall harder than the S&P 500 whenever real interest rates rise — and benefit disproportionately when they fall.
The dataset partially supports this framing. The cumulative Nasdaq-over-S&P 500 outperformance, +25,800% versus +7,547% from February 1971 to May 2026, is concentrated in the post-1995 era and especially in negative real-rate regimes. And in the nine identified bear markets ≥20%, the Nasdaq drawdown exceeded the S&P 500’s in 8 of 9 cases, with an average ratio across all nine of 1.63× (1.71× excluding the 2007–09 GFC, which is the single exception). The empirical pattern of “falls harder” is real, persistent, and named.
Composition shift across the period. The Nasdaq Composite of 1971 is not the Nasdaq Composite of 2026. In the early 1970s, NASDAQCOM was a quotation system for small over-the-counter securities, dominated by financial services, regional banks, and small industrials. Technology and biotech listings rose to prominence only in the 1980s–90s. The modern composition — top-heavy with software, semiconductors, and platform businesses — emerged after 1995. Direct cross-period comparison requires caution: the “long-duration” framing is a property of the modern composition, not a transhistorical feature of the index.
What this dataset does not measure. The drawdown ratios use total index levels, not total return: dividends are not reinvested. Over the full period the S&P 500 has paid materially higher dividends than the Nasdaq Composite — the dividend yield differential averaged roughly 1.5–2 percentage points before the late 1990s and remains positive today . Total-return ratios would compress the cumulative outperformance number; they would not eliminate the drawdown asymmetry. The dataset also does not control for the Nasdaq’s higher market beta (≈1.2 over the period), which mechanically produces larger drawdowns even without a duration mechanism.
The Nasdaq has fallen harder than the S&P 500 in every bear market since 1971 — but this is a directional finding about downside skew, not a confirmation that real-rate duration is the dominant mechanism. The mechanism question is taken up in the regime-shift section below.
Nine Nasdaq Bear Markets, 1971–2026
A Nasdaq bear market is defined here as any peak-to-trough decline of 20% or more in the monthly close series, where the peak is the highest close in the preceding 24 months. Nine such episodes are identified between February 1971 and May 2026. In eight of the nine the Nasdaq Composite fell harder than the S&P 500 over the same peak-to-trough window; the 2007–09 Global Financial Crisis is the single exception, where the S&P 500 fell marginally harder than the Nasdaq.
Drawdown comparison: Nasdaq vs S&P 500, 1971–2026
| Period | Nasdaq drawdown | S&P 500 drawdown | Ratio | Macro context |
|---|---|---|---|---|
| Dec 1972 – Sep 1974 | −58.4% | −46.2% | 1.26× | Oil shock; Burns tightening (+962 bp); stagflation onset |
| May 1981 – Jul 1982 | −25.1% | −19.2% | 1.31× | Volcker disinflation; Fed Funds peaked at 19.1% in Jun 1981 |
| Jun 1983 – Jul 1984 | −27.9% | −10.1% | 2.76× | Mid-cycle correction; rates rising from 1982 lows |
| Aug 1987 – Nov 1987 | −32.9% | −30.2% | 1.09× | October 1987 crash; portfolio-insurance unwind |
| Sep 1989 – Oct 1990 | −30.3% | −12.9% | 2.34× | S&L crisis; Gulf War; 1990–91 recession |
| Jun 1998 – Aug 1998 | −20.9% | −15.6% | 1.34× | Russia default; LTCM collapse |
| Feb 2000 – Sep 2002 | −75.0% | −40.3% | 1.86× | Dot-com bust; 2001 recession; 9/11 |
| Oct 2007 – Feb 2009 | −51.8% | −52.6% | 0.99× | GFC — the single exception: broad financial-sector collapse hit non-tech segments harder |
| Dec 2021 – Dec 2022 | −33.1% | −19.4% | 1.70× | Post-COVID inflation; +402 bp Fed Funds tightening over the bear-market window (cycle peak +525 bp by Aug 2023) |
Mean drawdown ratio across all nine episodes: 1.63×. Median: 1.34×. Standard deviation: 0.60. Excluding the GFC exception: mean 1.71×, median 1.52×. All values computed from monthly closing prices in the master CSV.

Sources: Nasdaq OMX (NASDAQCOM), S&P Dow Jones Indices via Yahoo Finance. Chart: Eco3min Research.
In 8 of the 9 NDQ bear markets since 1971, the Nasdaq’s peak-to-trough decline exceeded the S&P 500’s. The single exception — the 2007–09 GFC — is itself instructive: a broad financial-sector collapse impaired non-tech segments (banks, REITs, consumer cyclicals) more heavily than the technology sector, which had already corrected severely in 2000–02 and entered the GFC with relatively lower valuations and lower exposure to the housing/credit shock.
A legitimate analytical qualification is that the pattern’s magnitude is driven by a small number of episodes. The 1983–84 (2.76×) and 1989–90 (2.34×) ratios are the two largest in the dataset. Excluding both, the mean across the remaining seven episodes is 1.36×, with the Nasdaq falling harder in 6 of 7. Conversely, excluding the two deepest absolute drawdowns (1973–74 and 2000–02) keeps the mean near 1.65×. The directional finding — 8 of 9 NDQ-harder, with the GFC as the named exception — is robust to most single-episode removals, but it is not unconditional, and the 0.99× GFC ratio is a real datapoint, not a rounding artefact.
- ▸ Real 10-year yield near 2.0%: if the ex-post real yield exceeds 3% for three consecutive months, the post-1995 regime correlation (−0.53) would historically have been associated with NDQ/SP ratio compression. The last sustained period above 3% was the early-2000s post-dot-com era; the NDQ/SP ratio fell from 328 (Feb 2000) to 137 (Aug 2002) over that window.
- ▸ NDQ/SP ratio at 339: a sustained rise above the year-2000 peak of 333 was confirmed in mid-2024; continued ratio expansion above 350 would extend the post-COVID outperformance to the longest sequence in the dataset. See our Real Interest Rates Dataset and Real Rates vs CAPE Ratio Dataset.
- ▸ Next FOMC decision and CPI release: the next scheduled FOMC meeting and Q2 2026 CPI print are the primary near-term events that could move the real-rate input. Fed Funds rate is currently 3.64% (March 2026 last verified) after the 2024–25 cutting phase.
The 1995 Regime Shift — When Tech Became “Long Duration”
NDQ/S&P 500 ratio vs real 10-year yield — pre- and post-1995
From 1972 to 1995, the Nasdaq/S&P 500 ratio moved with real rates (ρ = +0.67). After 1995, the relationship reversed (ρ = −0.53).
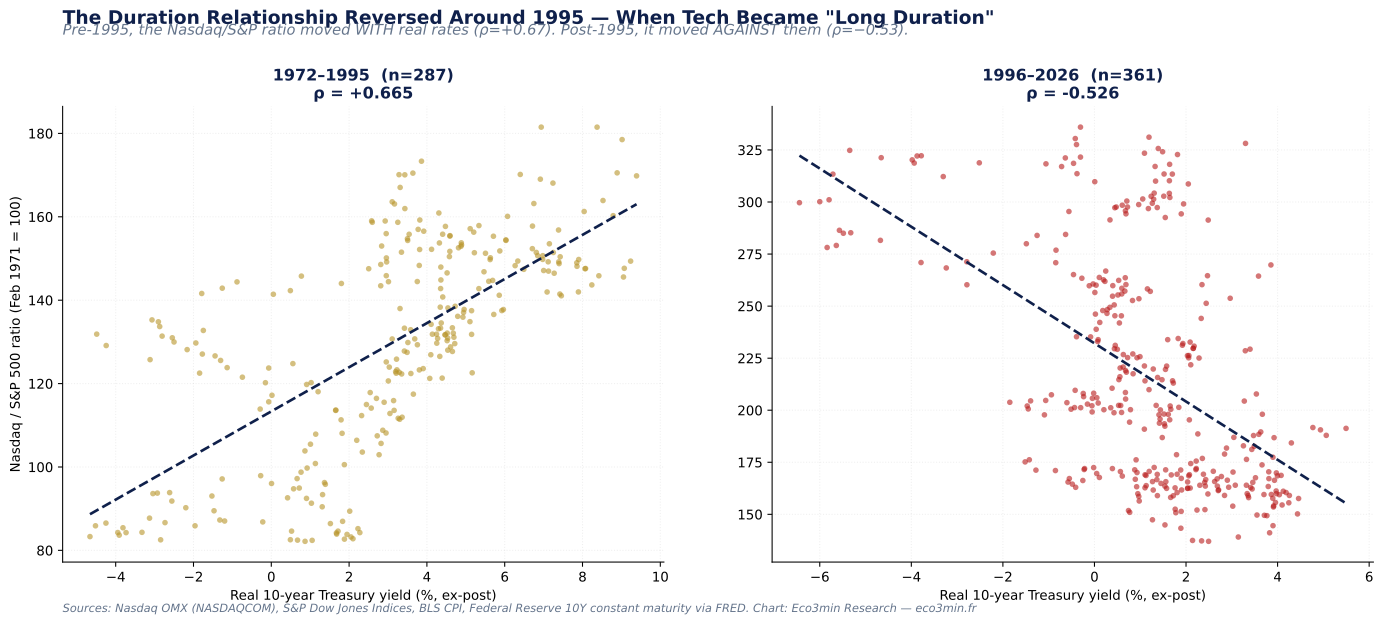
The correlation between the Nasdaq/S&P 500 ratio and the ex-post real 10-year yield is +0.665 between 1972 and 1995, and −0.526 between 1996 and 2026. The duration framing is a property of the post-1995 composition, not a 55-year constant.
Sources: Nasdaq OMX (NASDAQCOM), S&P Dow Jones Indices, BLS CPI (CPIAUCSL), Federal Reserve DGS10. Chart: Eco3min Research.
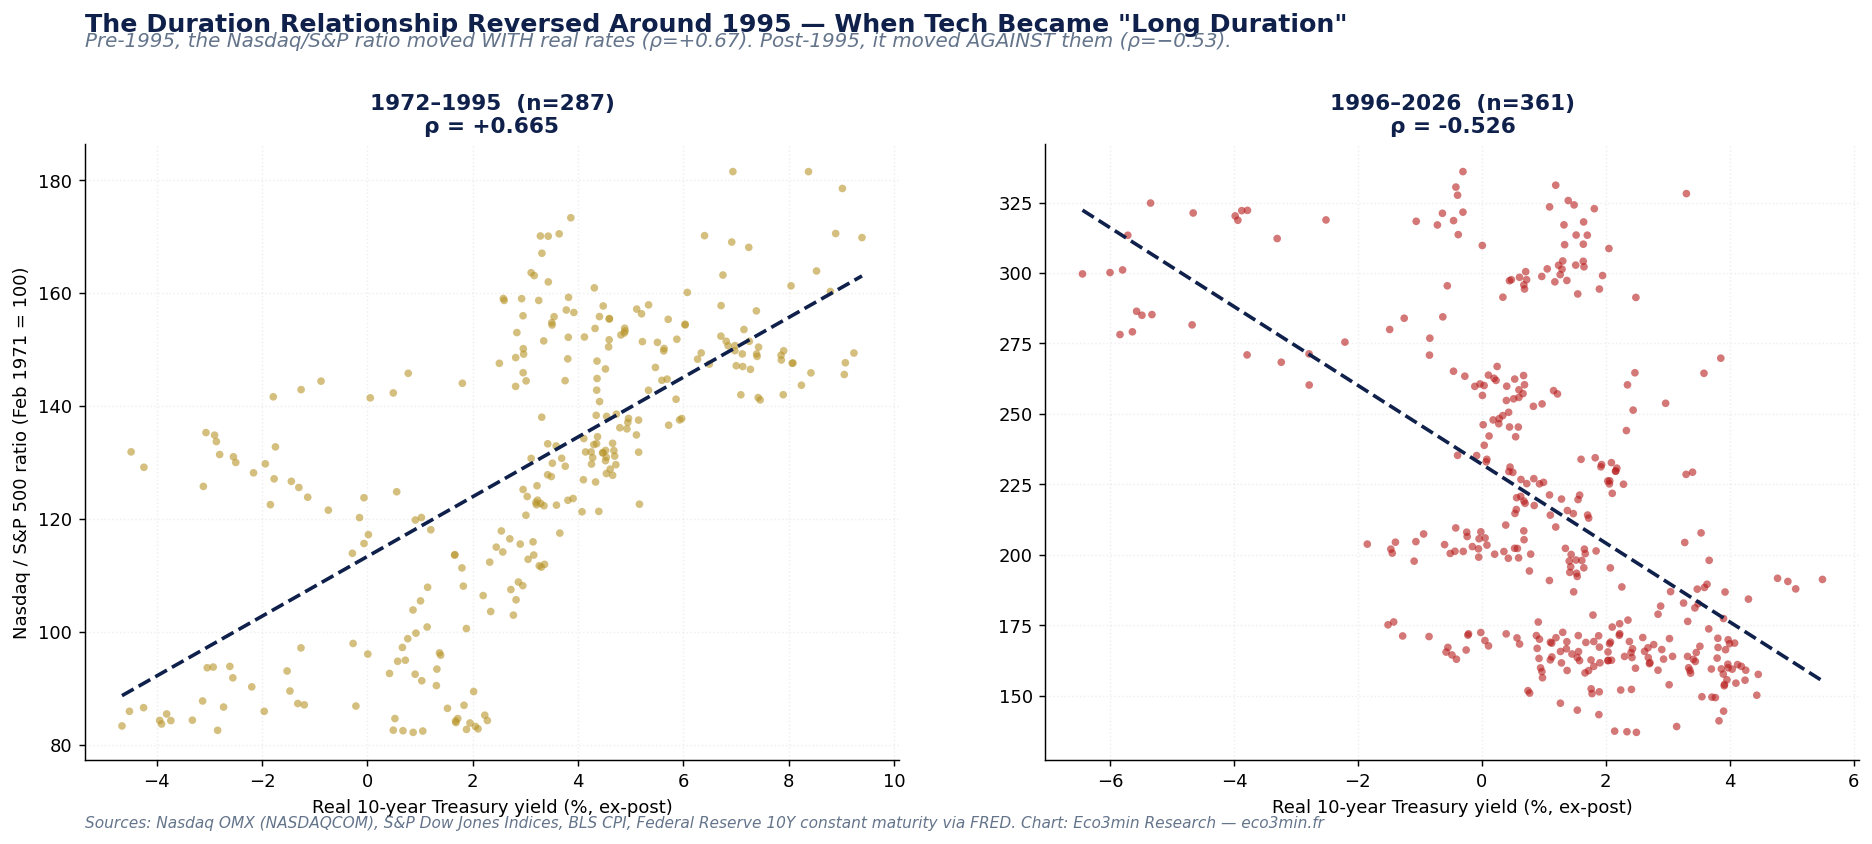
The sign reversal is the most important honest disclosure of this study. Before 1995, the Nasdaq’s relative performance moved in the same direction as real rates — high real yields coincided with a high NDQ/SP ratio, low real yields with a low ratio. After 1995, the relationship inverts. The break does not occur on a single date; running 60-month rolling correlations, the value crosses zero between 1993 and 1996 and stabilises in negative territory by 1998. A break of that kind is what a regime shift looks like in the data, the phenomenon the anatomy of macro-financial regimes since the Great Moderation tracks at the scale of the whole economy.
A legitimate analytical qualification is that this sign reversal coincides with the modern composition of the Nasdaq — the rise of software, the IPO surge of 1995–2000, and the entry of mega-cap technology firms. The “duration mechanism” therefore does not generate the post-1995 negative correlation on its own; it works through the index’s composition. If the Nasdaq’s composition were to shift again — toward shorter-duration sectors, value names, or cash-rich incumbents — the relationship with real rates could weaken even without a change in monetary policy regime.
Regime Interpretation
Historically associated with the most severe Nasdaq drawdowns. Examples: 2000–02 dot-com bust (real 10Y averaged 2.65% through the trough), 1983–84 (real 10Y at 8.4% — pre-1995 regime, where the relationship was inverted). Post-1995 occurrences in this band are concentrated and the sample for ≥4% is small (n=17 since 1995); interpret with caution.
Mixed regime band. Post-1995 observations in the 2%–4% range: n=111, median 12-month Nasdaq return +11.2%, % positive 64%. Currently the ex-post real yield sits around 2.0%, at the lower end of this band.
Post-1995 base regime. NDQ/SP ratio has historically expanded modestly here (n=162, median 12m NDQ return: +17.2%, % positive: 91%).
Negative real-rate regime. Post-1995 occurrences are concentrated in 2009–13 (post-GFC) and 2021–22 (post-COVID). Post-1995 stats: n=75, median 12m NDQ return +14.9%, % positive 68%. Sample is dominated by two distinct macro contexts (zero-bound recovery and stimulus-driven post-COVID rebound), so the small %-positive does not generalise cleanly to other negative-rate environments.
What Happened Next? Nasdaq Forward Returns by Real-Rate Regime
This table summarises 12-month forward Nasdaq returns conditional on the real 10-year yield regime at the start of the window. The sample is restricted to post-1995 monthly observations (Jan 1995 onwards through May 2025, the most recent date with a 12-month forward window observable), aligned with the regime-shift result from Section 3. The regime classifier is computed in real time from the contemporaneous CPI YoY and 10Y yield — no look-ahead.
| Real 10Y regime | n | Median NDQ 12m return | P25 – P75 | % positive 12m | Median NDQ/SP ratio change |
|---|---|---|---|---|---|
| Negative (< 0%) | 75 | +14.9% | −14.5% to +29.5% | 68% | +2.5% |
| Moderate (0%–2.5%) | 201 | +14.6% | +2.7% to +23.9% | 81% | +3.0% |
| High (≥ 2.5%) | 89 | +23.8% | +10.9% to +41.1% | 81% | +3.4% |
Post-1995, the median 12-month forward Nasdaq return is positive in all three real-rate buckets and is in fact highest in the ≥2.5% bucket (+23.8%), not lowest. This is the opposite of the simple “high real rates = poor forward returns” reading. The most likely explanation is sample composition: the ≥2.5% bucket is dominated by 2003–07 and 2023–2026, both periods that followed major bear-market troughs and captured the subsequent recovery. The drawdown asymmetry (Section 2) measures peak-to-trough behaviour during equity downturns; the forward-return table measures unconditional 12-month outcomes from any month. These are different questions, and the dataset is honest that the second does not show a clean monotonic regime relationship.
Methodological note: Returns are computed from monthly closing prices, non-overlapping in the sense that each month is one observation, but the 12-month forward windows do overlap. The classifier uses the contemporaneous ex-post real yield, computed as the 10Y monthly average minus the latest available CPI YoY. Sample is restricted to post-1995 (Jan 1995 onwards) to align with the regime-shift finding in Section 3. All three bucket sample sizes are above 70, but the ≥2.5% bucket is dominated by two long expansions (2003–07 and 2023–26) and its median is therefore strongly affected by survivorship of those particular regimes.
Past distributions are not predictive of future outcomes. Regime-conditional statistics describe historical patterns, not expected returns.
Historical Turning Points: Six Episodes That Shape the Pattern
1973–1974 — Oil shock and stagflation
The Nasdaq fell 58.4% from December 1972 (close: 133.73) to September 1974 (close: 55.67), while the S&P 500 fell 46.2% over the same window (December 1972 close: 118.05 → September 1974 close: 63.54). The drawdown ratio was 1.26×, the smallest among the pre-2000 bear markets. The Fed Funds rate rose from 5.33% to 11.34% over the same period as Burns tightened in response to the oil shock. Documentation: the Federal Reserve’s history of FOMC decisions. This episode falls inside the pre-1995 regime where the duration framing did not yet apply — the Nasdaq’s relative weakness here reflected its small-cap, financial-services-heavy composition, not technology exposure.
August–November 1987 — The October crash
The Nasdaq drawdown ratio of 1.09× is the smallest among the eight bear markets where the Nasdaq fell harder. From August 1987 (Nasdaq close: 455.0) to November 1987 (Nasdaq close: 305.2), the Nasdaq fell 32.9% while the S&P 500 fell 30.2%. This is the only episode in the dataset where the NDQ-harder ratio is close to 1 (the GFC, the other comparable case, is the exception where SP500 fell marginally harder) — the entire equity complex fell together in October 1987, driven by portfolio-insurance unwind dynamics rather than by a sectoral revaluation. No tightening cycle was active. The episode illustrates that “Nasdaq falls harder” is a property of bear markets driven by real rates and earnings revisions, not by mechanical position-unwind events.
February 2000 – September 2002 — The dot-com bust
The deepest drawdown in the dataset. The Nasdaq fell 75.0% from February 2000 (close: 4,696.7) to September 2002 (close: 1,172.1), while the S&P 500 fell 40.3% (February 2000 close: 1,366.4 → September 2002 close: 815.3). The ratio is 1.86×. The Fed Funds rate fell from 5.73% to 1.75% over the same period — yet the Nasdaq fell harder despite easing. This episode is consistent with the post-1995 negative correlation between the ratio and real rates: real rates were falling (CPI was still positive), but they were falling from a high level, and the Nasdaq’s bubble valuations compressed faster than the broader market’s.
October 2007 – February 2009 — The Global Financial Crisis (the single exception)
The only one of the nine bear markets where the S&P 500 fell harder than the Nasdaq. From October 2007 (Nasdaq close: 2,859.12) to February 2009 (close: 1,377.84), the Nasdaq fell 51.8% while the S&P 500 fell 52.6% over the same window (October 2007 close: 1,549.38 → February 2009 close: 735.09). The drawdown ratio is 0.99×. Three mechanisms plausibly explain the reversal. First, the Nasdaq had already corrected 75% in 2000–02 and entered the GFC with relatively low valuations, while the S&P 500’s exposure to financials (which collapsed) and consumer cyclicals was much greater. Second, the shock originated in the housing and credit complex, not in equity discount rates — affecting the broader index more than the tech-heavy Nasdaq. Third, the Fed Funds rate fell 454 bp over the window (from 4.76% to 0.22%), an aggressive easing that supported the long-duration tech exposure relative to the immediate cash-flow stress facing financials. The GFC is the named exception that prevents the “8 of 8” framing from being literally accurate, and it is documented here because intellectual honesty about the limits of the pattern is what makes the pattern worth citing. A related perspective: our analysis of S&P 500 ETF differences.
December 2021 – December 2022 — Post-COVID tightening
The most recent identified bear market. From December 2021 (Nasdaq close: 15,644.97) to December 2022 (close: 10,466.48), the Nasdaq fell 33.1% while the S&P 500 fell 19.4% (December 2021: 4,766.18 → December 2022: 3,839.50). The ratio is 1.70×, very close to the dataset average excluding the GFC. The Fed Funds rate rose 402 bp from 0.08% to 4.10% over the bear-market window, and continued tightening to a cycle peak of 5.33% in August 2023 (a cumulative +525 bp from the Dec 2021 floor). The ex-post real 10-year yield rose from −5.71% to −2.79% over the bear-market window (the rise into positive territory continued through 2023). This is the textbook post-1995 case: real rates rose, the ratio compressed, the Nasdaq fell harder.
2015–2018 — The cycle without a Nasdaq bear market
This tightening cycle is the only Fed tightening since 1972 where the Nasdaq’s peak-to-trough decline did not reach the 20% bear-market threshold and therefore no formal bear market is logged. Over the cycle window (November 2015 – December 2018, +215 bp Fed Funds increase), the Nasdaq fell from its August 2018 peak of 8,110 to its December 2018 trough of 6,635 — a monthly-close decline of −18.2%. Over the same window the S&P 500 fell from its September 2018 peak of 2,914 to its December 2018 trough of 2,507, a monthly-close decline of −14.0%. The Nasdaq still fell harder than the S&P 500 within the cycle window, but the magnitude was milder than every other tightening episode and missed the bear-market threshold. The cycle is named here to make clear that the 8-of-9 pattern is conditional on a bear market being triggered — not every Fed tightening produces one.
May 2026 — Current observation
The Nasdaq closed at 26,247 in May 2026, up 150.8% from the December 2022 trough. The S&P 500 closed at 7,399. The NDQ/SP ratio (Feb 1971 = 100) is at 339 — its highest level in the 55-year series, marginally above the year-2000 peak. The ex-post real 10-year yield sits around 2.0%, in the upper part of the moderate regime band. By the historical post-1995 pattern, this combination — high ratio, moderate real rates — has been associated with median 12-month Nasdaq returns of +17.2% (n=162 in the 0%–2% band), with substantial dispersion.
Methodology
This dataset combines four primary sources into 664 monthly observations spanning February 1971 to May 2026: Nasdaq Composite price (NASDAQCOM via FRED, derived from Nasdaq OMX), S&P 500 price (^GSPC via Yahoo Finance), 10-year Treasury constant-maturity yield (DGS10 via FRED), Federal Funds effective rate (FEDFUNDS via FRED), and Consumer Price Index for All Urban Consumers (CPIAUCSL via BLS, accessed via FRED).
NDQ/SP ratio = (Nasdaq close / S&P 500 close) × (Feb 1971 baseline factor)
Bear-Market and Tightening-Cycle Selection
peak = highest monthly close over the 24-month window ending at t
candidate trough = min(close) over [peak, t+max] until close ≥ peak × 0.95
if drawdown ≥ 20%: classify [peak, trough] as bear market
Fed Funds tightening cycle:
start = local minimum of Fed Funds where the 24-month forward rise ≥ 150 bp
end = peak Fed Funds reached without an intervening cut > 50 bp
Sensitivity: lowering the bear-market threshold to 15% adds five episodes to the baseline 9-BM list (1978, 1980, 2011, 2018, 2020), bringing the total to 14 episodes, with the Nasdaq falling harder in 11 of 14 (the three exceptions: 2007–09 GFC, 2011 European crisis, 2020 COVID — the latter two being short and synchronised across asset classes). Raising the threshold to 25% drops 1998 LTCM (NDQ −20.9%), leaving 8 episodes, with the Nasdaq falling harder in 7 of 8 (the GFC remains the exception). The headline pattern — Nasdaq falls harder in most bear markets but not the GFC — is robust to threshold choice in the 15%–25% range.
Real-rate measurement choice
We use ex-post real rates (nominal yield minus contemporaneous CPI YoY) rather than TIPS-implied real rates because the TIPS series begins only in 2003. The ex-post measure gives a uniform 55-year series. For 2003 onward, the correlation between the ex-post and TIPS-implied real 10-year yields is +0.79 in monthly observations; substituting TIPS where available does not change the sign or significance of the 1996–2026 NDQ/SP ratio correlation result. This methodology follows the convention used in Reinhart & Sbrancia (2011, “The Liquidation of Government Debt”).
Dataset Design
| Variable | Type | Unit | Source | Calculation |
|---|---|---|---|---|
| date | str | YYYY-MM-DD | derived | End-of-month date |
| nasdaq_sp500_ratio_idx | float | index (Feb 1971 = 100) | derived | (NDQ_t/SP_t) / (NDQ_0/SP_0) × 100 |
| ust_10y_yield_eom | float | % annualized | DGS10 via FRED | End-of-month value |
| ust_10y_yield_avg | float | % annualized | DGS10 via FRED | Monthly mean of daily values |
| fed_funds_rate | float | % annualized | FEDFUNDS via FRED | direct |
| cpi_index | float | 1982–84 = 100 | CPIAUCSL via FRED | direct |
| cpi_yoy_pct | float | % YoY | derived | (CPI_t / CPI_{t−12} − 1) × 100 |
| real_10y_yield_pct | float | % annualized | derived | ust_10y_yield_avg − cpi_yoy_pct |
| real_rate_regime | str | Negative / Moderate / High | derived | < 0%, 0–2.5%, ≥ 2.5% |
| tightening_cycle_id | str | C1–C8 | derived | Algorithm above |
| ndq_bear_market_id | str | BM1–BM9 | derived | Algorithm above |
| nasdaq_fwd12m_pct | float | % 12-month | derived | (NDQ_{t+12} / NDQ_t − 1) × 100 |
| sp500_fwd12m_pct | float | % 12-month | derived | (SP_{t+12} / SP_t − 1) × 100 |
Python Reproduction Code
# Reproduce this dataset from primary sources
import pandas as pd
import yfinance as yf
from fredapi import Fred

fred = Fred(api_key='YOUR_FRED_KEY')
nasdaq = yf.download('^IXIC', start='1971-02-01')['Close'].resample('M').last()
sp500  = yf.download('^GSPC', start='1971-01-01')['Close'].resample('M').last()
dgs10  = fred.get_series('DGS10').resample('M').mean()
cpi    = fred.get_series('CPIAUCSL')
fedfunds = fred.get_series('FEDFUNDS')

cpi_yoy = (cpi / cpi.shift(12) - 1) * 100
real_10y = dgs10 - cpi_yoy
ratio = (nasdaq / sp500) / (nasdaq.iloc[0] / sp500.iloc[0]) * 100

# Bear-market identification: rolling 24m peak, then min until +5% from trough
# Full implementation in /scripts/build_csv.py in dataset bundle
Dataset Download & Reproducibility
664 observations · Monthly · February 1971 – May 2026 · 18 columns including bear-market and tightening-cycle identifiers · Source terms: the Nasdaq Composite and S&P 500 index levels are licensed by their providers and are not redistributed in this file; it carries the rebased ratio, returns, drawdown identifiers and public-domain FRED series. Not sub-licensed under Creative Commons.
Data Sources & References
- Primary Nasdaq OMX, Nasdaq Composite Index (NASDAQCOM), daily closing prices, accessed via FRED (St. Louis Fed), May 2026.
- Primary S&P Dow Jones Indices, S&P 500 Index (^GSPC), daily closing prices, accessed via Yahoo Finance, May 2026.
- Primary Board of Governors of the Federal Reserve System, 10-Year Treasury Constant Maturity Rate (DGS10), accessed via FRED, May 2026.
- Primary Board of Governors of the Federal Reserve System, Federal Funds Effective Rate (FEDFUNDS), accessed via FRED, May 2026.
- Primary U.S. Bureau of Labor Statistics, Consumer Price Index for All Urban Consumers (CPIAUCSL), accessed via FRED, May 2026.
- Research Reinhart, C. M. & Sbrancia, M. B. (2011), “The Liquidation of Government Debt,” NBER Working Paper 16893.
- Research Lettau, M. & Wachter, J. A. (2007), “Why Is Long-Horizon Equity Less Risky? A Duration-Based Explanation of the Value Premium,” Journal of Finance, 62(1), 55–92.
- Reference National Bureau of Economic Research, US Business Cycle Expansions and Contractions.
Methodological Limitations
- The Nasdaq Composite’s sectoral composition has shifted materially across the period. Pre-1995, the index was small-cap and financials-heavy; post-1995, it is technology-dominated. Cross-period comparisons of sensitivity to real rates capture composition effects as much as duration effects per se.
- All return calculations use index price levels, not total returns. Dividends, which were materially higher for the S&P 500 than the Nasdaq across most of the period, are not reinvested.
- Ex-post real rates use contemporaneous CPI YoY rather than market-implied inflation expectations. The two measures diverge during periods of inflation surprise. TIPS-implied real yields are available only from 2003; correlation with ex-post is +0.79 over the overlap.
- The sample of n=9 NDQ bear markets is small. The 8-of-9 directional pattern (with the GFC named as the exception) is robust to threshold sensitivity in the 15–25% range, but statistical significance against any specific null hypothesis is not claimed.
- Forward 12-month return windows overlap. The “% positive” and median figures describe the empirical distribution of outcomes, not independent observations.
- The 1995 break in the correlation is identified visually and via rolling correlation; we do not apply formal structural-break statistical tests (Chow, Bai-Perron) to date the change precisely. The break is treated as an empirically observed regime change, not a precisely datable event.
Frequently Asked Questions
How much harder has the Nasdaq fallen than the S&P 500 in past bear markets?
Across the nine Nasdaq bear markets between 1971 and 2026, the Nasdaq’s peak-to-trough drawdown exceeded the S&P 500’s in 8 of 9 cases. The single exception is the 2007–09 Global Financial Crisis, where the S&P 500 fell marginally harder than the Nasdaq (−52.6% vs −51.8%, ratio 0.99×). Across all nine episodes the average ratio is 1.63× (1.71× excluding the GFC), with a range from 0.99× (2007–09 GFC) to 2.76× (1983–84). The deepest single Nasdaq drawdown was −75.0% during the 2000–02 dot-com bust, against a −40.3% S&P 500 drawdown over the same window (ratio: 1.86×).
Is the “Nasdaq falls harder during tightening cycles” rule reliable?
It depends on the framing. Looking at NDQ bear markets ≥20%, 8 of 9 saw the Nasdaq fall harder; the 2007–09 GFC is the single exception. Looking instead at formal Fed Funds tightening cycles (defined as ≥150 bp increases without a >50 bp intervening cut), the 2015–18 cycle is the only one since 1972 where no NDQ bear market was triggered: the Nasdaq’s peak-to-trough decline on monthly close was −18.2%, below the 20% threshold. Within that cycle the Nasdaq still fell harder than the S&P 500 (−18.2% vs −14.0%), but the absolute magnitude was milder than every other tightening episode in the dataset. The bear-market framing produces the cleaner pattern; the tightening-cycle framing reveals that not every Fed tightening triggers a Nasdaq bear market in the first place.
What is the correlation between the Nasdaq/S&P 500 ratio and the real 10-year Treasury yield?
It depends on the period. From 1972 to 1995, the correlation is +0.665 (n=287 monthly observations) — the ratio and real yields moved together. From 1996 to 2026, the correlation is −0.526 (n=361). Over the full 1972–2026 period, the correlation is −0.296. The sign reversal around 1995 coincides with the modernisation of the Nasdaq Composite’s composition (rise of large-cap technology, software, and platform businesses).
Does this dataset prove that real rates cause the Nasdaq to fall harder?
No. The dataset documents a correlation in the post-1995 era and a sign-reversed correlation in the pre-1995 era. Correlation is consistent with the “long-duration tech equities” framing but does not isolate it from confounding mechanisms: composition shift (the Nasdaq holds different companies in 2026 than in 1971), beta differential (the Nasdaq has higher market beta, ≈1.2), earnings cyclicality (technology earnings respond differently to growth than utilities), and credit sensitivity. Any one of these can amplify drawdowns independently of a duration channel.
What is the current state of the Nasdaq/S&P 500 ratio?
As of May 2026, the Nasdaq Composite closed at 26,247 and the S&P 500 at 7,399. The NDQ/SP ratio normalised to February 1971 = 100 is 339 — the highest level in the 55-year series, marginally above the previous year-2000 peak. The ex-post real 10-year Treasury yield sits at approximately 2.0%, in the upper part of the moderate-real-rate regime band.
What does this dataset not measure?
The dataset tracks nominal price-level drawdowns, not total returns — dividends are excluded. It does not control for sector composition, market beta, or earnings cyclicality. It does not test the duration mechanism causally; the regime-shift finding (sign reversal around 1995) is an empirical observation, not a structural-break test. Forward-return distributions are conditional on observed regimes and use overlapping 12-month windows. For total-return data, see S&P Dow Jones Indices; for sector decomposition, see our S&P 500 Sector Weights Dataset.
How does the 2021–22 Nasdaq decline compare to historical episodes?
The December 2021 – December 2022 decline of −33.1% (versus the S&P 500’s −19.4%, ratio 1.70×) is very close to the dataset average ratio of 1.71× (excluding the GFC) and 1.63× (across all nine episodes). The Nasdaq’s −33.1% drawdown is shallower than the 2000–02 dot-com bust (−75.0%), the 1973–74 stagflation episode (−58.4%), and the 2007–09 GFC (−51.8%), but deeper than the 1981–82, 1983–84, 1987, 1989–90, and 1998 episodes. The Fed Funds rate rose 402 bp over the bear-market window (Dec 2021 → Dec 2022) and reached a cycle peak of 5.33% in August 2023 (+525 bp from the Dec 2021 floor), and the ex-post real 10-year yield rose from −5.71% to −2.79% — making this the most textbook post-1995 tightening-driven episode in the dataset. More context: our panorama of historical market crises.
Source
Related Eco3min Research
Last updated — 16 September 2026
Disclaimer – Financial Information: The analyses, commentary, and content published on eco3min.fr are provided for informational and educational purposes only. They do not constitute investment advice or a solicitation to buy or sell financial instruments. Past performance is not indicative of future results. All investment decisions involve risk and are the sole responsibility of the reader.