
Big Tech Free Cash Flow: Quarterly Operating Cash Flow Minus Capital Expenditure for Six US Tech Firms Since 2017
The Big Tech Free Cash Flow dataset tracks what the six largest US technology firms have left once capital expenditure is paid for. It is an Eco3min composite: operating cash flow minus cash paid for property, plant and equipment, both taken straight from SEC filings rather than from company-defined adjusted measures. Big Tech free cash flow is covered here for Apple, Microsoft, Alphabet, Amazon, Meta and NVIDIA — 223 quarterly observations from 2017 to 2026, extracted from the SEC EDGAR XBRL API. The dataset also carries capital expenditure as a share of operating cash flow, which shows how much of each dollar earned is being converted into physical infrastructure.
Dataset: Big Tech Free Cash Flow, quarterly (2017–2026) · Six US technology firms · Source: SEC EDGAR XBRL
Capital expenditure as a share of operating cash flow, four-quarter trailing. Source: SEC EDGAR (10-K, 10-Q, 8-K) · US Securities and Exchange Commission
Columns: ticker, company, calendar_year, calendar_quarter, quarter_end_date, revenue, capex, capex_to_revenue_pct, operating_cash_flow, free_cash_flow, capex_to_ocf_pct, source
Macro Takeaway
Free cash flow measures the point at which an investment cycle stops being funded by current operations. A firm can raise capital expenditure indefinitely as long as operating cash flow grows alongside it; the constraint binds when capex approaches or exceeds what operations generate, because the difference must then come from cash reserves, asset sales or external financing. For the six firms in this dataset, annual average capital expenditure ran between 3.6% and 21.6% of revenue in 2019; in the second quarter of 2026 the same measure spans 2.2% at one end and 49.5% at the other. Measured against operating cash flow in a single quarter, the 2026 readings run from 3% to 170%; smoothed over four trailing quarters, from 5% to 107%. That dispersion is the analytically interesting part: the same technology cycle is producing opposite cash-flow signatures depending on whether a company is building the infrastructure or supplying it. The threshold itself is not unprecedented — Amazon spent seven consecutive quarters above 100% between 2021 and 2023 — but it is the first time four firms have approached it at once. The same tension appears in the arbitrage between capital expenditure and shareholder distributions, where cash committed to physical assets is cash not returned through buybacks or dividends.
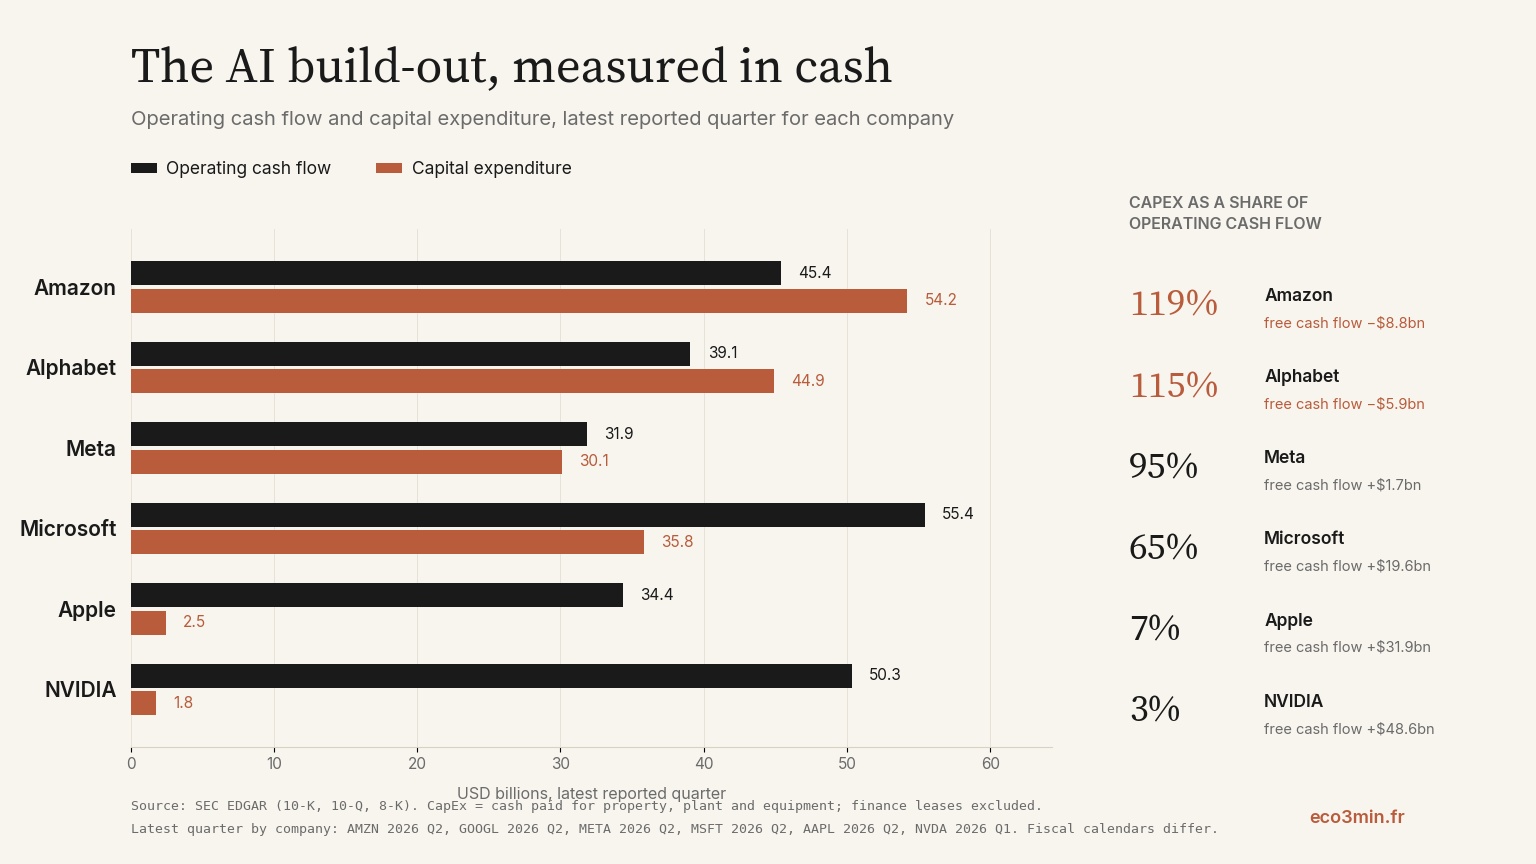
In the quarter ended 30 June 2026, Alphabet reported $39.1bn of operating cash flow against $44.9bn of capital expenditure, producing free cash flow of −$5.9bn — the only negative quarter among the 39 observations for the company in this dataset. Amazon reported −$8.8bn on the same basis, though 14 of its 37 quarters since 2017 have been negative, a seasonal pattern tied to working-capital reversal after the fourth quarter. Meta reported the highest capex-to-revenue ratio in the dataset at 49.5%, with free cash flow compressed to $1.7bn from $13.2bn the previous quarter. Microsoft remained positive at $19.6bn, and NVIDIA, whose most recent reported quarter ended in April, generated $48.6bn of free cash flow on $1.8bn of capital expenditure.
Construction & Components
The composite isolates the cash consequence of the capital expenditure cycle. It deliberately avoids company-defined “adjusted” or “normalised” free cash flow figures, which vary in treatment of leases, acquisitions and equity compensation and are therefore not comparable across the six firms.
Formula:
Free Cash Flow    = NetCashProvidedByUsedInOperatingActivities − PaymentsToAcquirePropertyPlantAndEquipment
CapEx / OCF (%)   = PaymentsToAcquirePropertyPlantAndEquipment / NetCashProvidedByUsedInOperatingActivities × 100
Components:
- Operating cash flow — SEC XBRL tag
NetCashProvidedByUsedInOperatingActivities— reported quarterly, year-to-date cumulative. Represents cash generated by the business before investment decisions. - Capital expenditure — SEC XBRL tag
PaymentsToAcquirePropertyPlantAndEquipment, orPaymentsToAcquireProductiveAssetsfor Amazon and certain NVIDIA filings — quarterly, year-to-date cumulative. Cash paid for property, plant and equipment, taken from the investing section of the cash flow statement. - Revenue — SEC XBRL tag
RevenueFromContractWithCustomerExcludingAssessedTax, orRevenuesfor NVIDIA — used for the capex-to-revenue ratio carried alongside.
Frequency reconciliation: SEC XBRL reports cash flow items as year-to-date cumulative figures within each fiscal year, not as discrete quarters. Individual quarters are recovered by differencing periods that share a start date; only segments of 80 to 100 days are retained. The final fiscal quarter appears exclusively in the 10-K, never in a 10-Q, and is therefore derived as the full year minus the nine-month figure. Fiscal calendars differ across the six firms, so each observation is assigned to the calendar quarter containing the midpoint of its reporting period, with the exact period end date preserved in the CSV.
Coverage: 2017 to 2026 for the composite. Individual series extend further back where filings permit — Microsoft to 2008, Meta to 2011, NVIDIA to 2011 — but the published dataset starts in 2017, the first year in which all six firms have continuous quarterly coverage.
Dataset Overview
| Indicator | Big Tech Free Cash Flow, quarterly (2017–2026) |
|---|---|
| Geography | United States (six SEC registrants) |
| Frequency | Quarterly |
| Period | 2017–2026 |
| Entities | AAPL, MSFT, GOOGL, AMZN, META, NVDA |
| Observations | 223 |
| Variables | ticker, company, calendar_year, calendar_quarter, quarter_end_date, revenue_usd_millions, capex_usd_millions, capex_to_revenue_pct, operating_cash_flow_usd_millions, free_cash_flow_usd_millions, capex_to_ocf_pct, source |
| Format | CSV |
| Sources | SEC EDGAR XBRL API (10-K, 10-Q); company press releases (8-K, Exhibit 99.1) for the most recent quarter pending 10-Q filing |
Dataset Variables
The CSV contains the following columns.
| Column | Type | Description |
|---|---|---|
ticker | String | Exchange ticker (AAPL, MSFT, GOOGL, AMZN, META, NVDA) |
company | String | Registrant name as filed with the SEC |
calendar_year | Integer | Calendar year containing the midpoint of the reporting period |
calendar_quarter | String | Calendar quarter (Q1–Q4), assigned by period midpoint |
quarter_end_date | Date (YYYY-MM-DD) | Actual fiscal period end date as filed |
revenue_usd_millions | Float | Quarterly revenue |
capex_usd_millions | Float | Cash paid for property, plant and equipment |
capex_to_revenue_pct | Float | Capital expenditure as a percentage of revenue |
operating_cash_flow_usd_millions | Float | Net cash provided by operating activities |
free_cash_flow_usd_millions | Float | Operating cash flow minus capital expenditure |
capex_to_ocf_pct | Float | Capital expenditure as a percentage of operating cash flow |
source | String | xbrl for values from filed 10-K/10-Q XBRL data; press_release_8k for the most recent quarter before the 10-Q is filed |
Column names match the CSV headers exactly.
Source Data Access — SEC EDGAR
All underlying values come from public SEC filings. Company facts are available per registrant from the XBRL API, keyed by Central Index Key:
https://data.sec.gov/api/xbrl/companyconcept/CIK0000789019/us-gaap/PaymentsToAcquirePropertyPlantAndEquipment.json
The SEC requires a descriptive User-Agent header containing a contact email on all programmatic requests. CIKs used here: Apple 0000320193, Microsoft 0000789019, Alphabet 0001652044, Amazon 0001018724, Meta 0001326801, NVIDIA 0001045810.
Direct CSV Access — Eco3min Structured Dataset
https://eco3min.fr/wp-content/uploads/2026/07/big_tech_capex_fcf_2017_2026.csv
This URL returns the complete dataset in CSV format. It can be used directly in pandas, R, curl, or any data tool.
Using the Dataset in Python
import pandas as pd

url = "https://eco3min.fr/wp-content/uploads/2026/07/big_tech_capex_fcf_2017_2026.csv"
df = pd.read_csv(url, parse_dates=["quarter_end_date"])

# capex as a share of operating cash flow, latest quarter per company
latest = df.sort_values("quarter_end_date").groupby("ticker").tail(1)
print(latest[["ticker", "quarter_end_date", "capex_to_ocf_pct", "free_cash_flow_usd_millions"]])
Using the Dataset in R
library(readr)
library(dplyr)

url <- "https://eco3min.fr/wp-content/uploads/2026/07/big_tech_capex_fcf_2017_2026.csv"
df  <- read_csv(url)

df %>%
  arrange(quarter_end_date) %>%
  group_by(ticker) %>%
  slice_tail(n = 1) %>%
  select(ticker, quarter_end_date, capex_to_ocf_pct, free_cash_flow_usd_millions)
Both examples load the dataset directly from the URL — no download or API key required.
Methodology
Values are pulled from the SEC EDGAR XBRL API, one concept at a time, per registrant. For each company the extractor collects every reported period for revenue, operating cash flow and capital expenditure, keeping the most recently filed value when a period appears in more than one filing. Restated figures therefore supersede originals automatically.
Quarterly segments are then reconstructed from cumulative periods, as described in Construction & Components. The dataset is refreshed after each reporting season. In the window between a company’s earnings release and the filing of its 10-Q or 10-K, the most recent quarter is populated from the figures in the 8-K press release exhibit and flagged in the source column; those rows are replaced automatically by XBRL values once the periodic report is filed. No value is interpolated, smoothed or estimated at any point.
Data Quality & Provider Notes
Latency is set by the SEC filing calendar rather than by the pipeline. A 10-Q typically appears within a few days to two weeks of the earnings release, and a 10-K somewhat later; the composite cannot be fresher than the filings it reads. NVIDIA’s fiscal year ends in late January, so its most recent quarter is structurally one period behind the calendar-aligned firms.
Revisions propagate. When a company restates a prior period, the XBRL API returns both the original and the restated fact; the extractor retains the value with the later filing date, so the entire series upstream of a restatement is refreshed on the next run rather than patched.
Some quarters are missing, and none have been filled. Amazon has no separable quarterly capital expenditure between March and September 2017. NVIDIA has five gaps between 2017 and 2023, including the whole of its fiscal 2023 interim periods: the company did not tag interim capital expenditure in those filings, so no quarterly value can be derived from the cumulative figures. Annual totals for those years are complete and unaffected.
No native equivalent of this series is published. Company-reported free cash flow appears in individual earnings releases on inconsistent definitions, and commercial terminals provide the underlying line items but not a harmonised cross-company quarterly ratio built on identical XBRL tags.
What This Dataset Captures (And What It Doesn’t)
The composite describes the cash-flow arithmetic of an investment cycle. It is a structural indicator of capital intensity, not a valuation measure and not a timing tool.
What it captures:
- The share of operating cash flow being converted into physical assets, on a definition identical across six firms.
- The point at which capital expenditure crosses what operations generate, and how long it stays there.
- The divergence between firms building infrastructure and firms supplying it, within the same technology cycle.
What it does NOT capture (common misinterpretations):
- Negative free cash flow is not a measure of financial distress. Each of these firms holds substantial cash and marketable securities and retains access to debt markets. A negative quarter describes an allocation decision and its timing, not an inability to meet obligations.
- Quarterly free cash flow is seasonal for some firms. Amazon’s first calendar quarter is routinely negative because working capital reverses after the holiday period, and 14 of its 37 quarters since 2017 are negative for that reason. Comparing a single quarter across companies without reference to that pattern produces a misleading picture.
- Finance leases are excluded. Capital expenditure here is cash paid for property, plant and equipment as reported in the investing section of the cash flow statement. Firms that fund infrastructure through finance leases record those commitments elsewhere, so the capital intensity of Microsoft and Meta in particular is understated relative to the figures they cite in their own capital expenditure guidance.
- The capex-to-cash-flow ratio is unstable when operating cash flow is small. The denominator is a quarterly flow that can approach zero or turn negative, which makes the percentage very large or meaningless in those periods. Between 2017 and 2019 the ratio ranged from −173% to +178% across the panel for that reason alone. It is interpretable for a given firm-quarter only when operating cash flow is comfortably positive, and the underlying dollar figures in the CSV are the more robust basis for cross-period comparison.
- The ratio says nothing about the return on the capital deployed. A capex-to-operating-cash-flow ratio above 100% describes the cash position in a given quarter. It carries no information about the revenue, margin or asset life that the expenditure may eventually produce, and the dataset contains no measure of those.
The series is most useful for characterising where each firm sits in its own capital expenditure cycle relative to its own history, rather than for ranking companies against each other in a single quarter.
Historical Regimes
2017–2019 — Stable capital intensity. Capital expenditure ran between 5.2% and 26.1% of revenue across the four infrastructure-heavy firms, and below 8% at Apple and NVIDIA throughout, with Amazon at a 2019 average of 6.0%, Microsoft at 10.1%, Alphabet at 14.6% and Meta at 21.6%. Free cash flow was positive in every quarter for five of the six companies. Cloud infrastructure was expanding, but from a base small enough that operating cash flow grew faster than the investment required to support it.
2020–2021 — Pandemic demand and logistics build-out. Amazon’s ratio rose from 9.0% of revenue in the first quarter of 2020 to a peak of 14.2% in the third quarter of 2021 as fulfilment capacity was expanded. The other firms saw more modest increases. Measured against operating cash flow rather than revenue, the picture is sharper: Amazon crossed 100% on a four-quarter trailing basis in the third quarter of 2021 and kept rising.
2022 — Amazon’s peak, and Meta’s divergence. The largest capital-intensity episode in this dataset is not the current one. Amazon’s capital expenditure peaked at 183.7% of trailing operating cash flow in the second quarter of 2022 — $65bn against $36bn generated over the preceding year — and stayed above 100% for seven consecutive quarters, from the third quarter of 2021 to the first quarter of 2023. Both terms moved: capital expenditure rose while trailing operating cash flow fell from $67bn to $36bn as post-pandemic demand normalised. In the same year Meta’s capital expenditure reached 33.8% of revenue, then its own highest reading, while revenue growth stalled — the first episode in which a firm’s investment programme visibly outpaced its own revenue trajectory.
2023 — Consolidation. Both programmes were cut. Amazon’s trailing ratio returned below 100% of operating cash flow, and its capital expenditure fell to 8.5% of revenue; Meta’s fell back to roughly 19% of revenue. Capital intensity across the group returned close to its 2021 range. This is the only sustained pull-back visible in the series.
2024–2025 — Sustained escalation. Every ratio rose without interruption. Microsoft moved from 15.7% at the end of 2023 to 25.0% by the third quarter of 2025; Meta from 18.9% to 36.7% over the same window; Amazon from 8.6% to 19.5%. Operating cash flow continued to grow, so free cash flow stayed positive throughout, but the margin narrowed steadily.
2026 — Four firms approach the threshold. In the quarter ended 30 June 2026, capital expenditure reached 49.5% of revenue at Meta, 39.8% at Microsoft, 37.5% at Alphabet and 27.0% at Amazon. Measured against operating cash flow rather than revenue, Amazon stood at 119% and Alphabet at 115%, producing negative free cash flow of −$8.8bn and −$5.9bn respectively. For Alphabet this is the only negative quarter among its 39 observations in this dataset. On a four-quarter trailing basis Amazon is at 107%, below its own 2022 peak of 183.7%, while Alphabet, Meta and Microsoft sit between 63% and 71% — higher than at any earlier point in their own series, but not yet at the level Amazon reached. Apple and NVIDIA remained at the opposite end of the distribution, at 7% and 3% of operating cash flow.
Related Datasets
- Big Tech CapEx-to-Revenue Ratio — the same six firms measured against revenue rather than cash flow, from the same extraction.
- S&P 500 Earnings Yield — aggregate US equity earnings relative to price.
- US Equity Risk Premium — the spread between equity earnings yield and long-term real rates.
- US Investment Grade Credit Spread — the cost of corporate debt financing.
Related Research
- AI Capex vs Historical Mega-Investments — the current capital expenditure cycle placed against a century of comparable US investment programmes.
- Dividends, Buybacks and Total Shareholder Yield — how distribution policy competes with capital expenditure for the same cash.
- Equity Markets and ETFs: Structure, Valuations, Cycles — the analytical framework this dataset feeds into.
Browse all Eco3min datasets and studies →
Cite as: Eco3min, “Big Tech Free Cash Flow — Quarterly Dataset (2017–2026),” eco3min.fr, July 2026. https://eco3min.fr/en/big-tech-free-cash-flow-quarterly-dataset/
Last updated — 4 August 2026
Disclaimer – Financial Information: The analyses, commentary, and content published on eco3min.fr are provided for informational and educational purposes only. They do not constitute investment advice or a solicitation to buy or sell financial instruments. Past performance is not indicative of future results. All investment decisions involve risk and are the sole responsibility of the reader.