
Big Tech AI Capex 2025–2026: $1.1 Trillion in 24 Months vs Apollo, Marshall and Manhattan Combined
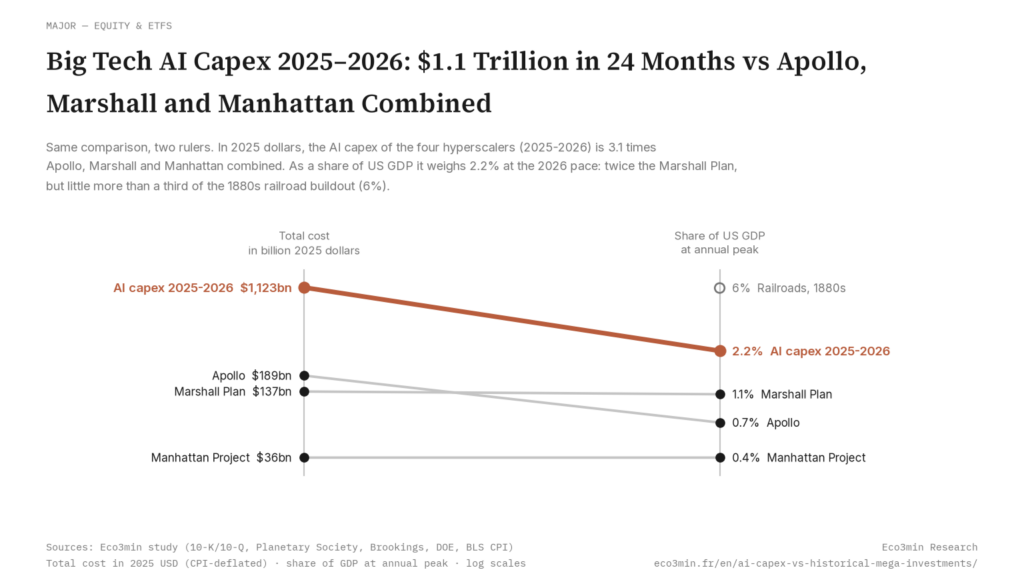
Big Tech AI capex vs America's biggest mega-projects
All figures in 2025 USD (CPI-adjusted, BLS). Toggle the AI capex bar to see breakdowns.
Across calendar years 2025 and 2026, the four largest US technology companies are committed to spend approximately $1.12 trillion on capital expenditures, the overwhelming majority of which is dedicated to AI infrastructure. In 2025 dollars, this 24-month figure exceeds the combined inflation-adjusted cost of the Apollo Program, the Marshall Plan, and the Manhattan Project — three of the most-cited civilian mega-investments of the 20th century — by a factor of approximately 3.1.
This page documents the AI capex effort against the broader distribution of US mega-investment programs since 1900, with the underlying dataset available for download. The narrower point established by the data is that the 2025–2026 hyperscaler capex cohort belongs to a small, identifiable set of resource-mobilization episodes rather than to the routine pattern of US corporate capital expenditure cycles. The single most-cited historical analogue at comparable private-sector scale — the 1996–2000 telecom and fiber buildout — is documented separately because, unlike the public programs in the cluster, it permits a direct comparison of post-buildout trajectories for the firms that did the investing.
Key Findings at a Glance
Period covered: 2025 actual + 2026 guided capex (calendar years), with historical comparators 1900–2026
Companies covered: Amazon, Microsoft, Alphabet, Meta — the four largest US hyperscalers by capex
2025 capex (actual, calendar year): $413 billion
2026 capex (guided, calendar year): ~$710 billion (midpoints of company guidance)
24-month total: ~$1,123 billion
Apollo Program (2025 USD, CPI-adjusted): $189 billion
Marshall Plan (2025 USD, CPI-adjusted): $137 billion
Manhattan Project (2025 USD, CPI-adjusted): $36 billion
Combined three historical programs: $362 billion
Ratio AI capex / combined three: ≈3.1×
AI capex annual run-rate (2026E) vs Apollo peak (1966, in 2025 USD): ≈$355B/year vs ≈$31B/year ≈ 11×
Closest private-sector analogue by scale: US telecom and fiber buildout, 1996–2000 — ~$500 billion in 2025 USD over 5 years
Closest public-sector analogue by scale: Interstate Highway System, 1956–1991 — ~$580 billion in 2025 USD over 35 years (cumulative federal outlay)
Of the closest historical analogues, the public-sector programs (Apollo, Marshall, Manhattan, Interstate) ended on schedule with the underlying capability delivered, and offer no equity-return outcome to compare. The closest private-sector analogue (telecom 1996–2000) ended in a capital-cycle bust during which the equity of the firms that did the building underperformed materially even though the underlying technology proved transformative. See What happened next, in each case. See also: Our equity-markets pillar.
A small set of historic mega-investments
Across more than a century of US economic history, episodes in which a quantifiable mega-investment of $50 billion or more (in 2025 USD) was concentrated into a defined program of fewer than ten years are rare. The full enumerable set, excluding wartime military spending and ongoing baseline expenditures such as the federal highway maintenance program, contains fewer than a dozen entries. The cluster includes the Manhattan Project, the Marshall Plan, the Apollo Program, the Interstate Highway System (which spans 35 years and is therefore not strictly comparable to a concentrated buildout), the Strategic Defense Initiative, the International Space Station program, and the late-1990s US telecom and fiber-optic buildout. To this set, the 2025–2026 AI capex cohort now adds the largest single observation by total dollar amount.
The earliest of the comparable cases is the Manhattan Project, which between 1942 and 1946 cost approximately $1.89 billion in then-current dollars, or roughly $36 billion in 2025 USD using the BLS Consumer Price Index. The program produced two operational nuclear weapons and a research and engineering capability that subsequently became the US nuclear weapons complex. The Marshall Plan, formally the European Recovery Program, transferred approximately $13.3 billion to seventeen Western European economies between 1948 and 1952, equivalent to about $137 billion in 2025 USD. The Apollo Program, including its Gemini and robotic precursors, cost approximately $25.4 billion in then-current dollars between 1960 and 1973, or about $189 billion in 2025 USD on a CPI basis. (Using NASA’s New Start Index, an aerospace-specific deflator, the figure rises to approximately $309 billion; the methodology section below documents this distinction.)
Against this set of three civilian programs, which together cost approximately $362 billion in 2025 dollars, the four largest US technology companies will spend approximately $1.12 trillion on capital expenditures across calendar years 2025 and 2026. The 2025 figure is observed: Amazon’s $131.8 billion, Microsoft’s $117.9 billion (sum of calendar quarters), Alphabet’s $91.4 billion, and Meta’s $72.2 billion sum to $413 billion, sourced from Q4 2025 earnings releases and 10-K filings. The 2026 figure of approximately $710 billion is guided: Amazon’s $200 billion, Microsoft’s explicit calendar-year guidance of $190 billion, Alphabet’s $180–190 billion range (midpoint $185 billion), and Meta’s $125–145 billion range (midpoint $135 billion), each as stated by company chief financial officers on the Q1 2026 earnings calls held April 29–30, 2026.
The ratio between the 24-month AI capex cohort and the combined three historical programs is approximately 3.1. Stated in annual run-rate terms, the comparison is more pronounced still: the Apollo Program peaked at approximately $31 billion per year in 2025 USD during fiscal year 1966; Big Tech’s combined 2026 guidance averages approximately $355 billion per year, a multiple of roughly 11.
The Four-Case Ranking
The table below ranks the four programs that form the core of this analysis by total cost in 2025 USD. The 2025–2026 AI capex cohort is highlighted.
| Program | Period | Cost (2025 USD) | Annual run-rate | Type |
|---|---|---|---|---|
| AI capex (4 hyperscalers) | 2025–2026 | $1,123B | $562B | Private (corporate) |
| Apollo Program | 1960–1973 | $189B | $14B (avg) / $31B (peak 1966) | Public (federal R&D) |
| Marshall Plan | 1948–1952 | $137B | $34B | Public (federal aid) |
| Manhattan Project | 1942–1946 | $36B | $9B | Public (federal R&D) |
Sources: Company 10-Q and 10-K filings; earnings call transcripts (Microsoft, Amazon, Alphabet, Meta, January–April 2026); Planetary Society reconstruction of Apollo cost (2022); Wikipedia Marshall Plan article (2025 update); Brookings Atomic Audit (1998) and US Department of Energy historical data; Bureau of Labor Statistics CPI (1913–2025). Eco3min calculation. Annual run-rate for AI capex computed as 24-month total divided by 2.
1. Each was a concentrated mobilization of capital toward a single objective
The four programs share, at the level of structural type, the property of concentrated rather than dispersed capital deployment. The Manhattan Project channeled approximately $9 billion per year (2025 USD) into a single technological objective; the Marshall Plan channeled $34 billion per year into European reconstruction; Apollo channeled $14 billion per year on average and $31 billion at its 1966 peak into the lunar landing capability and its prerequisites. The 2025–2026 hyperscaler capex cohort channels approximately $562 billion per year into AI infrastructure — the construction and equipment of large-scale data centers, the procurement of accelerator chips (primarily Nvidia GPUs and to a lesser extent custom silicon such as Google TPUs and AWS Trainium), and the supporting power, cooling, and networking infrastructure.
This concentrated-deployment property distinguishes all four cases from the routine background of US capital expenditure, in which annual investment is dispersed across thousands of firms and dozens of sectors with no single end. For the historical comparison to hold, the comparator set is restricted to programs of this type: the cluster does not include, for example, total US private fixed investment in any year (which is much larger but undirected), nor cumulative US federal infrastructure spending across multi-decade periods (which is also much larger but distributed across many separate programs and objectives).
2. AI capex is exceptional in scale and pace within the cluster
The 24-month AI capex figure is approximately three times the combined cost of the three historical programs in 2025 USD. Stated as an annualized rate, the gap is wider: the AI capex annual run-rate exceeds Apollo’s peak year by a factor of approximately 11, the Marshall Plan’s annual rate by approximately 17, and the Manhattan Project’s annual rate by approximately 60. Even using NASA’s aerospace-specific New Start Index for Apollo, which raises Apollo’s total to approximately $309 billion in 2025 USD, the AI capex cohort remains approximately twice the combined three historical programs.
Within the broader history of US mega-investments, the only programs of comparable absolute scale are the Interstate Highway System (cumulative federal outlay of approximately $580 billion in 2025 USD spread across 35 years of construction) and the 1996–2000 telecom and fiber-optic buildout (estimated at approximately $500 billion in 2025 USD over five years, drawing on Sparkline Capital and Goldman Sachs research). Both of those are documented in the section that follows. Wartime military mobilization, particularly during the Second World War, exceeded the AI capex cohort by an order of magnitude, but is excluded from this comparison on the conventional ground that war spending is not a directed investment in productive capital and is not subject to the capital-cycle dynamics that govern peacetime mega-buildouts.
3. The 2025–2026 cohort differs from the public programs in three respects
Three differences from the historical cluster are worth stating plainly. First, the AI capex cohort is privately funded by four publicly traded corporations subject to quarterly disclosure and equity-market discipline; the historical programs were publicly funded by federal appropriation under congressional oversight. Second, the AI capex cohort is undertaken in pursuit of commercial returns; the historical programs were undertaken in pursuit of national-security, geopolitical, or scientific objectives, with commercial spillovers as secondary outcomes. Third, the AI capex cohort is partially debt-financed: Bank of America’s 2026 estimate places hyperscaler debt issuance at approximately $175 billion in 2026 alone, more than six times the $28 billion annual average of the prior five years. The historical programs were funded almost entirely from current government appropriations. A related secular equity-valuation lens is The long-run S&P 500-to-gold ratio.
These differences are structurally important. A program funded from current government appropriations and pursued for non-commercial objectives is not subject to the same evaluation criteria as a program funded by corporate cash flow plus debt and pursued for commercial return. The historical comparison is therefore, by construction, a comparison of scale and concentration rather than a comparison of funding model or expected return. For the question of how the AI capex cohort might unfold from here, the more directly comparable historical case is the late-1990s telecom buildout, which is examined next.
What Happened Next, In Each Case
The post-program trajectories of the four cases differ along the dimension of who bore the financial outcome. For the three historical programs, the outcome was a delivered public capability — nuclear weapons and a weapons complex; reconstructed European economies and trans-Atlantic political alignment; the lunar landing capability and the spinoff industries it seeded — with no equity-return question for private holders. For the 2025–2026 AI capex cohort, the outcome will be measured in part by the future earnings and equity returns of the four hyperscalers that have funded it. The closest historical case at comparable private-sector scale is the late-1990s telecom and fiber-optic buildout. The table below summarizes both sets of outcomes.
| Program | Capability outcome | Equity-return outcome for builders |
|---|---|---|
| Manhattan Project | Two operational weapons; nuclear weapons complex | N/A — public program |
| Marshall Plan | European economies surpassed pre-war GDP by 1952; political alignment held | N/A — public program |
| Apollo Program | Six successful lunar landings; aerospace and computing spillovers | N/A — public program |
| Telecom buildout (1996–2000) | Approximately 4,000 to 1 over-capacity in long-haul fiber; consumer broadband foundation | Telecom equity index declined ≈92% from 2000 peak; index has not recovered to pre-2000 peak as of 2026 |
| AI capex (2025–2026) | Open | Open |
Sources: US Department of Energy (Manhattan); DeLong & Eichengreen (1993) on Marshall Plan outcomes; Planetary Society on Apollo capability; Sparkline Capital “Surviving the AI Capex Boom” (October 2025) on telecom-index post-2000 returns; Investopedia historical data on telecom carrier bankruptcies.
The telecom case warrants direct documentation because of its structural similarity to the AI capex cohort along several dimensions. US telecom carriers approximately tripled capital expenditure between 1996 and 2000, partly funded by debt issuance and partly by equity raised on the conviction that internet traffic was doubling every 100 days — a figure attributed to WorldCom that, in retrospect, was approximately an order of magnitude too aggressive. The buildout produced an estimated 4,000-fold over-capacity in long-haul fiber capacity, much of which was unlit (“dark fiber”) for years. Following the 2000–2002 bust, several of the largest builders — Global Crossing, WorldCom, Nortel — entered bankruptcy or near-bankruptcy proceedings, while the broader telecom equity index declined by approximately 92% from peak and has not recovered the 2000 high as of 2026. The underlying technology was, however, fully validated: the fiber laid between 1996 and 2000 became the backbone of the global internet over the subsequent two decades, and is one of the foundational substrates on which the current AI capex cycle itself depends.
The structural similarities between the 1996–2000 telecom buildout and the 2025–2026 AI capex cohort are documented in the next section. The structural differences — most importantly, the existing operating cash flow of the hyperscalers, which the late-1990s telecom builders generally lacked — are also documented there. No projection of the AI capex cohort’s eventual equity-return outcome is supportable from a single historical analogue.
Three Observations Across the Cases
Without inferring causation, three statistical features are common across the cluster.
First, each case coincided with an explicit national or corporate strategic priority. The Manhattan Project followed the Einstein-Szilard letter and the perceived risk of a German nuclear weapon. The Marshall Plan followed the perceived risk of Soviet political expansion across war-damaged Western Europe. Apollo followed Sputnik and the political commitment to a lunar landing within the decade. The 2025–2026 AI capex cohort follows the late-2022 release of ChatGPT and the resulting commercial conviction among the four hyperscalers that compute capacity is the binding constraint on AI revenue capture. In each case, the deployment was not an emergent feature of routine capital allocation but a directed response to a specific strategic frame.
Second, in each case the capacity delivered exceeded the immediate demand. The Manhattan Project produced more enriched uranium and plutonium than was used in the operational weapons. The Marshall Plan transferred dollar aid in excess of what European trading partners could absorb productively in the early years, with surpluses accumulating in counterpart funds for later use. Apollo developed capabilities — heavy-lift launch, life-support systems, computing miniaturization — that exceeded the immediate requirement of the lunar landing missions. The telecom buildout produced approximately 4,000-fold long-haul fiber over-capacity. For the 2025–2026 AI capex cohort, the corresponding question — whether AI revenue scales to absorb the capacity being built, or whether the cohort is producing a multi-year over-capacity comparable to the telecom case — cannot be settled from the data currently available. Hyperscaler executives have been explicit on Q1 2026 earnings calls that supply, not demand, is the binding constraint as of April 2026; whether that condition persists through 2027 and 2028 is the empirical test. On uranium as an AI-compute-driven commodity, see Eco3min’s uranium framework.
Third, the post-program trajectory has differed sharply between public and private cases. The three public programs ended on approximately their planned schedules with the underlying capability delivered to the public sector and integrated into subsequent civil and military activity. The one private-sector case at comparable scale (telecom 1996–2000) ended in a capital-cycle bust during which the equity of the firms that did the building underperformed materially even though the underlying technology proved transformative. The 2025–2026 AI capex cohort is, in this respect, more closely comparable to the telecom case than to any of the public programs — though the hyperscalers’ large existing operating cash flows, which the late-1990s telecom builders generally lacked, are a structural factor that may produce a different outcome.
Counter-Arguments and Limitations
The case for caution against over-reading the historical comparison is worth stating plainly. Four objections deserve serious consideration.
First, comparing public programs to private corporate capex is a comparison of unlike objects. Apollo, Marshall, and Manhattan were funded by federal appropriation, undertaken for non-commercial objectives, and accountable to Congress and the public. AI capex is funded by corporate cash flow plus debt, undertaken for commercial return, and accountable to public-market shareholders. The valuations public markets currently assign these firms sit in the top decile of the historical range — the subject of our analysis of today’s cyclically adjusted valuation. The shared feature — concentrated capital deployment for a single technological end — is genuine, but the institutional and incentive structures differ in ways that may matter materially for outcomes. The page therefore documents the comparison as one of scale, not of mechanism or expected return.
Second, the definition of “AI capex” is fuzzy. The figures used here are total reported capital expenditure for the four hyperscalers, including finance leases, as disclosed on earnings calls and in 10-K filings. Not all of this is dedicated to AI: a portion funds non-AI cloud infrastructure, fulfillment centers (in Amazon’s case), retail data centers, and other long-cycle assets. Per executive commentary on Q1 2026 earnings calls, the “vast majority” of incremental capex at Amazon is AI-related, with similar but less precise statements at the other three companies. The figure of $1.12 trillion is therefore an upper bound on AI-specific spending; a stricter AI-only filter would produce a smaller figure, possibly in the range of $850 billion to $1 trillion. This does not change the cluster placement materially but is documented for completeness. A closer look: AI as a systemic financial risk.
Third, the hyperscalers carry existing operating cash flow that the late-1990s telecom builders generally lacked. Amazon, Microsoft, Alphabet, and Meta together generated approximately $530 billion in operating cash flow during fiscal 2025; the late-1990s long-haul telecom carriers generally did not have profitable underlying businesses outside the buildout itself. This means the hyperscalers can fund a larger fraction of the capex from internal sources and remain solvent through a longer demand-development period than the telecom builders could. Bank of America’s projection of $175 billion in hyperscaler debt issuance in 2026 represents a step-change relative to recent history but remains a manageable fraction of total capex. The structural-similarity argument with the telecom buildout therefore applies to the demand-vs-capacity dimension but not to the balance-sheet-fragility dimension. That second dimension is measured quarter by quarter in operating cash flow minus capital expenditure for six large US tech firms since 2017.
Fourth, n = 4 is a small sample, and even the broader n = 8 (with telecom, Interstate, SDI, ISS) does not support formal probability statements about outcomes. The “AI capex is comparable to a small cluster of historic mega-investments” framing is descriptive, not predictive. With this number of observations, no quantitative claim about the AI capex cohort’s eventual equity-return outcome — favorable or unfavorable — is supportable. The historical record shows that mega-investments of comparable concentration have, in the past, ended in either delivered public capability (public cases) or capital-cycle busts that did not destroy the underlying technology (private cases). The 2025–2026 cohort may resemble either pattern or neither.
Common Misinterpretations
Reading the $1.12 trillion figure as actual cumulative spend. The 2025 component ($413 billion) is observed actual spending from Q4 2025 10-K filings. The 2026 component ($710 billion) is corporate guidance issued on the Q1 2026 earnings calls in late April 2026, not realized expenditure. Hyperscaler capex guidance has been revised upward at every quarterly earnings report in calendar year 2025 and Q1 2026; if that pattern continues the realized 2026 figure would be higher, but it could also be lower if any company moderates spending later in the year. The $1.12 trillion figure should be read as guided 24-month commitment, not as cumulative spend through April 2026.
Citing the 3.1× ratio as evidence that AI is “bigger than” Apollo, Marshall, or Manhattan. The ratio is bigger in dollar terms in 2025 USD, on a CPI inflation basis. It is not bigger in terms of share of US GDP at the time of the spending: Apollo’s 1966 peak consumed approximately 2.3% of federal outlays and 0.7% of GDP, while AI capex is approximately 2% of US GDP at its 2026 run-rate. The Manhattan Project at its 1944 peak consumed roughly 0.4% of GDP. A complete comparison would document the dollar ratio, the GDP-share ratio, and the federal-budget-share ratio (where applicable); each gives a different answer about “scale,” and the choice of metric is consequential.
Equating the telecom 1996–2000 precedent with a forecast of equity-return collapse for hyperscalers. The telecom case is the closest single private-sector analogue at comparable scale, and its equity-return outcome (approximately −92% from 2000 peak, never recovered) is a documented historical fact. It is not, however, a forecast. The hyperscalers’ existing cash flows, the diversification of their underlying businesses, and the concentration of the AI buildout among four firms with strong balance sheets are structural differences from the late-1990s telecom complex, which was a more fragmented and more debt-dependent industry. The historical record establishes that builder equity returns do not necessarily track the success of the underlying technology; it does not establish that the same outcome will recur. Whether it recurs will show up first in multiples and earnings revisions, the terrain of the equity market valuation sub-pillar on real rates, multiples and earnings dynamics.
Treating “private sector” as a homogeneous category. The 1880s US railroad buildout, the 1920s electric utility buildout, the 1996–2000 telecom buildout, the 2010–2014 US shale oil buildout, and the 2025–2026 AI capex cohort are all private-sector mega-investments, but their outcomes have varied considerably. The railroad buildout produced multiple panic episodes (1873, 1893) with hundreds of railroad bankruptcies, but ultimately profitable consolidation by the early 20th century. The 1920s electric utility buildout produced a period of profitable expansion followed by Depression-era restructuring. The shale oil buildout produced approximately three years of negative free cash flow followed by industry consolidation and, by 2018–2019, a return to capital discipline. The pattern is “capacity exceeds demand, builders restructure or consolidate, technology is integrated into the mature economy” — but the path through that pattern has differed in length and severity across cases.
Methodology and Sources
Primary metric: Total capital expenditure in 2025 USD over the program lifetime. For ongoing programs, the figure is the announced or guided commitment for a defined period.
AI capex computation. The 2025 figure is the sum of calendar-year capital expenditure (including finance leases, the standard hyperscaler reporting definition) for Amazon ($131.8B), Microsoft ($117.9B as the sum of calendar quarters), Alphabet ($91.4B), and Meta ($72.2B), totaling $413.3 billion. Microsoft figures are reconstructed from fiscal-year 10-Q filings to align with calendar-year boundaries; the four calendar quarters used are FY25 Q3 ($21.4B), FY25 Q4 ($24.2B), FY26 Q1 ($34.9B), and FY26 Q2 ($37.5B). The 2026 figure is the sum of company guidance midpoints as stated on Q1 2026 earnings calls (April 29–30, 2026): Amazon $200B, Microsoft $190B (explicit calendar-year figure per CFO Amy Hood), Alphabet $185B (midpoint of $180–190B range), and Meta $135B (midpoint of $125–145B range), totaling $710 billion.
Historical program costs. Manhattan Project: $1.89 billion in then-current dollars (1942–1946), per the US Department of Energy and the Brookings Atomic Audit (Schwartz, 1998), inflated to $36 billion in 2025 USD using the BLS CPI from 1944 (the year of peak expenditure). Marshall Plan: $13.3 billion in then-current dollars (1948–1952), per the European Recovery Program records and the Wikipedia Marshall Plan article (2025 update, citing State Department final reports), inflated to $137 billion in 2025 USD using the BLS CPI from 1950. Apollo Program: $25.4 billion in then-current dollars (1960–1973), per NASA’s congressional testimony of 1973 and the Planetary Society reconstruction (Dreier, 2019, 2022), inflated to $189 billion in 2025 USD using the BLS CPI from a 1965 base year.
Inflation methodology. All historical figures are converted to 2025 USD using the Bureau of Labor Statistics Consumer Price Index for All Urban Consumers (CPI-U). This is the most-used cross-program comparator in journalistic and reference work, including by the Congressional Budget Office and the Congressional Research Service. NASA’s New Start Index, an aerospace-specific deflator that better reflects R&D and aerospace cost growth, would raise the Apollo figure to approximately $309 billion in 2025 USD; this would lower the AI-to-historical ratio from 3.1× to approximately 1.7×, and is documented in the FAQ. CPI is used here for methodological consistency across all three historical programs.
What is not adjusted. Figures are nominal dollar amounts (then-current dollars inflated by CPI), not GDP-share equivalents. A GDP-share comparison would change the ranking and is not used here because the underlying mechanism of interest — concentrated capital deployment — is more directly captured by absolute dollars than by share of contemporary GDP. GDP-share figures are documented in the FAQ for completeness.
What is excluded. Wartime military spending (WWI, WWII, Korea, Vietnam, post-2001 Iraq/Afghanistan) is excluded from the comparison set, on the conventional ground that war spending is not directed investment in productive capital subject to capital-cycle dynamics. Routine federal infrastructure spending (highway maintenance, military procurement, Medicare and Medicaid expenditure) is excluded as not constituting a defined mega-program. The Inflation Reduction Act and CHIPS Act are excluded as their realized spending profiles remain partial and their final cost is not yet defined.
Limitations. (1) The “AI capex” definition is broader than AI-specific infrastructure: it includes non-AI cloud infrastructure, traditional data centers, and fulfillment centers (Amazon). A stricter AI-only filter would produce a figure approximately 15–25% smaller. (2) Hyperscaler 2026 capex is corporate guidance, not realized expenditure, and is subject to upward or downward revision through the year. (3) Inflation conversion across long periods is inherently imprecise; alternative deflators produce different rankings. (4) The cluster of “comparable mega-investments” is necessarily judgment-laden; reasonable analysts could include or exclude additional cases (Interstate Highway, SDI, ISS, telecom 1996–2000) and produce a slightly different distribution.
Reproducibility. The full dataset, including company-level capex by year, source filing identifier per figure, and the specific BLS CPI series used for each historical inflation conversion, is available below as CSV and XLSX. The chart is generated with Python (pandas, matplotlib).
Academic and primary references:
- Goldman Sachs Research (December 2025). “Why AI Companies May Invest More Than $500 Billion in 2026.”
- Sparkline Capital (October 2025). “Surviving the AI Capex Boom.” Research note documenting historical capital-cycle precedents.
- Schwartz, S. (ed.) (1998). Atomic Audit: The Costs and Consequences of U.S. Nuclear Weapons Since 1940. Brookings Institution Press.
- Dreier, C. (2019, updated 2022). “Reconstructing the Cost of the One Giant Leap.” The Planetary Society.
- DeLong, J. B. and Eichengreen, B. (1993). “The Marshall Plan: History’s Most Successful Structural Adjustment Program.” NBER Working Paper.
- Federal Reserve Bank of St. Louis (FRED). Series CPIAUCSL (BLS Consumer Price Index for All Urban Consumers). Data retrieved April 2026.
- Company filings: Amazon 10-K (FY2025, filed February 2026), Microsoft 10-Q FY26 Q1–Q3 and 10-K FY25, Alphabet 10-K (FY2025), Meta 10-K (FY2025). All retrieved from SEC EDGAR April 2026.
Underlying capex/revenue tracker. The quarterly capex-to-revenue ratios for the four hyperscalers (plus Apple and NVIDIA for context) are tracked in real time on the companion dataset Big Tech CapEx as % of Revenue — Quarterly Dataset (2015–2026), extracted directly from SEC EDGAR 10-K and 10-Q filings via the XBRL API. The dataset is updated each earnings season and provides the underlying quarterly inputs to the 2025 actual figures cited in this study.
Frequently Asked Questions
Why these four programs specifically?
The Manhattan Project, Marshall Plan, and Apollo Program are the three civilian US mega-investments most-cited in journalistic and reference work as benchmarks of national-priority resource mobilization. The selection is therefore based on cultural prominence rather than on a formal threshold (such as “all programs costing more than $30 billion in 2025 USD”). A formal-threshold approach would add the Interstate Highway System, the Strategic Defense Initiative, the International Space Station program, the 1996–2000 telecom buildout, and possibly the 2010–2014 US shale buildout. The AI capex figure remains the largest in any of these constructions, and the broad framing — “AI capex is in a small cluster of historic mega-investments” — is robust to the choice of comparator set. The narrower three-program ratio (3.1×) is specific to the Manhattan + Marshall + Apollo combination.
Is AI capex really $1.12 trillion?
The $1.12 trillion figure is the sum of 2025 actual capex ($413 billion, sourced from Q4 2025 10-K filings) and 2026 guided capex ($710 billion, sourced from CFO statements on Q1 2026 earnings calls, April 29–30, 2026). Of this, the 2025 component is realized; the 2026 component is corporate guidance subject to revision. Bank of America’s analyst consensus places the 2026 figure between $675 billion and $735 billion; Goldman Sachs places it at $700 billion; Wall Street consensus moved from approximately $527 billion in November 2025 to approximately $710 billion by late April 2026. Neither analyst extrapolation nor the conservative low end of company guidance materially changes the cluster placement.
What about Oracle, the neoclouds, and other AI infrastructure investors?
The four-hyperscaler scope is conservative. Adding Oracle (which guided to capex of approximately $35 billion in 2025 and significantly higher in 2026), the neocloud category (CoreWeave, Nebius, IREN, Lambda, Crusoe, with combined 2026 capex commitments in the range of $50–80 billion), and the third-party data-center developers building for hyperscaler tenants (such as the Meta Louisiana joint venture) would add approximately $150–200 billion to the 24-month total. The narrower four-hyperscaler scope is used because the four companies’ figures are individually disclosed, dollar-precise, and free of double-counting; the broader scope introduces additional counts at the cost of some attribution ambiguity.
Why use CPI inflation rather than the NASA New Start Index for Apollo?
CPI is the standard cross-program inflation measure used in journalistic, congressional, and academic comparison work. NASA’s New Start Index, designed specifically for aerospace cost adjustment, would raise Apollo’s 2025 USD figure to approximately $309 billion, lowering the AI-to-historical ratio from 3.1× to approximately 1.7×. The aerospace-specific index is more accurate for Apollo-internal cost comparisons but is not appropriate for cross-program comparison, since no equivalent program-specific deflator exists for the Marshall Plan, the Manhattan Project, or AI capex. CPI is used for methodological consistency.
Does the telecom 1996–2000 precedent imply that hyperscaler equity will collapse?
No. The telecom case is the closest single private-sector analogue at comparable scale, and its equity-return outcome (approximately −92% from 2000 peak, never recovered to the 2000 high as of 2026) is a documented historical fact. It is not a forecast for the AI capex cohort. Two structural differences argue for caution against direct extrapolation. First, the late-1990s long-haul telecom carriers generally did not have profitable underlying businesses outside the buildout, whereas the four hyperscalers carry approximately $530 billion in combined annual operating cash flow from cloud, advertising, and e-commerce activities that pre-date and do not depend on AI revenue. Second, the AI buildout is concentrated among four firms with strong balance sheets, whereas the telecom buildout was distributed across a more fragmented industry with greater debt dependence. The historical precedent establishes that builder equity returns do not necessarily track the success of the underlying technology; it does not establish that the same equity-return outcome will recur.
The AI capex cohort is approximately 1.6% of 2025 US GDP and approximately 2.2% of 2026 US GDP at the projected run-rate. The Apollo Program at its 1966 peak was approximately 0.7% of contemporaneous GDP. The Marshall Plan’s annual flow was approximately 1.1% of contemporaneous US GDP. The Manhattan Project at its 1944 peak was approximately 0.4% of contemporaneous GDP. By GDP-share metric, AI capex therefore exceeds each individual historical program but is dwarfed by wartime totals (WWII military spending peaked at approximately 37.8% of 1944 GDP) and by the 1880s railroad buildout (peaked at approximately 6% of contemporaneous US GDP). The choice of metric — absolute dollars vs share of GDP — produces materially different framings, and both are documented in the downloadable dataset.
Could the 2026 capex guidance be revised downward?
Yes. The page documents guided 2026 capex as of the Q1 2026 earnings calls (April 29–30, 2026). Hyperscaler capex guidance has been revised upward at every quarterly reporting since at least Q1 2025, and supply-chain bottlenecks (memory chips, advanced packaging capacity) rather than demand are the binding constraint as of April 2026. A demand shock or a sustained reassessment of AI revenue trajectories could prompt downward revision; if such revision occurs, the page’s figures will be updated and the cluster placement reassessed. The broader framing — “AI capex is in a small cluster of historic mega-investments” — would be robust to a 20% downward revision but not necessarily to a 50% downward revision.
Why is wartime spending excluded?
Wartime military spending is the only historical category in which US capital deployment exceeds the AI capex cohort by a wide margin (WWII military expenditure totaled approximately $4.2 trillion in 2025 USD over four years, more than three times the AI capex cohort). It is excluded from the comparison set on the conventional ground that war spending is not directed investment in productive civilian capital subject to capital-cycle dynamics. Including wartime totals would change the cluster placement substantially but would not be meaningfully comparable to the question of how a peacetime corporate capex cohort might evolve.
Download the Complete Dataset
Full data on 24-month AI capex by hyperscaler, historical mega-investment costs in 2025 USD, GDP-share comparisons, and source filing identifiers per figure.
Download CSV Download XLSX
Source: eco3min.fr — Company 10-Qs and earnings calls, Planetary Society, Wikipedia, BLS CPI. Free to use with attribution.
Conclusion
The 2025–2026 capital expenditure cohort of the four largest US technology companies is approximately $1.12 trillion in 2025 USD, dedicated overwhelmingly to AI infrastructure. This figure exceeds the combined inflation-adjusted cost of the Apollo Program, the Marshall Plan, and the Manhattan Project — three of the most-cited civilian US mega-investments of the 20th century — by a factor of approximately 3.1. By annual run-rate, the gap is wider: AI capex in 2026 averages approximately 11 times Apollo’s 1966 peak year in 2025 USD.
The structural framing supported by the data is narrower than headline commentary has often suggested: the AI capex cohort belongs to a small, identifiable cluster of resource-mobilization episodes, distinct from the routine pattern of US corporate capital expenditure cycles. Within that cluster, the closest private-sector analogue at comparable scale — the 1996–2000 US telecom buildout — produced a documented post-buildout equity-return outcome in which the firms that did the building underperformed by approximately 92% from peak even as the underlying technology proved transformative. The hyperscalers’ existing operating cash flows and balance-sheet strength are structural differences from the late-1990s telecom complex that argue against direct extrapolation, but they do not eliminate the historical pattern of capacity exceeding immediate demand during concentrated mega-buildouts.
This page does not constitute a forecast of the AI capex cohort’s eventual outcome — favorable or unfavorable. It is an empirical placement of the 2025–2026 cohort within the historical distribution of US mega-investments, and a documentation of the structural features that the closest private-sector analogue exhibited. The dataset and methodology are designed to be updated quarterly as new earnings reports arrive.
The data and analysis presented on this page are provided for informational and educational purposes only. They do not constitute investment advice or a recommendation to take any specific action. Eco3min is a non-prescriptive financial information publisher and is not registered with the AMF.
Last updated — 23 September 2026
Disclaimer – Financial Information: The analyses, commentary, and content published on eco3min.fr are provided for informational and educational purposes only. They do not constitute investment advice or a solicitation to buy or sell financial instruments. Past performance is not indicative of future results. All investment decisions involve risk and are the sole responsibility of the reader.