
Active vs passive investing: what the evidence documents
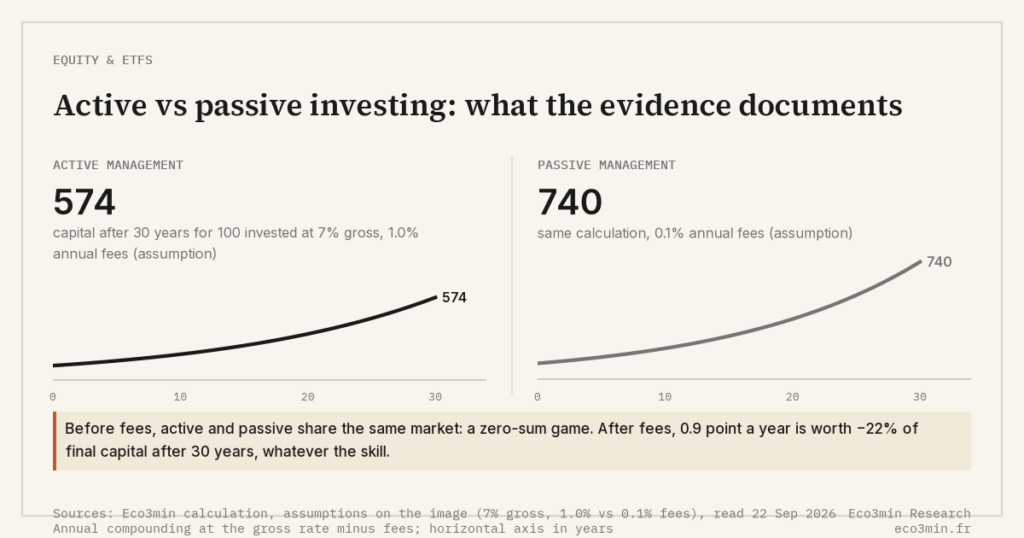
Active management selects and weights securities to beat a benchmark; passive management replicates an index at minimal cost. The decisive difference is not talent but arithmetic: before fees the two are a zero-sum contest against the market, so after fees the average active dollar must trail the average passive dollar. SPIVA data illustrates the outcome — 89.5% of US large-cap active funds underperformed the S&P 500 over the 15 years to December 2024.
In this comparison
Why this comparison matters
The active-versus-passive debate is usually framed as skill against indexing, which misses where the difference actually lives. The intuitive question is whether a manager can beat the market; the harder question is whether one can be identified in advance, and whether the cost of trying is justified by the odds. In 2024, total US passive fund and ETF assets surpassed active assets for the first time, a milestone that reflects two decades of accumulated evidence rather than a passing fashion. This page sets out how the two approaches differ by the data, not which one a reader ought to pick. A broader view: the anatomy of an ETF choice.
What active investing is
Active management attempts to outperform a benchmark by choosing which securities to hold and how to weight them, deviating deliberately from the index. The degree of that deviation is measured by active share: a fund holding the same names in the same proportions as its index has near-zero active share, while a genuine stock-picker has high active share. Many nominally active funds turn out to be closet indexers, charging active fees for near-index exposure. Active managers are paid for the conviction in those deviations, not for tracking the market.
→ Detailed explanation: Why active share metrics matter for active managers
What passive investing is
Passive management replicates a rules-based index rather than selecting securities, aiming to match the market return at the lowest possible cost. Index equity funds account for roughly 57% of US-centric equity fund assets as of late 2024, and the asset-weighted average expense ratio across US equity funds fell to about 0.40% in 2024 from 0.99% in 2000, according to ICI data, with broad index funds sitting at the bottom of that range. The label is slightly misleading: market-cap weighting is itself a choice that tilts toward whatever has already risen.
→ In-depth explanation: Do passive ETFs make markets more fragile?
The key differences
Mechanism. Active funds deviate from the benchmark and stand or fall on those bets; passive funds replicate it and accept the market return by construction. Active share quantifies how much a manager actually departs from the index, separating genuine selection from expensive index-hugging.
Cost and the arithmetic. This is where the real difference sits. William Sharpe set it out in 1991: before costs, active management is close to a zero-sum game, because every position someone overweights another underweights. After costs, the average actively managed dollar must therefore trail the average passively managed dollar by roughly the fee gap. A fund charging 80 basis points more than an index fund must beat it by that margin every year merely to break even, and the hurdle compounds. Smart beta sits between the two, applying systematic rules at lower cost than discretionary selection.
Behavior across the cycle. Success rates move year to year — Morningstar found 42% of active funds beat their passive peers in 2024 and 38% in 2025 — but the long-run picture is steadier: only about 7% of active US large-cap funds survived and beat their average passive peer over the decade to December 2024. Index concentration shapes the gap: when a handful of stocks dominate index returns, a manager not overweight those names tends to lag the cap-weighted benchmark.
How they behave across regimes
The relative opportunity for active management depends on cross-sectional dispersion, breadth, and how far managers actually deviate. In the mega-cap-concentrated, narrow market of 2024, the cap-weighted S&P 500 was hard to beat: a manager underweight the dominant names lagged, and 65% of large-cap active funds underperformed over the year. Active US small-cap funds, by contrast, had their best year on record, with only about 30% underperforming — but SPIVA attributed that to a style bias toward larger caps after a 16-point large-over-small return spread, not to stock-picking skill. Active bond and credit managers fared relatively well in 2023 and 2024 as spreads tightened and they took more credit risk than market-weighted passive peers. Across regimes, dispersion and concentration mostly determine how wide the gap is; the cost-driven drag identified by Sharpe persists regardless of the cycle. Related framing: our overview of how real rates, multiples and earnings shape equity valuation.
The active-passive gap is not a verdict on talent; it is the arithmetic of costs applied to a zero-sum game.
→ Framework: Asset allocation strategies across market regimes
The common confusion
Two readings of the same data both miss the point. One treats SPIVA as proof that active management is pointless everywhere; yet the evidence is uneven across categories, and active credit and small-cap have had stretches of majority outperformance. The other treats a fund’s past outperformance as a signal worth chasing. Morningstar persistence data documents that winners rarely repeat, and that cheaper funds outperformed pricier ones far more often — a 28% success rate in the cheapest quintile against 17% in the priciest over the decade to 2024. The recurring error is mistaking realized outperformance for a forward-looking edge.
Practical observation
What the data suggests for framing your own analysis:
- Question to ask yourself: for a given fund, is the active share high enough to justify the fee, or is it tracking the index closely while charging to deviate?
- Data to monitor: expense ratio versus the comparable index fund, active share, and the level of cross-sectional dispersion and index concentration.
- Historical parallel: over the 15 years to December 2024, 89.5% of US large-cap active funds underperformed the S&P 500 (SPIVA).
- What the literature documents: Sharpe (1991) on the arithmetic of active management; the SPIVA Persistence Scorecard on the scarcity of repeat winners.
This is descriptive information to help you frame your own analysis. Eco3min does not provide investment advice.
Go deeper
📊 Related framework: Equity markets and ETFs: structure, valuations, cycles
📄 Adjacent question: How does factor investing differ from stock picking?
Related guides
Frequently asked questions
How is active investing different from passive investing?
Active management selects and weights securities to deviate from a benchmark, aiming to beat it; passive management replicates a rules-based index and accepts the market return at minimal cost. Active share measures how far a manager actually departs from the index, which is why two funds labelled active can behave very differently. The structural distinction is cost and intent: passive funds are built to match, active funds are paid to beat, and the data measures how often that intent is realised net of fees. All our macro-finance comparisons gather the related pages into one view.
Why does the average active fund underperform its benchmark after costs?
The reason is arithmetic rather than a comment on skill. Before fees, active management is close to a zero-sum game against the market, because every overweight position is someone else’s underweight. After fees, the average actively managed dollar must therefore trail the average passive dollar by roughly the cost gap, an identity William Sharpe set out in 1991. Some managers beat the market in any period, but the average cannot, and the fee hurdle compounds over time, which is why underperformance rates rise as horizons lengthen.
When do active managers tend to perform relatively better?
Historically, active managers fare better when cross-sectional dispersion is high, breadth is wide, and index returns are not dominated by a few mega-caps. In concentrated, narrow markets such as 2024, the cap-weighted index becomes hard to beat because a manager not overweight the leaders lags mechanically. Less efficient or less concentrated segments, such as small-cap or certain credit categories, have shown stretches of stronger relative performance, though style biases rather than pure selection often explain those results on closer inspection.
Last updated — 22 September 2026
Disclaimer – Financial Information: The analyses, commentary, and content published on eco3min.fr are provided for informational and educational purposes only. They do not constitute investment advice or a solicitation to buy or sell financial instruments. Past performance is not indicative of future results. All investment decisions involve risk and are the sole responsibility of the reader.
Read next
Full pillar →Strong dollar vs weak dollar: who wins and who loses
A strong dollar and a weak dollar are not signals of US economic health; they are conditions imposed…
2-year vs 10-year yield: reading the curve
The 2-year Treasury yield prices what markets expect the Fed to do over roughly two years; the 10-year…
TIPS vs nominal Treasuries: what breakevens reveal
Nominal Treasuries pay a fixed coupon; TIPS adjust their principal with realised CPI inflation. The real choice between…