The Eurozone Crisis (2010-2012): the shift into a dollar shortage
How, between 2010 and 2012, Europe’s sovereign-debt crisis became a global dollar shortage: reading the shift through Eco3min’s indicators.
The eurozone crisis is usually told as a European affair: Greece, austerity, the survival of the single currency. Read through the Eco3min engine, which measures only the US and global regime, its quantitative signature lies elsewhere. European banks, heavy dollar borrowers since before 2008, lose access to dollar funding; the broad dollar jumps while US domestic financial conditions barely move. It is this offshore dollar shortage — eased by the Fed’s swap lines, not by a European bailout — that this page retraces.
Between 2010 and 2012, the eurozone sovereign-debt crisis transmitted to the world through a dollar shortage: European banks lost access to dollar funding. The broad dollar jumped 9%, and the Fed’s swap lines eased the squeeze.
Timeline of the shift
From the first Greek bailout to “whatever it takes,” the crisis moves from sovereign risk toward bank funding in dollars.
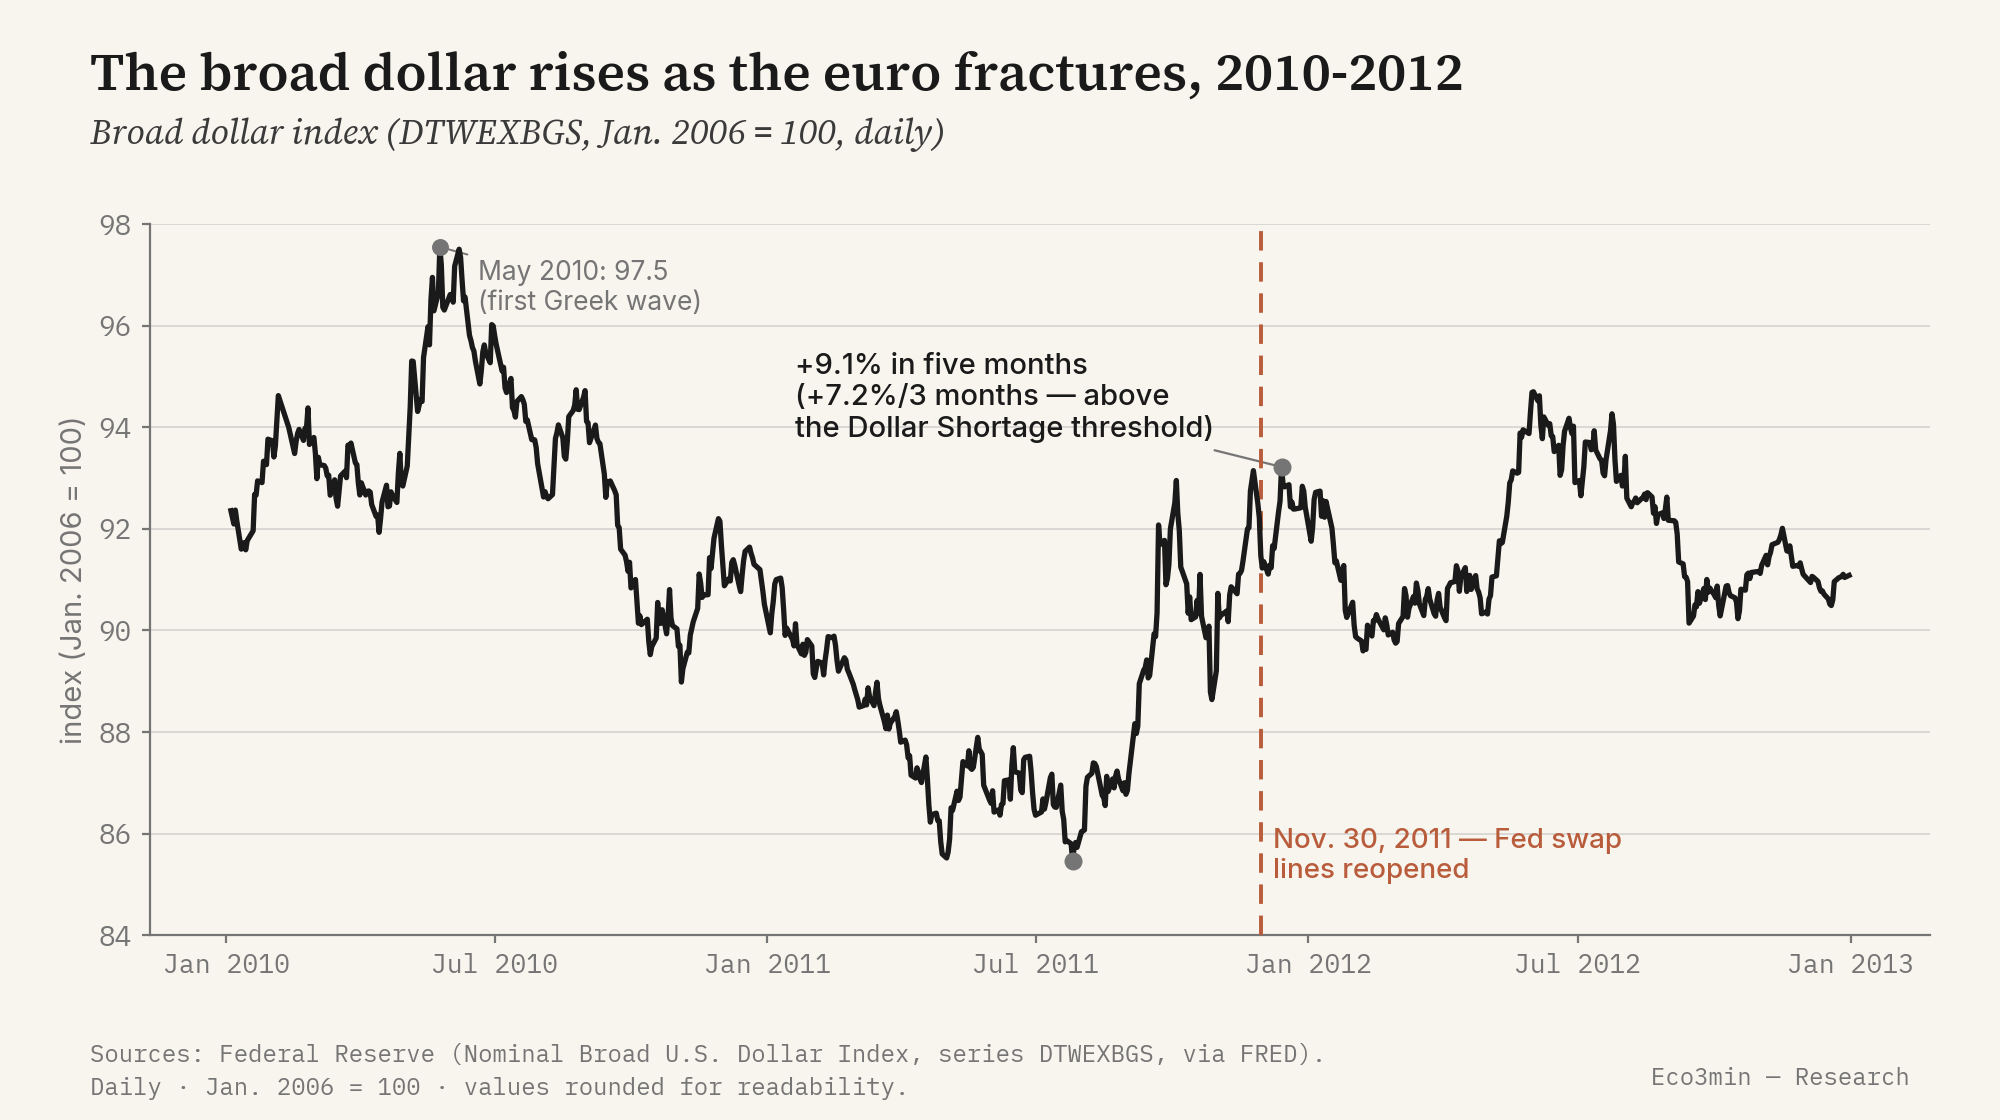
- May 2, 2010 — first Greek bailout (€110bn, EU-IMF); the EFSF is created. The broad dollar hits a cycle high (97.5 on May 25).
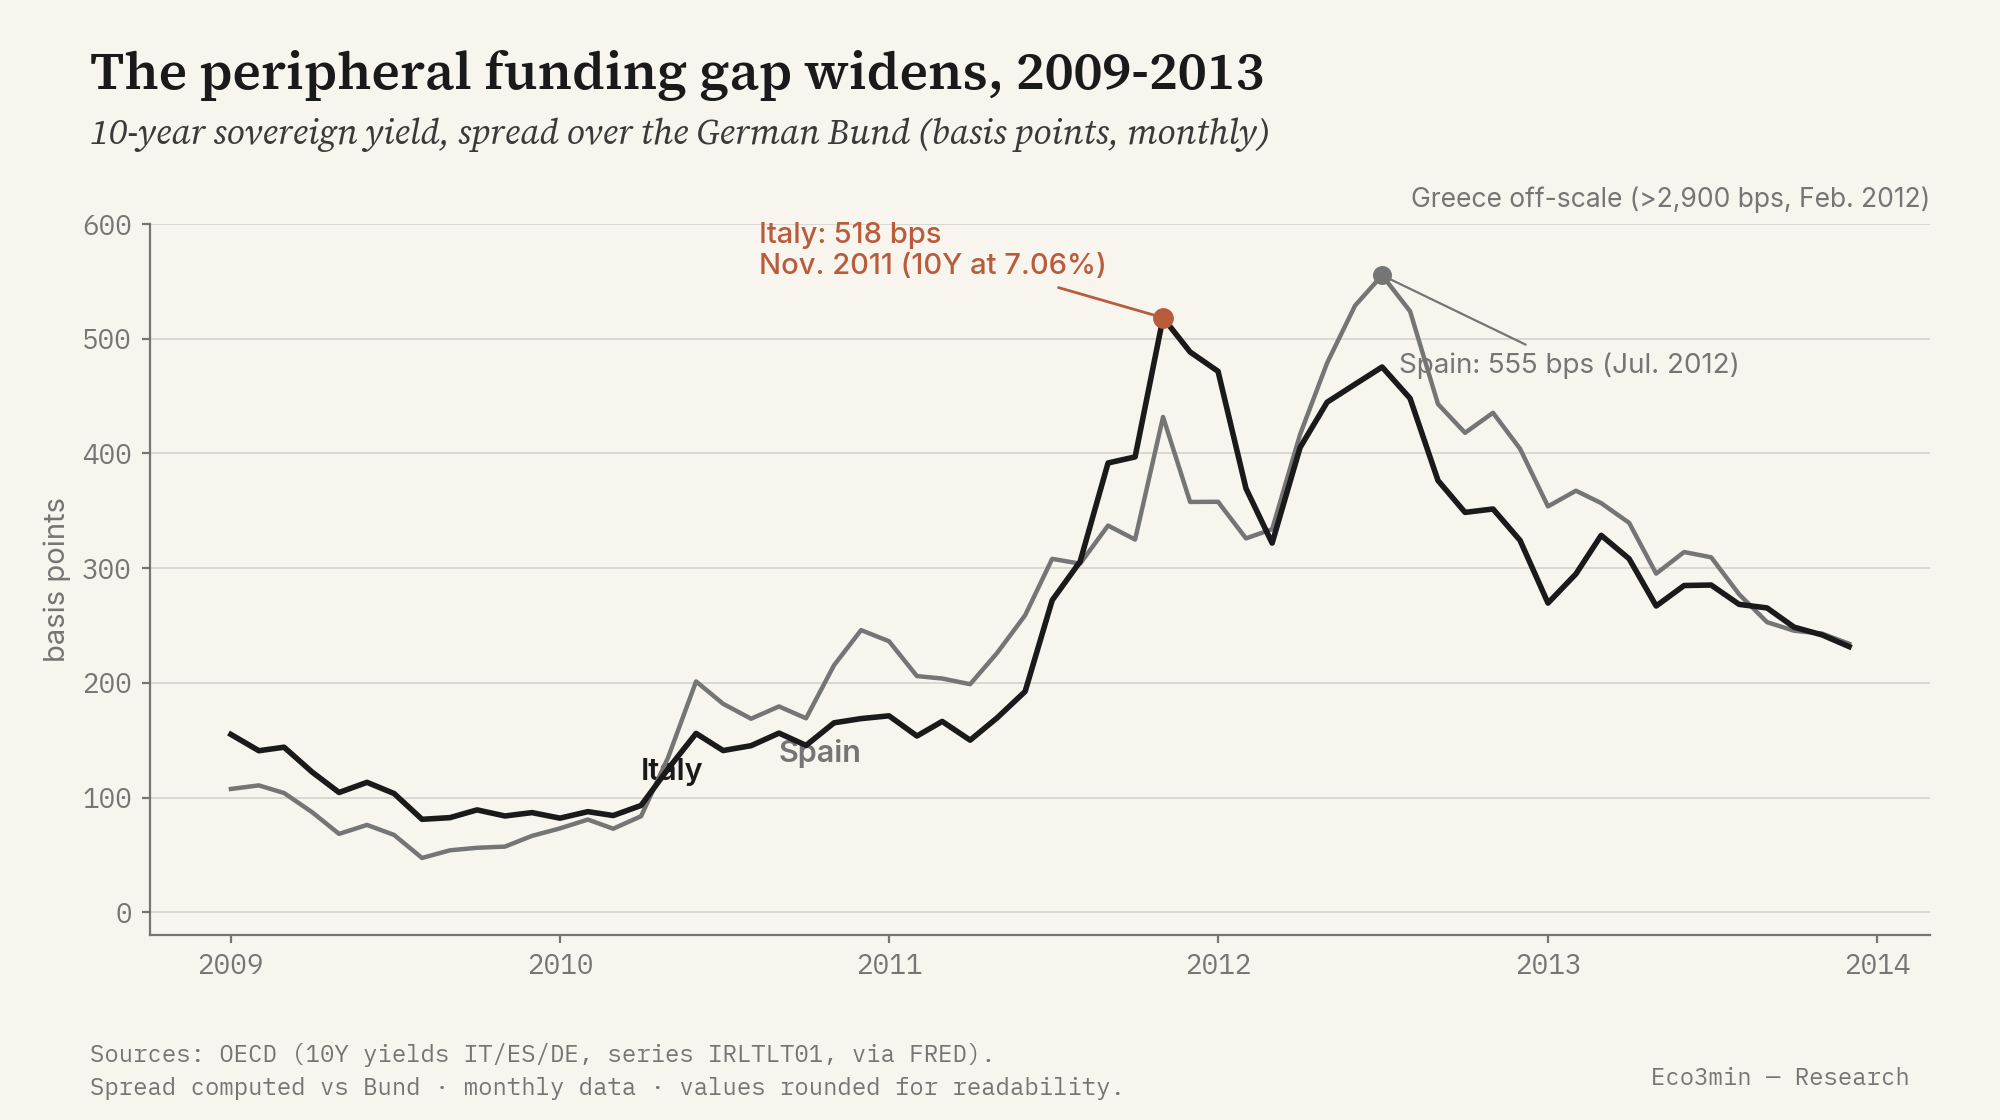
- Summer 2011 — contagion spreads to Italy and Spain, the eurozone’s third and fourth economies; 10-year yields surge.
- November 2011 — Italy’s 10-year exceeds 7% (monthly average 7.06%, or 518 basis points over the Bund); dollar funding for European banks tightens.
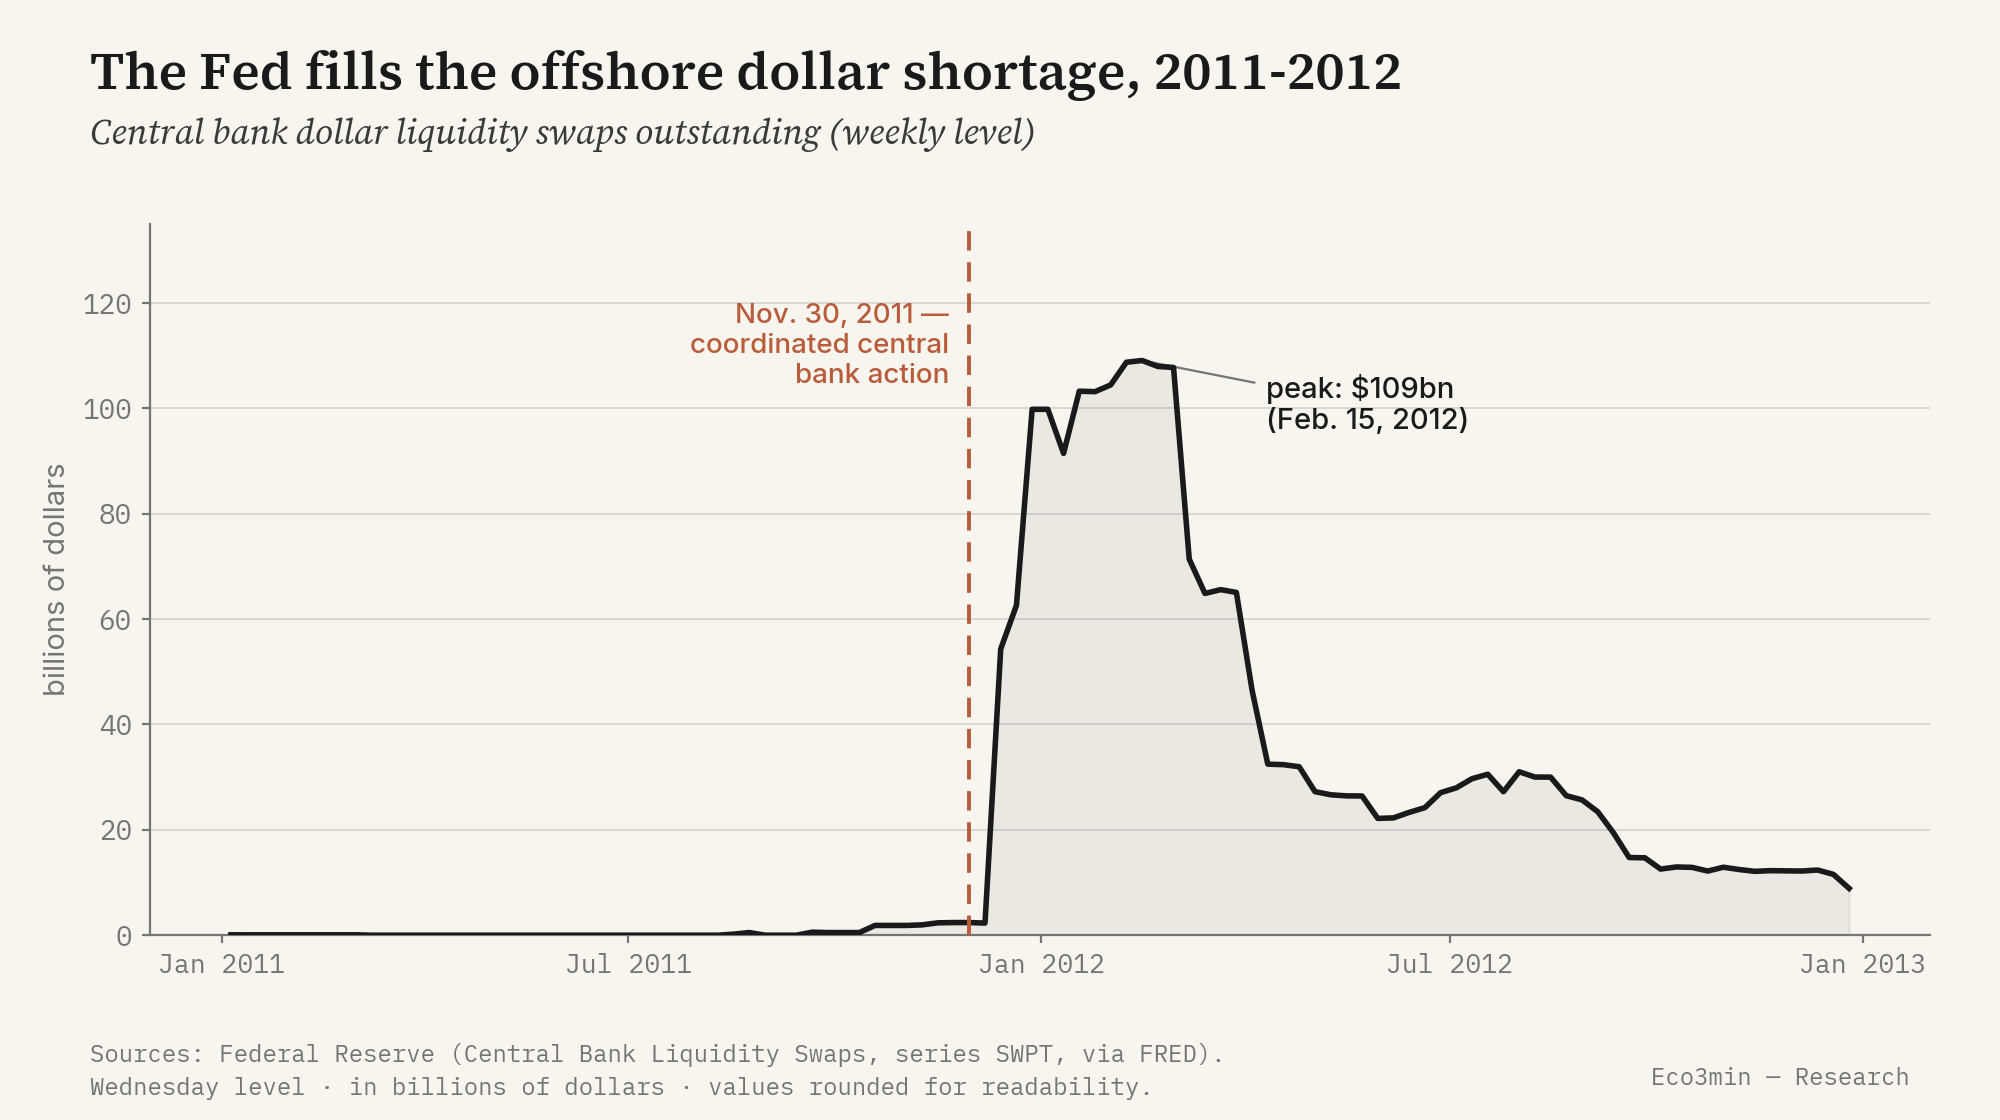
- November 30, 2011 — coordinated action by six central banks: the Fed reopens and lowers the cost of dollar swap lines to the ECB and its peers.
- December 21, 2011 — the ECB’s first three-year refinancing operation (LTRO): roughly €489bn allotted to more than 500 banks, followed by a second in February 2012.
- July 26, 2012 — Mario Draghi (ECB) says the institution will do “whatever it takes” to preserve the euro; the OMT programme is detailed in September.
- September 6, 2012 — the ECB details Outright Monetary Transactions (OMT); peripheral spreads begin a lasting decline.
The indicators before the crisis
Six months before the systemic peak of autumn 2011 (read here at May 2011), the gauges tell a story of divergence: peripheral sovereign risk is already rising, while the dollar and US financial conditions stay calm. The signal that had not yet fired was dollar funding.
170 basis points at T−6 (Italy 10Y at 4.76%, May 2011 — OECD). The gap widens in steps from 2010.
Sovereign yields226 basis points (Spain 10Y at 5.32%, May 2011 — OECD). At T−6, Spain looks more stressed than Italy; the order reverses in the autumn.
Sovereign yields86.9 on average in May 2011 (Federal Reserve) — close to its low. The dollar-shortage signal has not yet fired.
Broad dollar index−0.58 in May 2011 (Chicago Fed) — accommodative. The stress is not American: it sits on the balance sheets of European banks.
NFCIThe leading indicator of this crisis is neither a growth aggregate nor an inflation index: it is the funding gap between the peripheral sovereigns and Germany. Unlike a US domestic banking crisis — where the stress shows up in domestic financial conditions (NFCI) — the 2011 episode does not register there: it has to be found in the dollar and offshore funding. This is why a US-and-global engine still captures it: the strain surfaces in the broad dollar, which is part of the engine’s measured inputs, even though the defaulting borrowers sit in Europe. The sovereign spread rises in steps from the Greek trigger of 2010, spreads to Italy and Spain over the summer of 2011, and reaches systemic levels in the autumn. The chart below shows that progression — and the moment when Italy, too large to be rescued by the firewalls of the day, crosses the symbolic 7% threshold.
The regime shift
The transmission chain starts with sovereign risk and closes on the dollar. European banks hold peripheral sovereign debt in large amounts: when the solvency of those states is questioned, so is that of their banks. And those banks are structurally short of dollars — they fund dollar assets inherited from their pre-2008 expansion through short-term money markets and currency swaps. When US money-market funds withdraw from European bank paper in 2011, this channel freezes, the cost of obtaining dollars via the EUR/USD swap surges, and the broad dollar rises. The Fed then acts as a dollar lender of last resort beyond its own borders.
Read through the Eco3min engine, this crisis is not a shift in the US cyclical grid: over 2010-2012 the United States stays in soft growth with contained inflation, and that is not the subject of the page. The dominant narrative frames it first as a public-debt and austerity crisis; the Eco3min reading does not contest that, but moves the measured signature toward dollar funding. That signature is the layer-2 Dollar Shortage overlay. One of its three documented signals crossed its threshold: the broad dollar (DTWEXBGS) rose by +7.2% over three months in the second half of 2011, above the +5%/3-month threshold. This is a measured reading, verifiable on the series.
The concrete trigger of the freeze is documented. In the summer of 2011, US money-market funds sharply cut their exposure to European bank paper — their main source of short-term dollar funding. The mechanism is unforgiving: prime money funds finance long-dated dollar assets with overnight and short-dated paper, so a withdrawal does not shrink a balance sheet gradually — it removes the rollover that keeps it standing. Cut off from this channel, those banks turn to the currency swap to obtain dollars against euros, and the cost of that operation — the EUR/USD “basis” — widens markedly. It is the most direct thermometer of the shortage: a measure of offshore dollar liquidity that the general press rarely comments on.
The second signal, by contrast, did not fire — and that is precisely the point. US financial conditions (NFCI, Chicago Fed) peak at −0.04 in September 2011, far from the +0.30 threshold and nowhere near their +3.07 peak of November 2008. The dollar shortage was offshore: lodged in the funding of European banks, not transmitted to US domestic conditions — which the Fed’s swap lines specifically protected. The third signal, the high-yield spread, cannot be reconstructed before 2023 in the Eco3min series; it therefore plays no role here.
In the background sits a structural layer the engine does not compute: the sovereign-bank loop of a monetary union without a fiscal union. The solvency of states and that of their banks contaminate each other, and the ECB’s room for manoeuvre ends up constrained by sovereign risk. This is a reading of fiscal dominance — a long-run editorial framework, not a monthly measure.
The destination of this crisis is thus the Dollar Shortage overlay of the Eco3min Atlas, paired with the structural framework of fiscal dominance. This page describes the sequence of the shift; the Atlas pages describe the destination states.
The central bank response
The response played out across two currencies and two institutions. On the euro side, the ECB first raises its rate twice in 2011 (April and July, +25 basis points each, to 1.50%) to counter a headline inflation driven by energy, before cutting it in the autumn under Mario Draghi. Above all, it floods banks with euro liquidity through two three-year refinancing operations (LTRO) in December 2011 (≈€489bn) and February 2012 (≈€530bn), then lifts redenomination risk with the “whatever it takes” of July 2012 and OMT. These three-year, fixed-rate, cheap loans let banks carry peripheral sovereign debt without immediate refinancing strain — indirect support to states as much as to banks.
But the ECB cannot create dollars. It is the Fed that fills the shortage of US currency. The coordinated action of November 30, 2011 lowers the cost of the swap lines (to dollar OIS + 50 basis points) and reopens access: the ECB can then lend those dollars to its banks against collateral, as a substitute for the frozen private funding market. The footprint is measurable — drawings on these swaps go from about $2.4bn before the action to a peak of $109bn in February 2012. That the Fed intervenes without measurable domestic stress is no anomaly: since 2008 it has effectively assumed the role of dollar lender of last resort for the global financial system, of which European banks are a major link. The shortage was abroad; the printing press able to answer it was in Washington.
Assets and markets
The market that carries the crisis’s signature is FX. The broad dollar rises 9.1% between its trough of July 26, 2011 (85.5) and its peak of December 14 (93.2) — a distinct move, but lower in level than the May 2010 high (97.5), during the first Greek wave. Beneath the surface of FX, the cost of borrowing dollars against euros (the EUR/USD basis) reaches its most strained levels since 2008: this is the dollar shortage read directly off its price.
On the bond side, two opposite directions. Peripheral yields surge — Italy at 7.06% (November 2011), Spain at 6.80% (July 2012), Greece beyond 29% before the March 2012 restructuring, which imposes a haircut on the private sector. Conversely, the German Bund serves as a haven and falls to a low of 1.20%; US Treasuries benefit too, as the same flight to quality that punishes peripheral debt rewards the two deepest safe-asset markets. European bank stocks decline sharply over the period.
The trajectories and levels described here are retrospective, for the purpose of historical analysis. They constitute neither a projection nor an investment recommendation, and past performance does not predetermine future performance.
What was different this time
As in the Asian crisis of 1997 and the Russia-LTCM episode of 1998 — the Crisis Hub’s two other dollar shortages — we find here a flight to the dollar, a funding freeze in a banking system located outside the United States, contagion at the scale of a region, and an emergency liquidity intervention. The reading grid is the same: a layer-2 Dollar Shortage overlay, not a US cyclical shift.
Three structural factors nevertheless set the eurozone of 2011 apart from the crises of 1997-98.
- The target of the shock. In 1997-98, the shortage struck emerging economies through the collapse of their exchange-rate pegs and external debt. In 2011, it strikes the banks of a developed, reserve-currency bloc, through the currency-swap and wholesale dollar-funding market — an interbank market channel, not a balance-of-payments crisis.
- The lender of last resort. In 1997-98, the rescue came from the IMF, through country-by-country conditional programmes. In 2011, the dollar lender of last resort is the Fed itself, through a network of central-bank swap lines institutionalised after 2008 and reactivated in November. The $109bn of drawings measures its use.
- The fiscal dimension. The architectural flaw — a monetary union without a fiscal union — creates a sovereign-bank loop absent from 1997-98, which were crises of exchange rates and external debt, not of the design of a common currency.
What invalidated the analogy is measurable. Unlike 1997-98, resolved by devaluation and IMF programmes, the eurozone’s dollar stress resolved without a monetary break or devaluation — through the swap lines and then the ECB’s commitment (“whatever it takes,” OMT). The quantitative sign: the broad dollar peaked then receded as the swap cost normalised, and peripheral spreads collapsed from their 2012 peaks (518 bps for Italy, 555 bps for Spain) without any exit from the euro.
One qualification, to avoid over-reading: the layer-2 overlay (short-term, measured) and the fiscal-dominance framework (structural, editorial) describe two horizons. The swaps settled the funding shortage within weeks; the architecture of the sovereign-bank loop took years — the banking union, in particular — and belongs to the structural reading, not the measured signal.
The measured signature of the eurozone crisis was not European but monetary — an offshore dollar shortage, eased by the Fed’s swap lines, not by a rescue out of Europe.
Where this crisis leads
The crisis leads to a measured overlay and a structural framework. The crisis page adds the sequence of the shift; the Atlas pages describe the states themselves. The distinction in status matters: the Dollar Shortage overlay is a measurement — the dollar signal crossed a documented threshold — whereas fiscal dominance is a structural reading framework, not a monthly computation. Eco3min does not present one as the other.
The layer-2 overlay describes the state where demand for dollars as a funding and haven currency overwhelms supply. Three measured signals: broad dollar, financial conditions, high-yield spread. Here, the dollar signal fired.
Atlas — Dollar ShortageLayer 3 describes a regime where the sustainability of public debt constrains monetary policy. A long-run reading framework — not computed monthly by the engine.
Atlas — fiscal dominanceSources
- Central bank communications: Federal Reserve (coordinated action of November 30, 2011, dollar swap lines); ECB (three-year LTRO, December 2011 and February 2012; speech of July 26, 2012; OMT programme, September 2012); EU and IMF (Greek bailouts, EFSF, 2010).
- Institutional work on the dollar funding of European banks (Bank for International Settlements).
- Eco3min data: broad dollar index (DTWEXBGS), financial conditions (NFCI, Chicago Fed), dollar liquidity swaps (SWPT, Federal Reserve), 10-year sovereign yields (OECD: Italy, Spain, Germany, Greece).
Last updated — 31 May 2026
Disclaimer – Financial Information: The analyses, commentary, and content published on eco3min.fr are provided for informational and educational purposes only. They do not constitute investment advice or a solicitation to buy or sell financial instruments. Past performance is not indicative of future results. All investment decisions involve risk and are the sole responsibility of the reader.