
Duration vs convexity: two layers of rate sensitivity
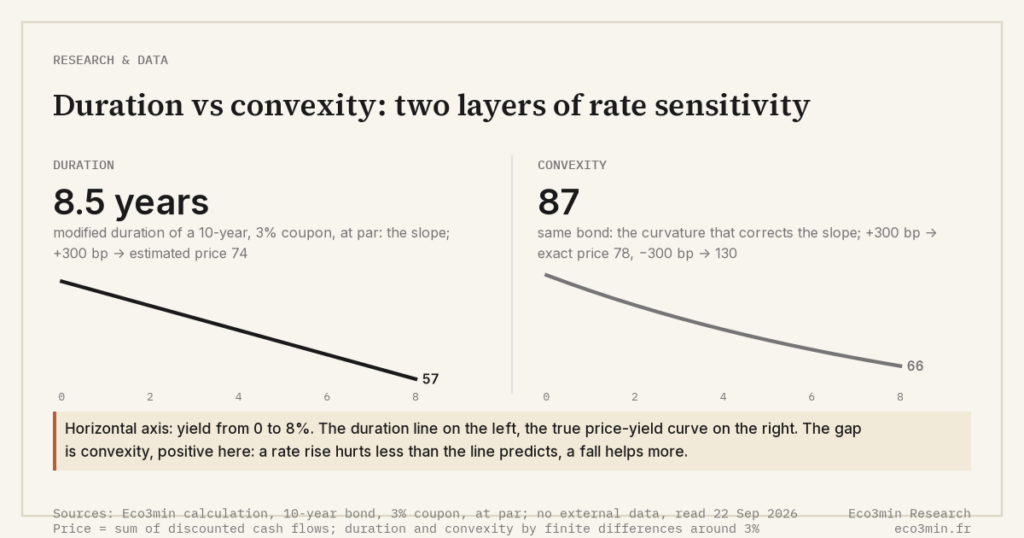
Duration is a bond’s first-order sensitivity to yield changes — the slope of the price-yield line. Convexity is the second-order term: the curvature around that line. They are not rival metrics. Convexity is the correction to what duration alone predicts, and its sign — positive for vanilla bonds, negative for callables and mortgage bonds — decides whether a large rate move hurts less or more than the straight-line estimate.
In this comparison
Why this comparison matters
Duration is the number every bond factsheet displays; convexity is the one most investors skip. For small, gradual rate moves that omission is harmless, because duration’s linear estimate holds. The problem appears in violent regimes, when a large, fast move makes duration visibly wrong and convexity becomes the difference between a manageable loss and a surprise. The bond rout of 2022 was exactly that moment — and treating duration as the whole story is what made it look inexplicable.
What duration is
Duration measures how much a bond’s price moves for a small change in yield. To first order, a bond with a duration of five years loses roughly five percent of its value for each one-percentage-point rise in rates. It is a slope: one number summarising rate sensitivity, lengthened by longer maturities and lower coupons, so a 30-year Treasury carries a duration on the order of 17 years against roughly two for a 2-year note. In 2022 that slope turned painfully literal: as the Federal Reserve lifted its policy rate by 525 basis points across 2022-2023, intermediate Treasuries lost 10.6% — their worst calendar year since at least 1926 — and the Bloomberg US Aggregate fell about 13%, its worst year since the index began in 1976.
→ Complete explanation: What is duration and why does it matter for bond investors?
What convexity is
Convexity measures how duration itself changes as yields move — the curvature of the price-yield relationship rather than its slope. Because that relationship bends, a straight-line duration estimate understates gains when yields fall and overstates losses when they rise; for a vanilla bond, the curvature works in the holder’s favour. The effect is tiny for small moves and grows with the square of the move — invisible in calm markets, decisive in turbulent ones. Positive convexity is, in effect, a cushion that duration alone does not capture.
→ Detailed explanation: How does convexity protect bondholders in falling-rate environments?
The key differences
They are layers, not rivals. A bond’s price change for a given yield move is approximated by two terms: a duration term that is linear and a convexity term that is squared. Duration is the first answer; convexity is the correction to it. Asking “duration or convexity” is like asking whether speed or acceleration describes a moving car.
Convexity is asymmetric, and the 2022 evidence is concrete. An index of the longest zero-coupon Treasuries lost 39.2% in 2022, a record drawdown in data reaching back to 1754. Yet a pure duration estimate — applied to the roughly two-percentage-point rise in 30-year yields against a duration approaching three decades — would have implied a loss on the order of fifty to sixty percent (a straight-line approximation). The gap is positive convexity at work: the curve bent the realised loss well above the linear projection, and the same curvature amplifies gains when yields fall.
The sign of convexity is what actually decides risk. Vanilla Treasuries have positive convexity; callable bonds and mortgage-backed securities have negative convexity. For an MBS, falling rates trigger refinancing — the bond is effectively called early, capping price gains — while rising rates slow prepayment and extend duration into the selloff, so losses compound. Research by Samuel Hanson documents that these MBS duration shifts act as large-scale shocks to the interest-rate risk the whole market must absorb. Negative convexity is the cushion in reverse: it makes large moves hurt more, in both directions.
How they behave across regimes
In stable-rate regimes — the slow, low-volatility tightening of much of the 2010s — duration is sufficient and convexity is a rounding error. In violent regimes the picture inverts: both the 2022 rout and the 1994 bond selloff saw convexity become material, because the convexity term scales with the square of the yield change. The switching parameter is the magnitude and speed of the move, compounded by whether embedded options are present. Vanilla bondholders were cushioned by positive convexity in 2022, while holders of mortgage bonds watched negative convexity extend their duration precisely as yields climbed. You’ll find every paired breakdown in one place.
Duration tells you the slope of the loss; convexity tells you whether that slope is a cushion or a trap.
→ Framework: Monetary regimes, interest rates, liquidity and market cycles
The common confusion
The frequent error is to treat duration as the complete measure of a bond’s rate risk — to read one number off a factsheet and stop. For small moves that approximation holds; for large moves it breaks, and for instruments with embedded options it can break in the wrong direction. An investor who matches duration between a Treasury and a mortgage bond may assume the two are equally exposed, when their convexity — one positive, one negative — means they behave very differently in a sharp move. Duration describes the first-order risk; it is silent on the curvature that governs the tails.
Practical observation
What the data suggests for framing your own analysis:
- Question to ask yourself: for a given bond or fund, is its convexity positive or negative — and how large would a rate move need to be before that distinction changes the outcome materially?
- Data to monitor: the size and speed of yield moves (the convexity term scales with the square of the move) and the presence of callable or mortgage exposure in a portfolio.
- Historical parallel: in 2022, long-dated zero-coupon Treasuries lost 39.2% while intermediate Treasuries lost 10.6% — the spread between them is duration; the gap between realised and straight-line losses is convexity.
- What the literature documents: Samuel Hanson’s work on mortgage convexity, showing aggregate MBS duration shifts as a driver of bond risk premia.
This is descriptive information to help you frame your own analysis. Eco3min does not provide investment advice.
Go deeper
📊 Full study: 30-year Treasury yield: the duration-risk record
📁 Datasets: Eco3min Dataset Hub
Related guides
Frequently asked questions
How is duration different from convexity?
Duration is the first-order sensitivity of a bond’s price to yield changes — the slope of the price-yield line, in years. Convexity is the second-order sensitivity: the curvature around that slope, describing how duration itself shifts as yields move. They are not competing measures but successive terms of the same approximation. In calm markets duration alone is a close estimate; in sharp moves the convexity term, which grows with the square of the change, becomes the part that decides the outcome.
Why does convexity matter more during large rate moves?
Because the convexity term scales with the square of the yield change, it is negligible for small moves and dominant for violent ones. A one-basis-point move barely registers; a two-percentage-point move makes it material. The 2022 rout is the clearest case: an index of the longest zero-coupon Treasuries fell 39.2%, yet a straight-line duration estimate against that yield move would have implied a substantially deeper loss. Positive convexity bent the realised loss above the linear projection — and works in reverse when yields fall, lifting gains above what duration alone predicts.
What is negative convexity and which bonds have it?
Negative convexity describes a price-yield curve that bends against the holder, found in callable bonds and mortgage-backed securities. When rates fall, the issuer or borrower can repay early — the bond is called, the mortgage refinanced — capping price appreciation. When rates rise, prepayment slows and the security’s effective duration extends, deepening the loss precisely when the holder would prefer it to shorten. The result is asymmetric in the wrong direction: limited upside, amplified downside. It is most pronounced in MBS, where shifting aggregate duration feeds back into the rate risk the broader market must price.
Last updated — 22 September 2026
Disclaimer – Financial Information: The analyses, commentary, and content published on eco3min.fr are provided for informational and educational purposes only. They do not constitute investment advice or a solicitation to buy or sell financial instruments. Past performance is not indicative of future results. All investment decisions involve risk and are the sole responsibility of the reader.
Read next
Full pillar →60/40 vs all-weather: how the portfolios behave
A 60/40 portfolio splits capital 60% stocks, 40% bonds; an all-weather portfolio splits risk evenly across four macro…
Bitcoin vs gold: store of value compared
Bitcoin and gold are both framed as scarce "hard money," but they have not behaved the same way.…
Bitcoin ETF vs self-custody: structure compared
A spot Bitcoin ETF and self-custody give exposure to the same underlying asset, so they do not differ…