
Every Hyperinflation Since 1795
Fifty-seven hyperinflations have been documented since 1795. None is running in 2026 under the criterion economists use — while ten economies are classified as hyperinflationary under the accounting standard.
The record
Every documented hyperinflation, ranked
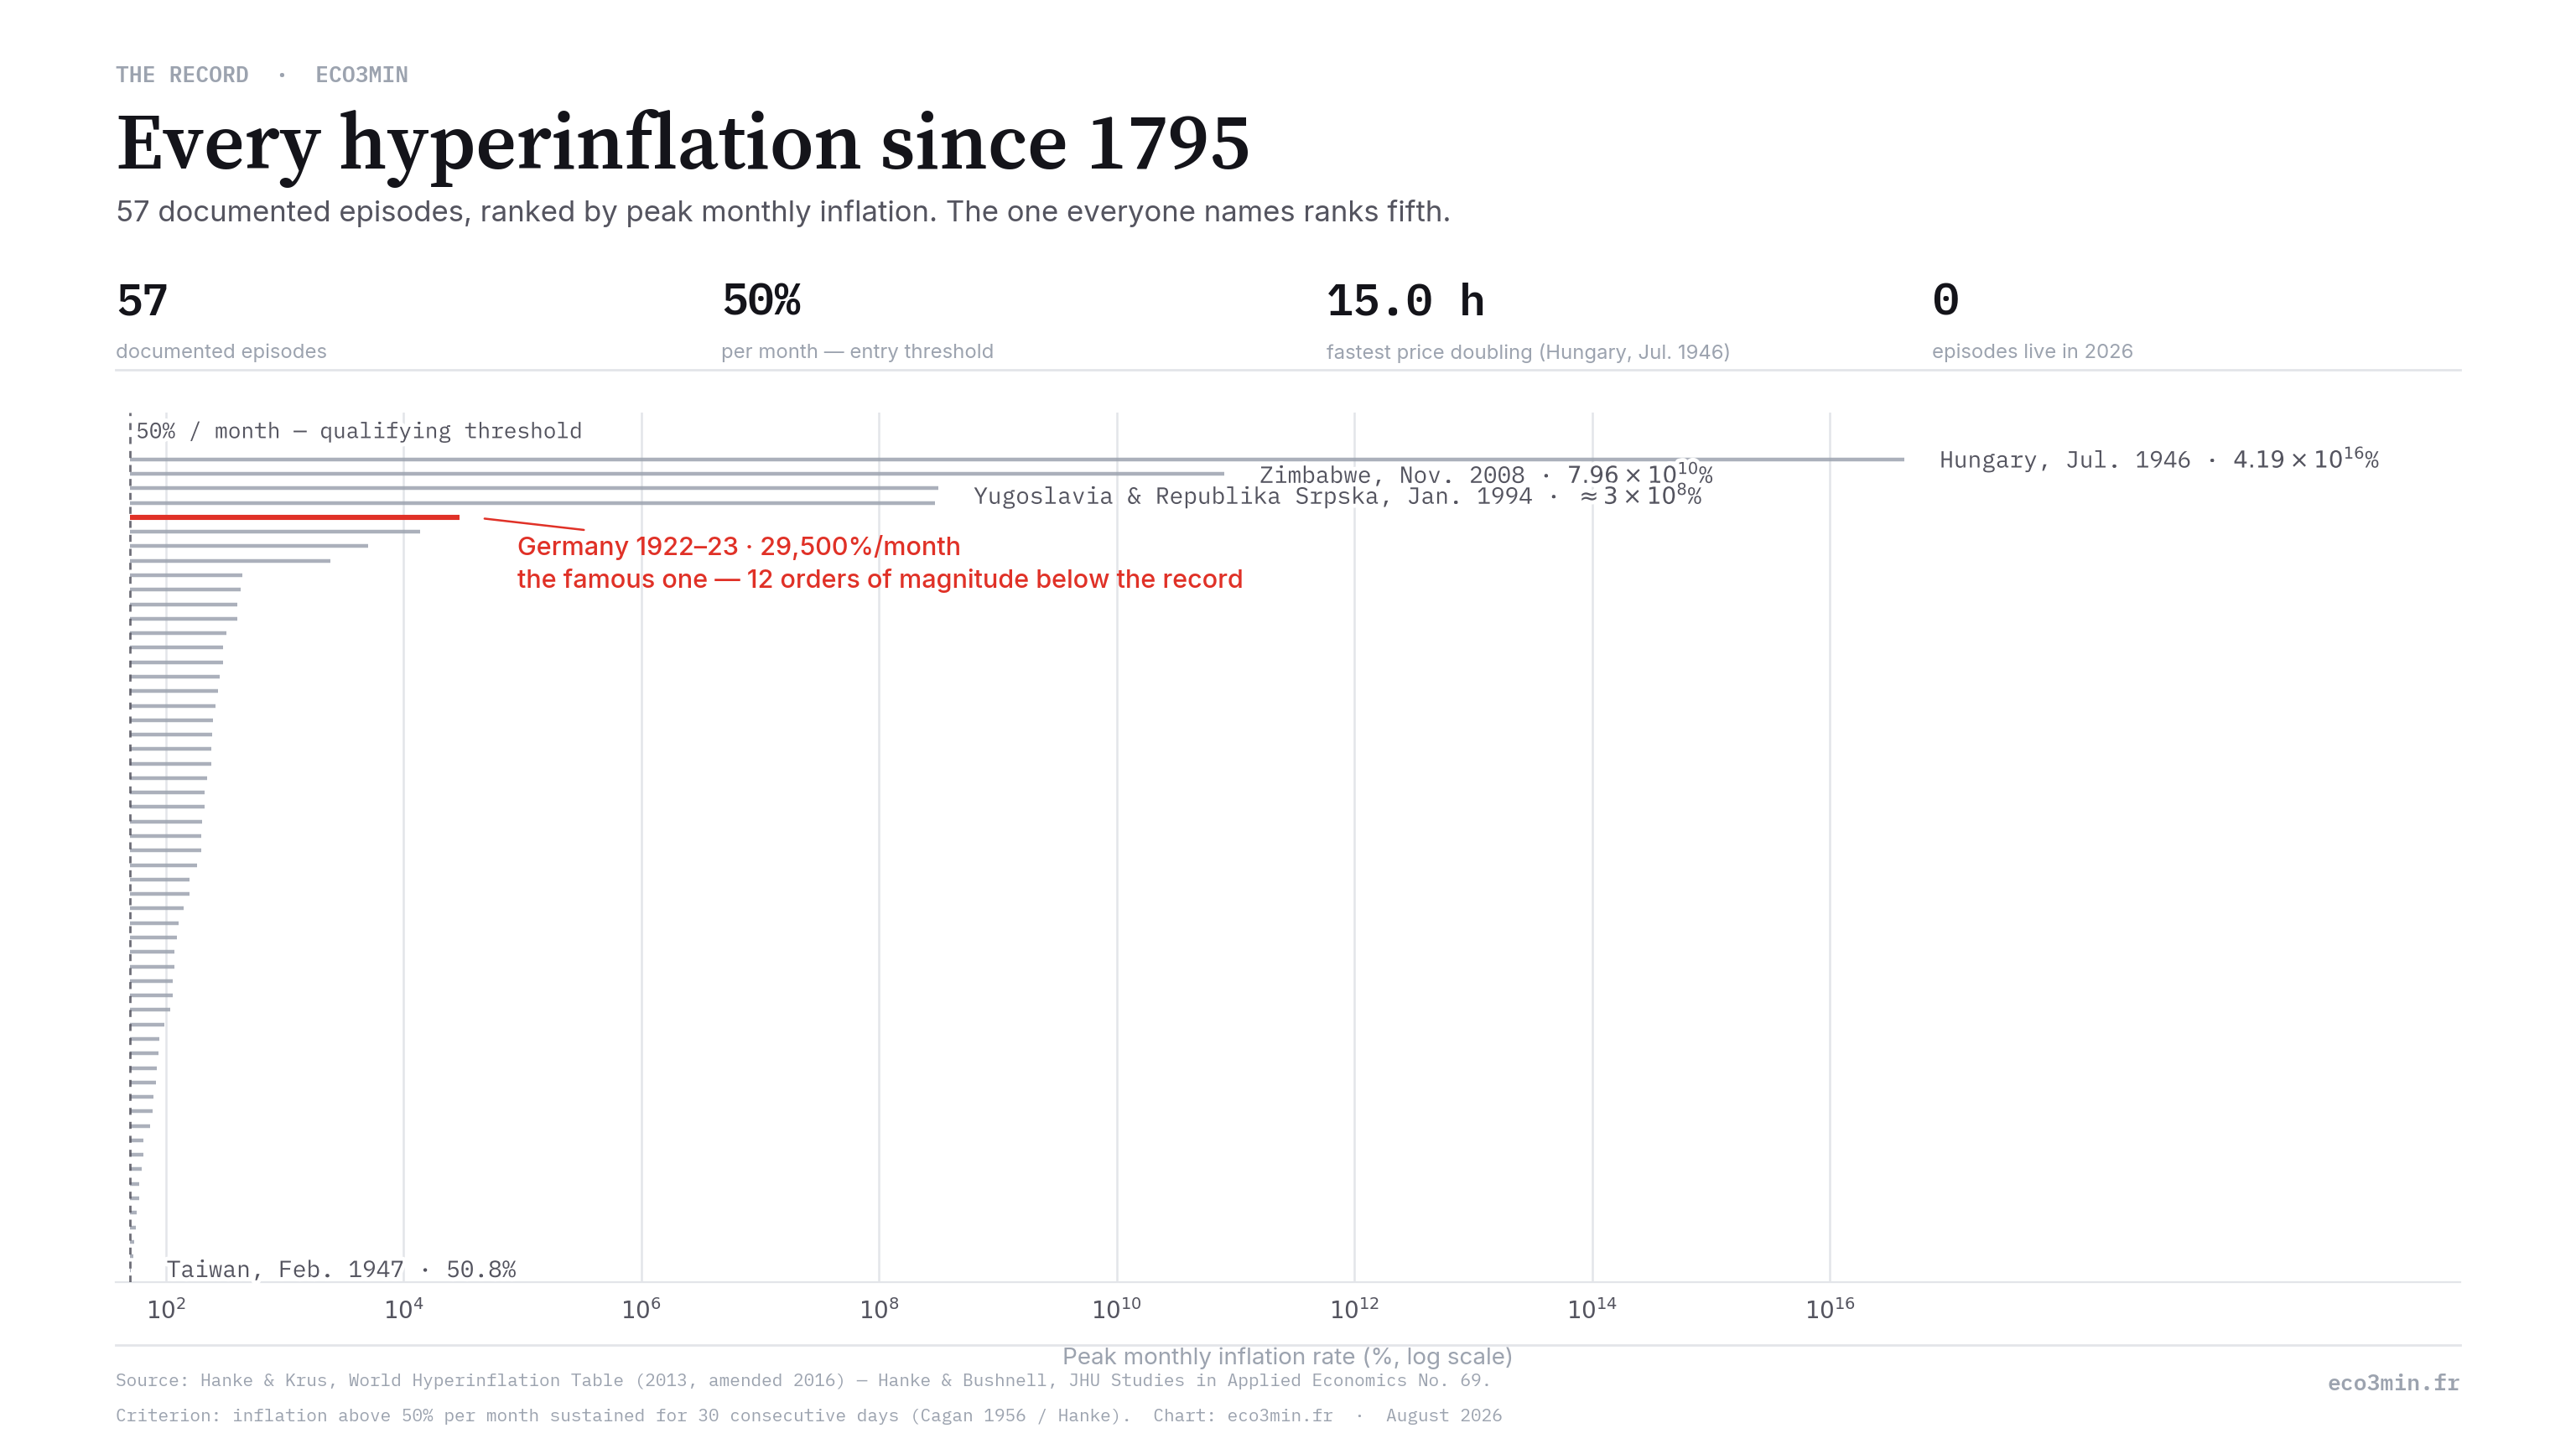
Ranked by peak monthly inflation rate. The spread runs across fifteen orders of magnitude: from Taiwan in February 1947, which cleared the qualifying threshold by less than one point, to Hungary in July 1946, where prices doubled roughly every fifteen hours.
| # | Location | Episode | Peak month | Peak monthly inflation | Daily | Prices double in |
|---|---|---|---|---|---|---|
| 1 | Hungary | Aug. 1945 – Jul. 1946 | Jul. 1946 | 4.19 × 10¹⁶ % | 207.00% | 15.0 hours |
| 2 | Zimbabwe | Mar. 2007 – mid-Nov. 2008 | Mid-Nov. 2008 | 7.96 × 10¹⁰ % | 98.00% | 24.7 hours |
| 3 | Yugoslavia | Apr. 1992 – Jan. 1994 | Jan. 1994 | 3.13 × 10⁸ % | 64.60% | 1.41 days |
| 4 | Republika Srpska | Apr. 1992 – Jan. 1994 | Jan. 1994 | 2.97 × 10⁸ % | 64.30% | 1.41 days |
| 5 | Germany | Aug. 1922 – Dec. 1923 | Oct. 1923 | 29,500% | 20.90% | 3.70 days |
| 6 | Greece | May 1941 – Dec. 1945 | Oct. 1944 | 13,800% | 17.90% | 4.27 days |
| 7 | China | Oct. 1947 – mid-May 1949 | Apr. 1949 | 5,070% | 14.10% | 5.34 days |
| 8 | Free City of Danzig | Aug. 1922 – mid-Oct. 1923 | Sep. 1923 | 2,440% | 11.40% | 6.52 days |
| 9 | Armenia | Oct. 1993 – Dec. 1994 | Nov. 1993 | 438% | 5.77% | 12.5 days |
| 10 | Turkmenistan | Jan. 1992 – Nov. 1993 | Nov. 1993 | 429% | 5.71% | 12.7 days |
| 11 | Taiwan | Aug. 1945 – Sep. 1945 | Aug. 1945 | 399% | 5.50% | 13.1 days |
| 12 | Peru | Jul. 1990 – Aug. 1990 | Aug. 1990 | 397% | 5.49% | 13.1 days |
| 13 | Bosnia and Herzegovina | Apr. 1992 – Jun. 1993 | Jun. 1992 | 322% | 4.92% | 14.6 days |
| 14 | France | May 1795 – Nov. 1796 | Mid-Aug. 1796 | 304% | 4.77% | 15.1 days |
| 15 | China | Jul. 1943 – Aug. 1945 | Jun. 1945 | 302% | 4.75% | 15.2 days |
| 16 | Ukraine | Jan. 1992 – Nov. 1994 | Jan. 1992 | 285% | 4.60% | 15.6 days |
| 17 | Poland | Jan. 1923 – Jan. 1924 | Oct. 1923 | 275% | 4.50% | 16.0 days |
| 18 | Nicaragua | Jun. 1986 – Mar. 1991 | Mar. 1991 | 261% | 4.37% | 16.4 days |
| 19 | Congo (Zaire) | Nov. 1993 – Sep. 1994 | Nov. 1993 | 250% | 4.26% | 16.8 days |
| 20 | Russia | Jan. 1992 – Jan. 1992 | Jan. 1992 | 245% | 4.22% | 17.0 days |
| 21 | Bulgaria | Feb. 1997 – Feb. 1997 | Feb. 1997 | 242% | 4.19% | 17.1 days |
| 22 | Moldova | Jan. 1992 – Dec. 1993 | Jan. 1992 | 240% | 4.16% | 17.2 days |
| 23 | Venezuela ◦ | Nov. 2016 – Ongoing (as of Dec. 2016) | Nov. 2016 | 221% | 3.96% | 17.8 days |
| 24 | Russia / USSR | Jan. 1922 – Feb. 1924 | Feb. 1924 | 212% | 3.86% | 18.5 days |
| 25 | Georgia | Sep. 1993 – Sep. 1994 | Sep. 1994 | 211% | 3.86% | 18.6 days |
| 26 | Tajikistan | Jan. 1992 – Oct. 1993 | Jan. 1992 | 201% | 3.74% | 19.1 days |
| 27 | Georgia | Mar. 1992 – Apr. 1992 | Mar. 1992 | 198% | 3.70% | 19.3 days |
| 28 | Argentina | May 1989 – Mar. 1990 | Jul. 1989 | 197% | 3.69% | 19.4 days |
| 29 | Bolivia | Apr. 1984 – Sep. 1985 | Feb. 1985 | 183% | 3.53% | 20.3 days |
| 30 | Belarus | Jan. 1992 – Feb. 1992 | Jan. 1992 | 159% | 3.22% | 22.2 days |
| 31 | Kyrgyzstan | Jan. 1992 – Jan. 1992 | Jan. 1992 | 157% | 3.20% | 22.3 days |
| 32 | Kazakhstan | Jan. 1992 – Jan. 1992 | Jan. 1992 | 141% | 2.97% | 24.0 days |
| 33 | Austria | Oct. 1921 – Sep. 1922 | Aug. 1922 | 129% | 2.80% | 25.5 days |
| 34 | Bulgaria | Feb. 1991 – Mar. 1991 | Feb. 1991 | 123% | 2.71% | 26.3 days |
| 35 | Uzbekistan | Jan. 1992 – Feb. 1992 | Jan. 1992 | 118% | 2.64% | 27.0 days |
| 36 | Azerbaijan | Jan. 1992 – Dec. 1994 | Jan. 1992 | 118% | 2.63% | 27.0 days |
| 37 | Congo (Zaire) | Oct. 1991 – Sep. 1992 | Nov. 1991 | 114% | 2.57% | 27.7 days |
| 38 | Peru | Sep. 1988 – Sep. 1988 | Sep. 1988 | 114% | 2.57% | 27.7 days |
| 39 | Taiwan | Oct. 1948 – May 1949 | Oct. 1948 | 108% | 2.46% | 28.9 days |
| 40 | Hungary | Mar. 1923 – Feb. 1924 | Jul. 1923 | 97.9% | 2.30% | 30.9 days |
| 41 | Chile | Oct. 1973 – Oct. 1973 | Oct. 1973 | 87.6% | 2.12% | 33.5 days |
| 42 | Estonia | Jan. 1992 – Feb. 1992 | Jan. 1992 | 87.2% | 2.11% | 33.6 days |
| 43 | Angola | Dec. 1994 – Jan. 1997 | May 1996 | 84.1% | 2.06% | 34.5 days |
| 44 | Brazil | Dec. 1989 – Mar. 1990 | Mar. 1990 | 82.4% | 2.02% | 35.1 days |
| 45 | Democratic Republic of Congo | Aug. 1998 – Aug. 1998 | Aug. 1998 | 78.5% | 1.95% | 36.4 days |
| 46 | Poland | Oct. 1989 – Jan. 1990 | Jan. 1990 | 77.3% | 1.93% | 36.8 days |
| 47 | Armenia | Jan. 1992 – Feb. 1992 | Jan. 1992 | 73.1% | 1.85% | 38.4 days |
| 48 | Tajikistan | Oct. 1995 – Nov. 1995 | Nov. 1995 | 65.2% | 1.69% | 42.0 days |
| 49 | Latvia | Jan. 1992 – Jan. 1992 | Jan. 1992 | 64.4% | 1.67% | 42.4 days |
| 50 | Turkmenistan | Nov. 1995 – Jan. 1996 | Jan. 1996 | 62.5% | 1.63% | 43.4 days |
| 51 | Philippines | Jan. 1944 – Dec. 1944 | Jan. 1944 | 60% | 1.58% | 44.9 days |
| 52 | Yugoslavia | Sep. 1989 – Dec. 1989 | Dec. 1989 | 59.7% | 1.57% | 45.1 days |
| 53 | Germany | Jan. 1920 – Jan. 1920 | Jan. 1920 | 56.9% | 1.51% | 46.8 days |
| 54 | Kazakhstan | Nov. 1993 – Nov. 1993 | Nov. 1993 | 55.5% | 1.48% | 47.8 days |
| 55 | Lithuania ◦ | Jan. 1992 – Jan. 1992 | Jan. 1992 | 54% | 1.45% | 48.8 days |
| 56 | Belarus ◦ | Aug. 1994 – Aug. 1994 | Aug. 1994 | 53.4% | 1.44% | 49.3 days |
| 57 | Taiwan ◦ | Feb. 1947 – Feb. 1947 | Feb. 1947 | 50.8% | 1.38% | 51.4 days |
◦ = entry absent from the 53-row PDF circulated by the Cato Institute (see below). Bar length is proportional to log₁₀ of the peak monthly rate.
What makes an episode qualify
Three criteria, all of which must hold. First, monthly inflation above 50% — the convention Phillip Cagan set in 1956 and which the profession adopted. Second, that rate sustained for at least 30 consecutive days, which excludes single-print spikes. Third, the episode must be fully documented, with estimates that a third party can replicate from the sources.
The third criterion is the binding one. It is why the table is short: many alleged hyperinflations fail not on magnitude but on data. Two periods in the same country count as separate episodes when they are separated by twelve or more consecutive months below 50%. Slicing time into episodes that way is already thinking in regimes, the grid that organises the definition and regimes of inflation well below 50% a month.
Price indices are not homogeneous across rows. Most entries use a consumer price index; several use wholesale prices; Zimbabwe 2008 and Venezuela 2016 are estimated from implied exchange rates under purchasing power parity, because official series had ceased to be usable. The price_index_type column in the CSV carries this per row. Comparing a wholesale-based peak with a PPP-implied one is an approximation, and the authors say so.
Why the count is 57 — and why the most-downloaded table shows 53
The table published in the Routledge Handbook of Major Events in Economic History in 2013 contained 56 episodes. Venezuela was added as the 57th entry in December 2016, after monthly inflation stayed above 50% for 30 consecutive days from 3 November of that year.
The PDF hosted by the Cato Institute — the version most often linked and cited — stops at 53 rows. It ends at Kazakhstan, November 1993, at 55.5% per month. Three episodes from the original 56 are missing from it: Lithuania (54.0%), Belarus in August 1994 (53.4%) and Taiwan in February 1947 (50.8%) — the three lowest-ranked, all within five points of the threshold. Add those three and Venezuela, and the count reconciles: 53 + 3 = 56, plus Venezuela = 57. The table reproduced above is the amended 2016 version, which is complete.
One further artefact worth flagging: in the 2016 amended table, two entries are printed with the rank 55 (Lithuania and Belarus) and the next is printed as 57. Rank 56 does not appear. The numbering in the column above is continuous, so ranks 55 to 57 here differ by one from the printed source for those rows.
Nothing qualifies in 2026 — and ten economies are still called hyperinflationary
No economy currently meets the 50%-per-month criterion. That is not the same as saying no economy is in monetary distress, and it is not what corporate reporting means when it uses the word. Between monetary distress and the Cagan threshold lies the whole scale of price regimes, the one the complete guide to inflation — mechanisms, measurement, history and effects walks through.
IAS 29, the IFRS standard on financial reporting in hyperinflationary economies, works from a different test: a cumulative inflation rate approaching or exceeding 100% over three years, read together with qualitative indicators such as pricing in a foreign currency or indexation of wages. On that basis, ten economies were classified as hyperinflationary for reporting periods ending 30 June 2026 — Argentina, Haiti, Iran, Lebanon, Malawi, South Sudan, Sudan, Turkey, Venezuela and Zimbabwe. Burundi and Sierra Leone left the list at that date.
A 100% cumulative rise over three years is roughly 26% a year. The Cagan threshold is 50% a month, which compounds to about 12,900% a year. The two definitions differ by more than two orders of magnitude, and they exist for different purposes: one to date historical monetary collapses, the other to decide when a set of accounts stops being meaningful in nominal terms.
Zimbabwe’s June 2026 status is not uniform across sources: some firms retain it for want of reliable data rather than on positive evidence. Counting it out gives nine.
What this table does not show
It records peaks, not costs. The rank of an episode says nothing about output lost, savings destroyed or how long the disorganisation lasted. Germany 1922–23 sits fifth by magnitude and first by almost every measure of historical consequence. What a state does to its own unit after the episode belongs to a different ledger, the separate record of currency redenominations since 1960.
It also has a survivorship property built into its third criterion: an episode that occurred where no replicable price series survives cannot enter. North Korea between December 2009 and early 2011 is the case the authors themselves flag — their estimates, based on black-market exchange rates and rice prices, put the peak between 348% and 496% a month, which would place it somewhere between ninth and thirteenth in the ranking above. It stays out because rice is not a general price index.
Columns include recomputed doubling times and a flag for the four rows absent from the 53-row PDF. Compilation: Hanke & Krus. Eco3min additions: CC BY 4.0.
Questions
How many hyperinflations have there been in history?
Fifty-seven episodes meet the Hanke-Krus criteria: inflation above 50% per month, sustained for at least 30 consecutive days, with documented and replicable estimates. The table published in 2013 listed 56; Venezuela was added as the 57th entry in December 2016. North Korea (2009-2011) is discussed in the authors’ notes but excluded, because the only reliable price series available was for rice.
Which hyperinflation was the worst ever recorded?
Hungary in July 1946, at a peak monthly rate of 4.19 × 10^16 percent. Prices doubled roughly every 15 hours. Zimbabwe in November 2008 ranks second at 7.96 × 10^10 percent per month, with a doubling time of 24.7 hours.
Where does the German hyperinflation of 1923 rank?
Fifth, at 29,500% per month in October 1923 — around 12 orders of magnitude below the Hungarian record. Its notoriety comes from its political consequences and from the volume of scholarship devoted to it, not from its magnitude.
Is any economy in hyperinflation in 2026?
Not under the Cagan criterion of 50% per month: no episode currently qualifies. Under IAS 29, the accounting standard, which uses a three-year cumulative inflation rate above 100% together with qualitative indicators, ten economies were classified as hyperinflationary as of 30 June 2026: Argentina, Haiti, Iran, Lebanon, Malawi, South Sudan, Sudan, Turkey, Venezuela and Zimbabwe. The two definitions answer different questions.
Last updated — 18 September 2026
Disclaimer – Financial Information: The analyses, commentary, and content published on eco3min.fr are provided for informational and educational purposes only. They do not constitute investment advice or a solicitation to buy or sell financial instruments. Past performance is not indicative of future results. All investment decisions involve risk and are the sole responsibility of the reader.