
The U.S. federal deficit at each business-cycle low in unemployment
The U.S. federal deficit at each full-employment low
Federal surplus or deficit as a share of GDP, in the year unemployment reached each business-cycle low. Toggle the views below.
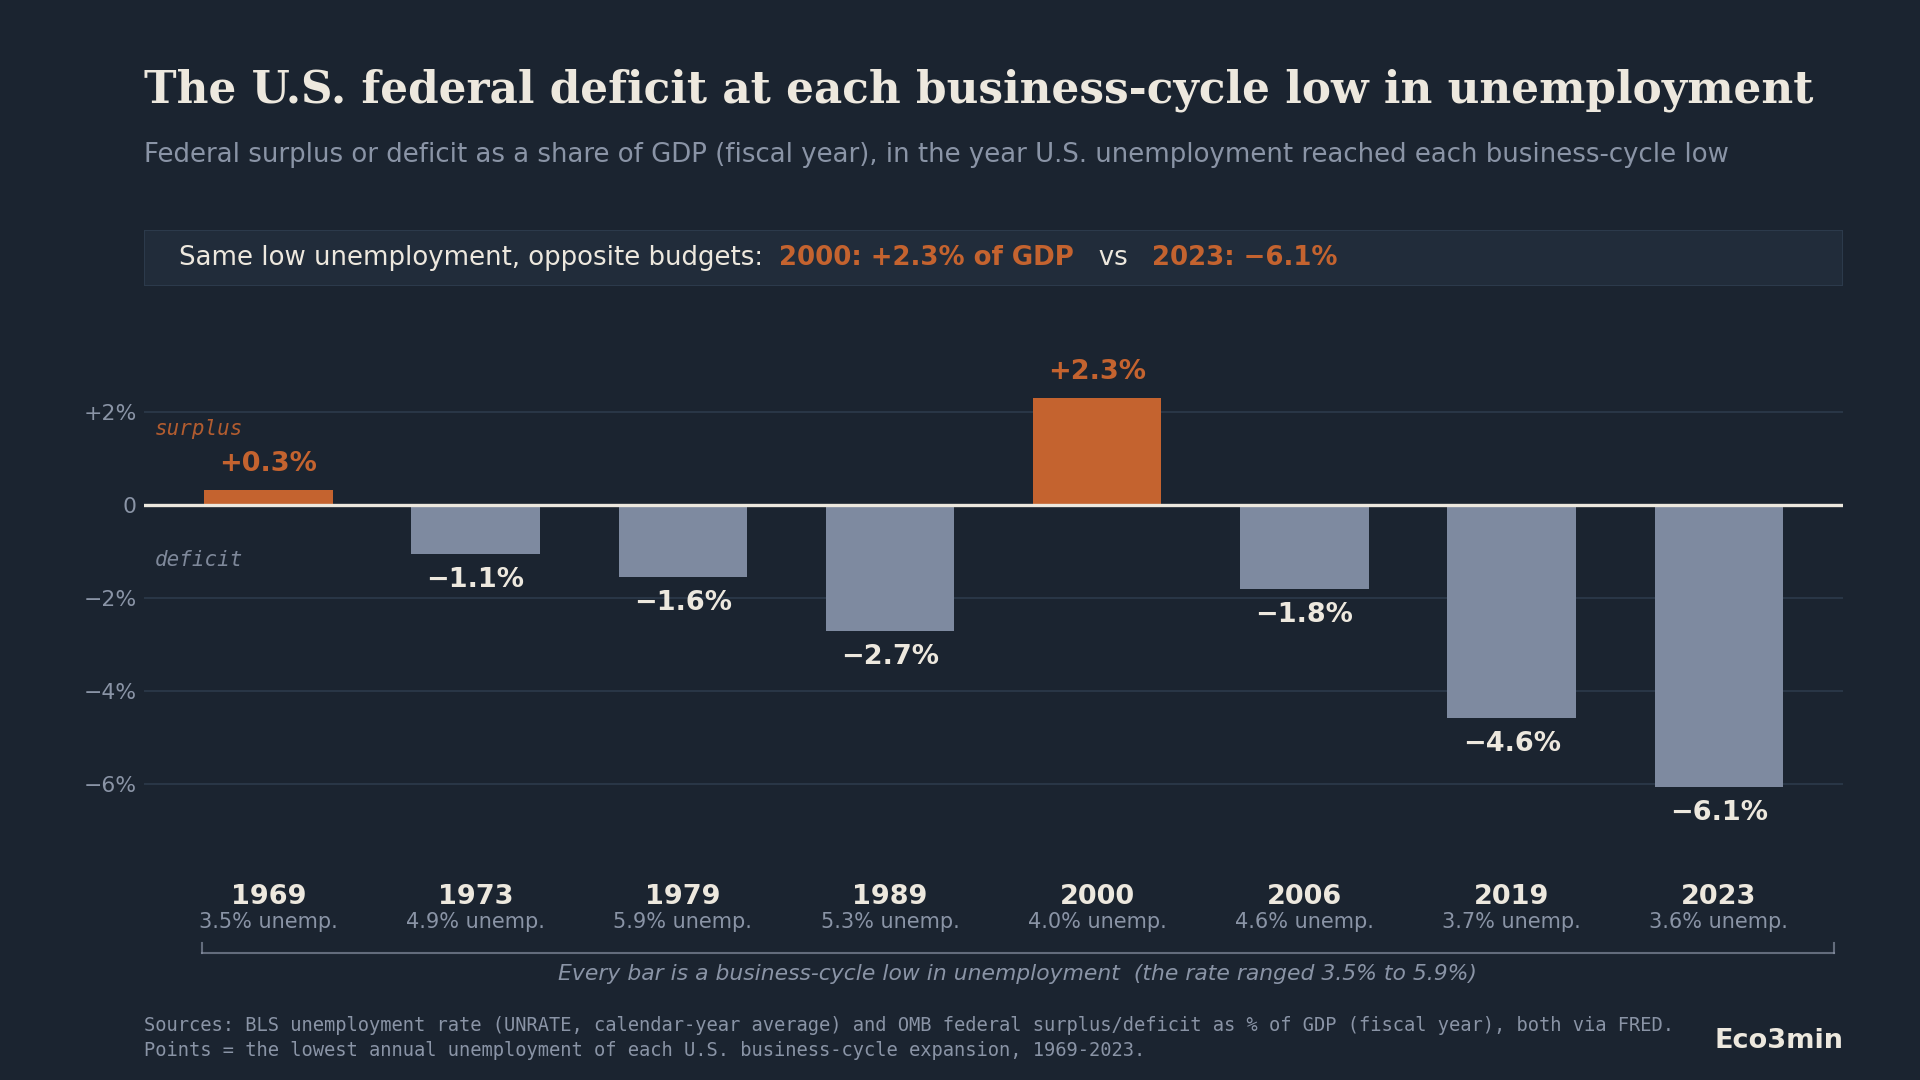
TL;DR. The last two times U.S. unemployment fell to a business-cycle low with the budget in surplus were 1969 and 2000. At the current expansion’s unemployment low in 2023, unemployment was just as low (3.6%), but the federal budget ran a deficit of about 6% of GDP. The relationship between the labor-market cycle and the budget balance has changed; the chart documents the pattern without asserting a cause.
In the year U.S. unemployment reached the low point of each business-cycle expansion since the 1960s, the federal budget was close to balance — and twice in outright surplus. That link has weakened. In 2023, when the unemployment rate touched 3.4% (its lowest monthly reading of the current expansion) and averaged 3.6% for the year, the federal government ran a deficit of about 6% of GDP — a level the U.S. had previously reached only during World War II and in the years after the 2008 financial crisis.
This page documents the federal deficit as a share of GDP measured at each full-employment low from 1969 to 2023, using a single mechanical rule for selecting the years, and lays out two competing readings of what the pattern means. It takes no position on which reading is correct.
Key findings at a glance
Metric plotted: Federal surplus or deficit as a share of GDP (fiscal year), OMB via FRED
Selection rule: the year of the lowest annual-average unemployment rate of each U.S. business-cycle expansion, 1969–2023
1969 (unemployment 3.5%): budget surplus of +0.3% of GDP
2000 (unemployment 4.0%): budget surplus of +2.3% of GDP
2019 (unemployment 3.7%): deficit of 4.6% of GDP
2023 (unemployment 3.6%): deficit of 6.1% of GDP
After 2023: as unemployment rose off its low (4.0% in 2024, 4.3% in 2025), the deficit stayed near 6% of GDP (6.2% in 2024, 5.8% in 2025)
A budget that used to move with the cycle
In standard fiscal accounting, the federal deficit has two components: a cyclical part that widens automatically when unemployment rises (tax receipts fall, safety-net spending rises) and narrows when the labor market tightens, and a structural part that reflects the level of spending and taxation independent of the cycle. The Congressional Budget Office publishes this decomposition. One implication is that at full employment — when the cyclical component is near zero — the observed deficit is close to the structural deficit.
For most of the postwar period, that structural deficit was small. In fiscal 1969, with unemployment averaging 3.5%, the budget ran a surplus of about 0.3% of GDP — the last surplus of the long 1960s expansion. Through the 1970s and 1980s, the deficit at each expansion’s unemployment low stayed modest: about 1.0% of GDP in 1973, 1.6% in 1979, 2.7% in 1989. In fiscal 2000, at the peak of the late-1990s expansion and with unemployment at 4.0%, the budget ran a surplus of about 2.3% of GDP.
The two most recent expansion lows break from that pattern. In 2019, the last full year before the pandemic, unemployment averaged 3.7% — lower than in 1979, 1989 or 2000 — yet the deficit was 4.6% of GDP. In 2023, at the current expansion’s unemployment low of 3.6%, the deficit was 6.1% of GDP. At comparable, or lower, unemployment than in the surplus years, the budget balance is now six to eight percentage points of GDP further into deficit.
Two ways to read the decoupling
The data are not in dispute; their interpretation is. Two readings are commonly advanced, and they point in different directions.
One reading treats it as a structural break. On this view, a deficit near 6% of GDP at full employment is a warning that the budget is no longer self-correcting. When the cyclical component is near zero and the deficit is still this wide, the gap is structural — driven by mandatory spending, demographics and rising interest costs rather than by the business cycle. If the deficit is already this large at the top of the cycle, the argument runs, the next recession starts from a materially weaker fiscal position than 2000 or even 2006.
The other reading treats the comparison itself as the problem. On this view, comparing raw deficit-to-GDP ratios across six decades conflates very different regimes. The share of federal spending committed to Social Security, Medicare and net interest is far higher today than in 1969 or 2000, and those are largely non-discretionary. Demographics — an older population drawing benefits — and the level of interest rates change the arithmetic in ways that have nothing to do with whether the labor market is tight. On this reading, the benchmark that “full employment should mean balance” is itself a relic of a different fiscal structure. Read alongside: our analysis “US Federal Deficits Above 5% of GDP at Full Employment (1929–2025)”.
The chart is consistent with both readings. It shows a temporal pattern — the deficit at each full-employment low — without asserting what produced it.
What the chart does not say
Several limits are worth stating plainly, because they bound what can be inferred.
It does not attribute the change to any administration or policy. The two surplus years span a Republican-tail (1969) and a Democratic administration (2000); the two widest full-employment deficits span a Republican administration (2019) and a Democratic one (2023). The pattern does not map onto party.
It does not isolate the structural deficit precisely. Using the observed deficit at the unemployment low is an approximation of the structural deficit, not the CBO’s cyclically-adjusted figure. Residual cyclical slack, one-off outlays, and the exact timing of the unemployment low within the fiscal year all introduce noise. The direction of the change across cycles is large enough to survive that noise; the precise level in any single year is an approximation.
It ends at 2023 deliberately. 2023 is the unemployment low of the current expansion (3.4% monthly, 3.6% for the year); since then unemployment has risen to about 4.2%, so 2024 and 2025 are no longer “full-employment lows” and are shown only as context. Extending the “full-employment” label to 2026 would be inaccurate: the labor market has loosened.
Common misinterpretations
Reading the deficit as a cyclical figure. A 6% deficit is unremarkable during a recession, when the cyclical component is large. The cyclical component is precisely what widens without legislation, and it is the visible trace of the budget’s automatic response to a downturn. The point of the chart is that this deficit occurs at a cycle low, when the cyclical component should be small — which is what makes it comparable to the 1969 and 2000 surpluses rather than to recession-year deficits.
Treating the two surpluses as the norm. Surpluses at full employment are historically the exception, not the rule: only 1969 and 2000 appear here. The 1970s and 1980s full-employment lows already ran modest deficits (1.0% to 2.7% of GDP). The change documented here is one of degree — from small deficits and occasional surpluses to deficits several times larger — not a move from perpetual balance to deficit.
Equating “deficit at full employment” with an imminent crisis. The chart is a descriptive comparison across cycle lows, not a forecast. A larger structural deficit changes the fiscal starting point for the next downturn; it does not, by itself, date or size that downturn.
Methodology and sources
Selection rule. Each point is the calendar year in which the annual-average U.S. unemployment rate reached the low of a business-cycle expansion, from the 1960s expansion through the current one: 1969, 1973, 1979, 1989, 2000, 2006, 2019 and 2023. Using every expansion low (rather than a hand-picked subset) is what keeps the comparison from cherry-picking; the 1970s and 1980s lows, which run modest deficits, are included.
Unemployment. Bureau of Labor Statistics unemployment rate (series UNRATE), calendar-year average, retrieved via FRED. The 2023 monthly low was 3.4% (April 2023); the calendar-year average was 3.6%.
Deficit. Federal surplus or deficit as a percent of GDP (series FYFSGDA188S, sourced from OMB historical tables), fiscal year, retrieved via FRED. Values: 1969 +0.3%, 1973 −1.0%, 1979 −1.6%, 1989 −2.7%, 2000 +2.3%, 2006 −1.8%, 2019 −4.6%, 2023 −6.1%. Context years: 2024 −6.2%, 2025 −5.8%.
Matching convention. Unemployment is a calendar-year average; the deficit is a fiscal year (October–September). The two are aligned by year. The offset is at most a few months and does not affect the multi-decade pattern.
Cyclical vs structural. The observed deficit at an unemployment low is used as a proxy for the structural deficit, on the standard reasoning that the cyclical component of the deficit is near zero at full employment. The Congressional Budget Office publishes formal cyclically-adjusted (structural) deficit estimates; those differ from the observed figure by the residual cyclical component and are the more precise measure for any single year.
Reproducibility. The full dataset, including every plotted value, the unemployment rate at each point, the two context years, and the FRED series identifiers, is available below as CSV. The chart is generated with Python (matplotlib).
Frequently asked questions
Why measure the deficit at the unemployment low rather than every year?
Because the question is about the structural deficit — the part that is not explained by the business cycle. At a cycle low the cyclical component is near zero, so the observed deficit is the closest simple approximation of the structural deficit. A deficit that no longer closes at full employment is exactly what the pillar on debt sustainability and systemic fragilities takes as its subject. Plotting every year would mix in the large cyclical deficits of recession years and obscure the comparison.
Why does the series end at 2023 and not 2025 or 2026?
2023 is the unemployment low of the current expansion (3.4% in April 2023). Unemployment has since risen to about 4.2%, so 2024 through 2026 are no longer full-employment lows. Their deficits (6.2% of GDP in 2024, 5.8% in 2025) are shown as context, not as comparable points.
Isn’t this just because of higher interest rates or an older population?
Those are among the leading candidate explanations, and they are exactly what the “different regime” reading emphasizes: a larger share of spending is now mandatory (Social Security, Medicare) or non-discretionary (net interest), and demographics raise benefit outlays regardless of the labor market. The chart is consistent with that explanation. It does not, on its own, quantify how much of the change each factor accounts for.
Does this favor one political party?
No. The two full-employment surpluses (1969, 2000) and the two widest full-employment deficits (2019, 2023) each span both parties. The pattern is bipartisan in the sense that no single administration or party is responsible for it.
Download the complete dataset
Every plotted value, the unemployment rate at each business-cycle low, the two context years, and the FRED series identifiers.
Source: eco3min.fr — BLS unemployment (UNRATE), OMB deficit/GDP via FRED. Free to use with attribution.
Conclusion
At the unemployment low of each U.S. business-cycle expansion since the 1960s, the federal budget was close to balance and twice in surplus — until the two most recent cycles. In 2019 and 2023, at unemployment rates as low as or lower than in the surplus years, the deficit ran between 4.6% and 6.1% of GDP, and it has stayed near that level as the labor market has since loosened. Whether that reflects a structural break in how the budget responds to the cycle, or simply a different fiscal structure that makes cross-era deficit comparisons misleading, is the open question — and the data here are consistent with both.
The data and analysis on this page are provided for informational and educational purposes only. They do not constitute investment advice or a recommendation to take any specific action. Eco3min is registered with the AMF as a non-prescriptive financial information publisher.
Last updated — 22 July 2026
Disclaimer – Financial Information: The analyses, commentary, and content published on eco3min.fr are provided for informational and educational purposes only. They do not constitute investment advice or a solicitation to buy or sell financial instruments. Past performance is not indicative of future results. All investment decisions involve risk and are the sole responsibility of the reader.