
US Federal Deficits Above 5% of GDP at Full Employment (1929–2025)
Eco3min Research · Fiscal Policy
A large deficit used to mean one of two things: a war, or a recession. Since 2022 the US has run one at full employment.
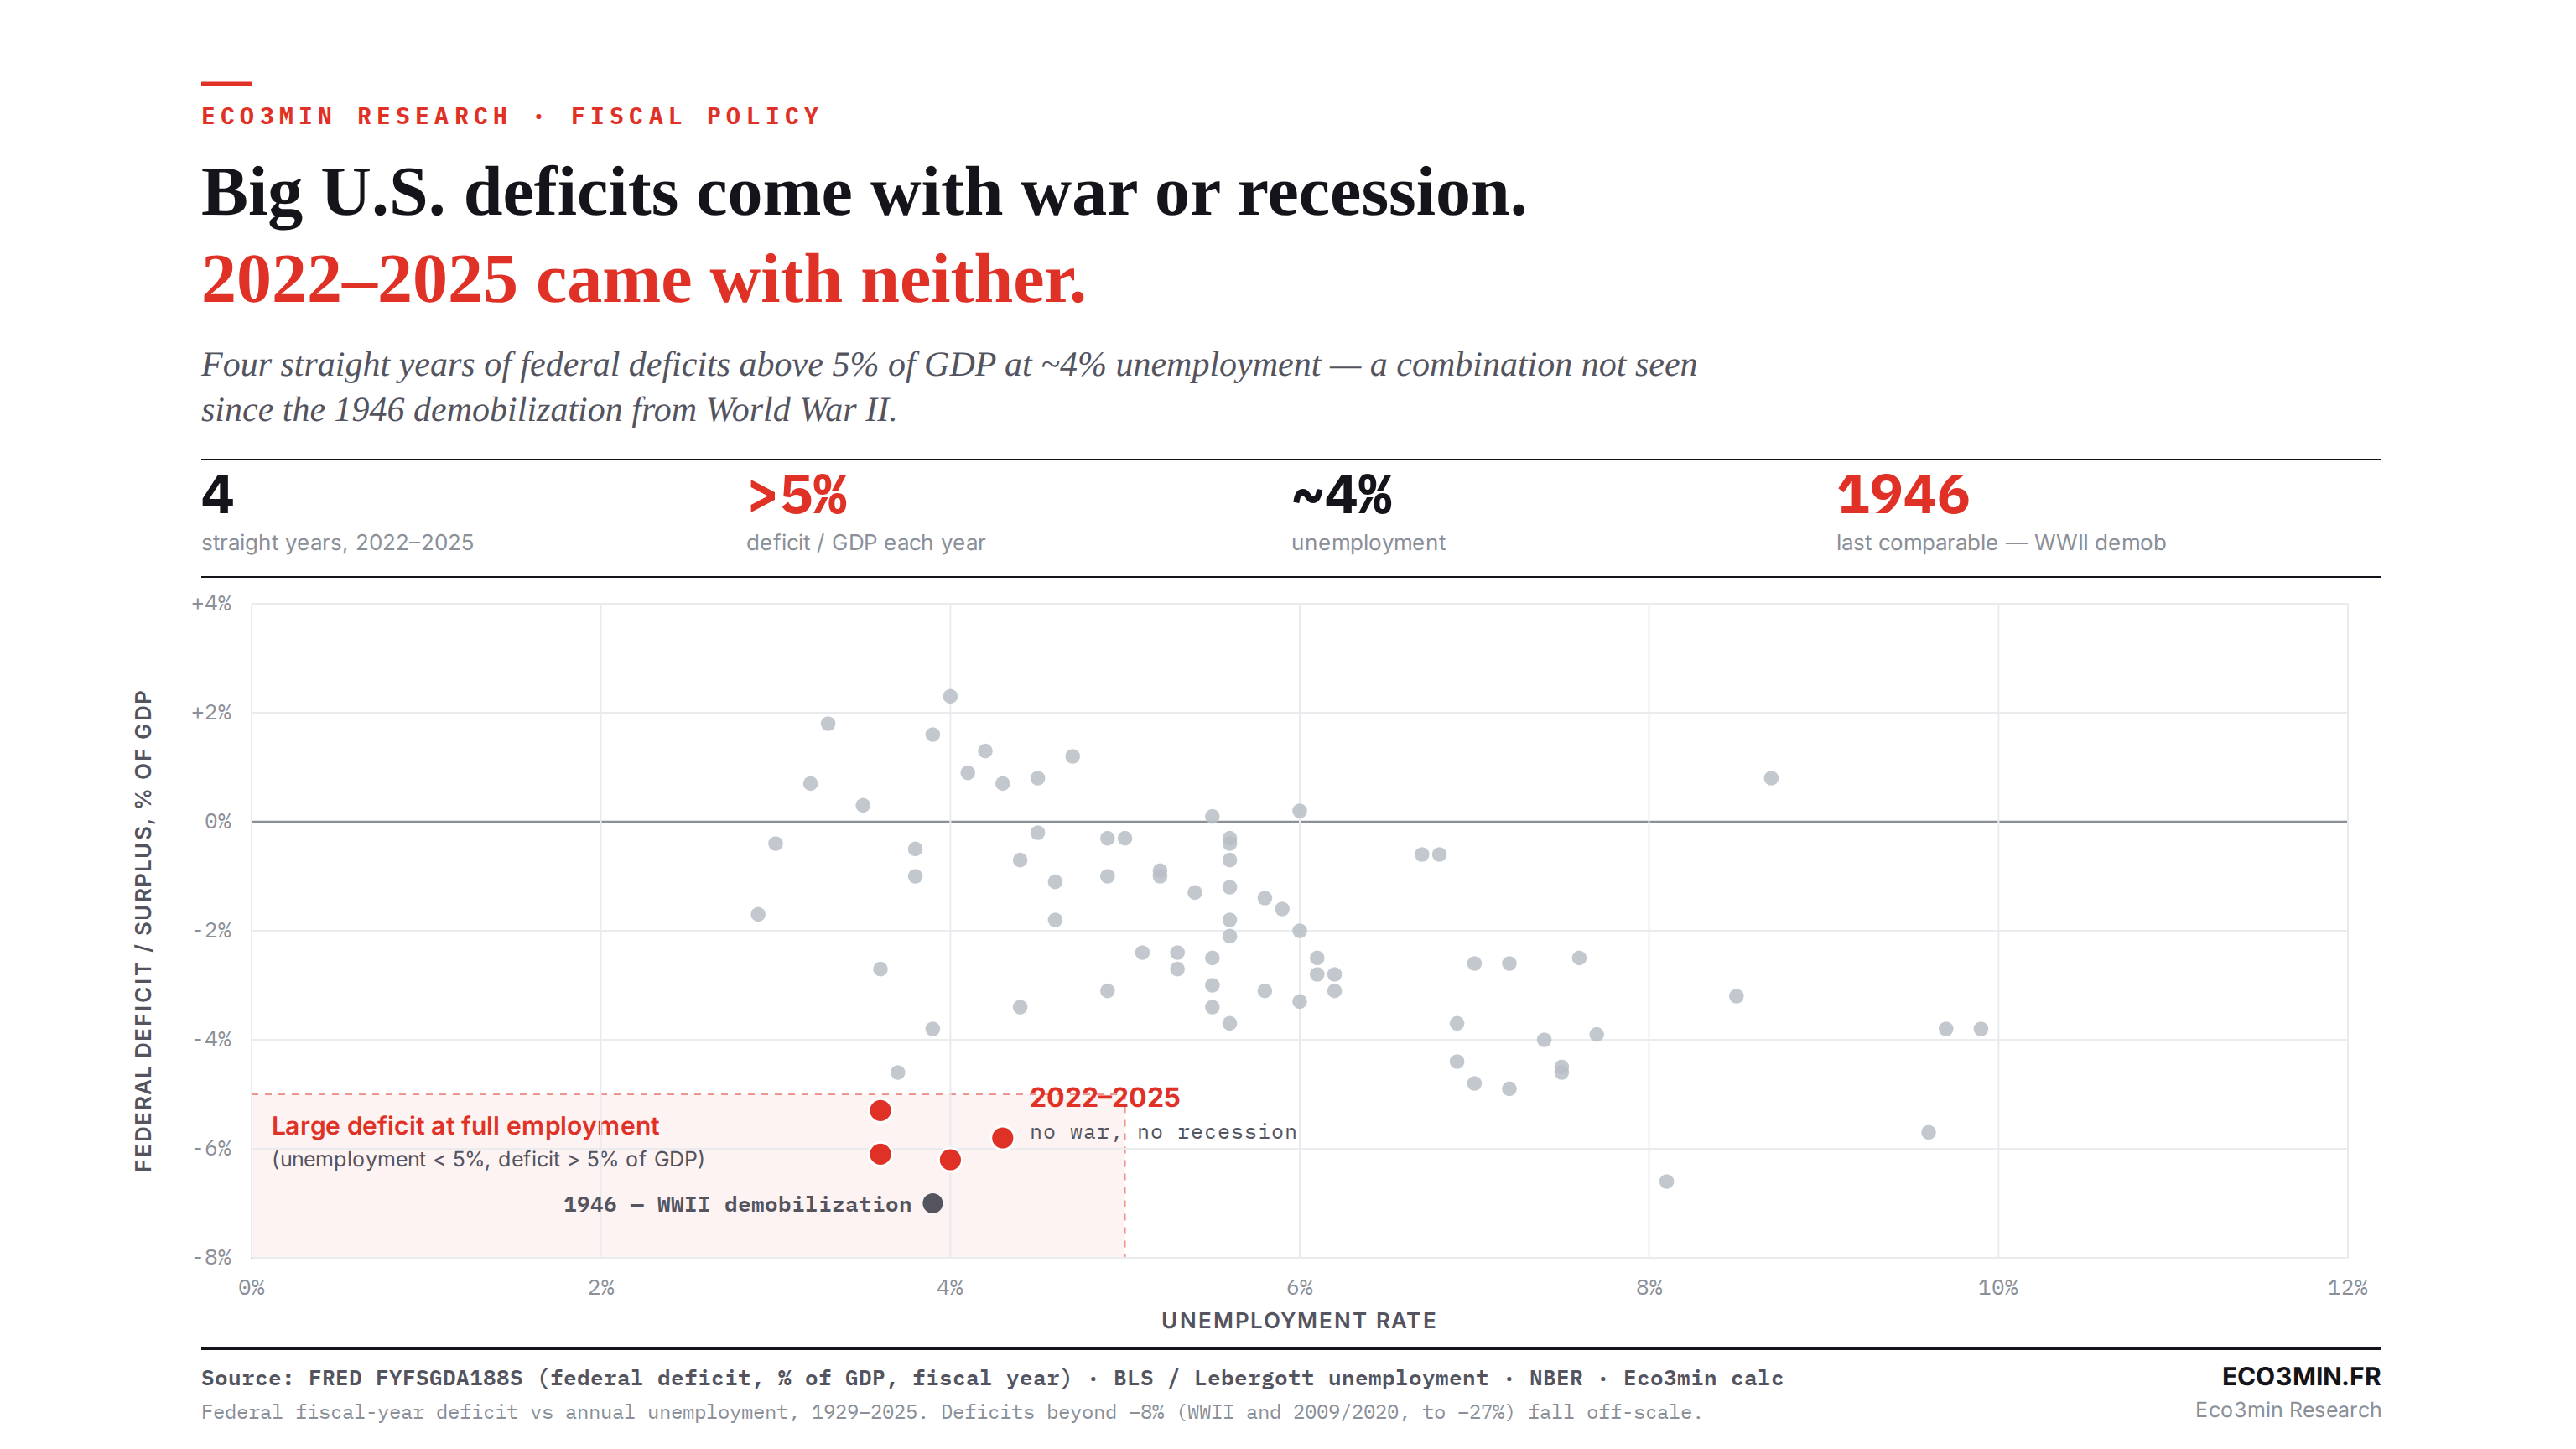
For most of the past century, a US federal deficit above 5% of GDP appeared only in two circumstances: a major war, or a recession. The mechanism is the same one that makes the deficit a poor stand-alone gauge of policy — in a downturn, tax revenue falls and safety-net spending rises automatically, so the deficit widens on its own. At full employment, revenue is strong and those stabilizers are quiet, so deficits are usually small.
That regularity broke after 2022. The federal deficit has run above 5% of GDP for four straight fiscal years — 2022 through 2025 — while unemployment held near 4%. No war, no recession. The only earlier time the US ran a deficit this large with unemployment this low was 1946, demobilizing from World War II. This page compiles every year since 1929 in which the deficit exceeded 5% of GDP at sub-5% unemployment, the full deficit-versus-unemployment record, and what the recent stretch does and does not imply.
Since 1947, every US federal deficit above 5% of GDP came with unemployment above 5% — a recession — until 2022. The deficit has now run above 5% of GDP for four straight years (2022–2025) at roughly 4% unemployment. The only earlier full-employment deficit that large was 1946, demobilizing from WWII (−7.0% of GDP at 3.9% unemployment). This is a descriptive statistical fact, not a judgment that the deficit is unsustainable.
01Large deficits used to require a war or a recession
The common framing treats the current deficit as simply “large.” The more precise fact is about the company it keeps. Precision starts one level below the headline: whether the figure quoted includes the interest bill at all, which is the point of the distinction economists draw between primary and overall balances. Run through the full record since 1929 and a deficit above 5% of GDP shows up in only two settings: the World War II years and their immediate aftermath, and recessions — 1983 in the wake of the early-1980s downturn, the 2009–2012 stretch after the financial crisis, and 2020–2021 during the pandemic. In every one of those recession cases, unemployment stood above 5% when the deficit was that wide. Further detail: our reference page on debt sustainability, shadow banking and systemic fragilities.
That is not a coincidence; it is how the budget works. Most of the deficit’s cyclical movement is automatic. When output falls, income and payrolls shrink, so tax receipts drop, while spending on unemployment insurance and income support rises — both widen the deficit without any new legislation. When the economy is at full employment, the same machinery runs in reverse: revenue is strong, stabilizer outlays are low, and the deficit tends to be small. A large deficit at full employment therefore reflects discretionary choices on taxes and spending, not the cycle. Related work: the postwar US recession record.
Automatic stabilizers tie the deficit to the labor market: it is engineered to widen when unemployment is high and to narrow when it is low. That linkage is inventoried point by point in the federal deficit at each business-cycle low in unemployment. A deficit that stays above 5% of GDP while unemployment sits near 4% runs against that built-in relationship — which is exactly what makes the 2022–2025 stretch stand out against a century of data.
02Every year since 1929 with a large full-employment deficit
The table lists every year since 1929 in which the federal deficit exceeded 5% of GDP and unemployment was below 5%. Outside the four recent years, every entry is a war year or its demobilization.
| Year | Deficit, % of GDP | Unemployment | Context |
|---|---|---|---|
| 1942 | −12.4 | 4.7% | World War II |
| 1943 | −26.9 | 1.9% | World War II |
| 1944 | −21.2 | 1.2% | World War II |
| 1945 | −20.9 | 1.9% | World War II |
| 1946 | −7.0 | 3.9% | WWII demobilization |
| 2022 | −5.3 | 3.6% | No war, no recession |
| 2023 | −6.1 | 3.6% | No war, no recession |
| 2024 | −6.2 | 4.0% | No war, no recession |
| 2025 | −5.8 | 4.3% | No war, no recession |
Federal fiscal-year deficit as a share of GDP (FRED FYFSGDA188S) matched to the annual unemployment rate. Between 1947 and 2021, every deficit above 5% of GDP — 1983, 2009–2012, 2020–2021 — came with unemployment above 5% and is therefore excluded here. 2025 is a fiscal-year figure; the unemployment rate is the calendar-year average. Source: FRED, BLS, NBER.
Seen as a scatter, the pattern is sharper. Plot every year’s deficit against its unemployment rate and the region of “large deficit, low unemployment” is empty across the whole record — except for the recent cluster and 1946.
Each dot is one year. Shaded zone = deficit above 5% of GDP at unemployment below 5%. Axis capped at −8%; WWII (to −27%) and the deepest recession deficits (2009, 2020) fall off-scale and are reachable via the buttons.
- Between 1947 and 2021, every federal deficit above 5% of GDP — 1983, 2009–2012, 2020–2021 — came with unemployment above 5%.
- 2022–2025 is the first stretch since 1946 to pair a deficit above 5% of GDP with unemployment below 5%, and the first ever outside war or its immediate aftermath.
- 1946 (−7.0% of GDP at 3.9% unemployment) is the only year on record with a larger full-employment deficit than 2024 (−6.2%).
03The 1946 precedent — and why it is the right comparison
1946 is the single historical analog, and naming it matters more than ignoring it. The fiscal year ran from July 1945 to June 1946, straddling the end of the war: spending was still enormous as the country demobilized, while unemployment had already fallen back to 3.9% as the economy reabsorbed returning workers. The result was a −7.0% deficit at full employment — larger, as a share of GDP, than any of the 2022–2025 figures. By 1947 the budget had swung to surplus. What was bought with that deficit — demobilisation and reconstruction — differs in kind from current outlays, a distinction that belongs to the effect of spending composition on output.
So the honest statement is not that 2022–2025 is unprecedented. It is that the only precedent is the unwinding of the largest war in US history. Every other large deficit since then has come attached to a recession. That is what makes the recent stretch unusual: a deficit at war-and-demobilization scale, sustained for four years, with neither a war nor a downturn to account for it. A fiscal stance of that kind is part of what defines a regime rather than a cycle, which places the episode on the terrain of the grid of macro-financial regimes since the Great Moderation.
04What this does — and does not — establish
This is a statement about a statistical regularity, not about whether the deficit is too large. A deficit at full employment is unusual by the historical pattern; it is not, on its own, evidence of imminent trouble. Whether it matters depends on questions this chart does not answer: the path of the debt-to-GDP ratio, the interest bill relative to GDP, and the inflation environment. The same three variables separate a deficit that persists from one that compounds, the distinction at issue in the persistence of deficits in advanced economies. Economists genuinely disagree on how much weight to put on the level of the deficit at full employment, and that disagreement is not resolved by the fact that the configuration is rare. Eco3min compiles the corresponding figures in our interest payments-to-GDP dataset (1947–2026).
Two qualifications cut against over-reading the chart. First, “full employment” is itself a judgment: 4% unemployment is near common estimates of the natural rate, but the rate drifted up from 3.4% in 2023 to 4.3% in 2025, so the labor market was loosening across the window. Second, the cutoffs are choices — a deficit above 5% of GDP and unemployment below 5%. Move the deficit line to 4% and 2019 (−4.6% at 3.7%) joins the recent group; the underlying fact is robust to reasonable thresholds, but the exact membership of the list is not a law of nature. The criterion here is explicit and falsifiable: if a future year runs a large deficit at full employment for reasons the cycle explains, it belongs in the same table. Related material: the collapse of US investment-income.
05Methodology & data
The deficit series is the federal surplus or deficit as a percent of GDP (FRED FYFSGDA188S), an annual fiscal-year series beginning in 1929. The unemployment rate is the BLS civilian unemployment rate (annual average) from 1948; before 1948 it is the standard historical reconstruction (Lebergott / Historical Statistics of the United States). A “large full-employment deficit” is defined here as a deficit greater than 5% of GDP with an unemployment rate below 5% in the same year. War and recession years are classified using NBER business-cycle dates and the dates of US involvement in World War II. All figures are computed by Eco3min from the public series; the fiscal-year deficit is matched to the calendar-year unemployment average, an approximation that has no effect on which years clear the thresholds. A related perspective: The crossover of debt interest over defense.
| Series | Source | Coverage | Latest |
|---|---|---|---|
| Federal deficit, % of GDP | FRED · FYFSGDA188S | 1929–2025 | −5.8 |
| Unemployment rate | BLS (UNRATE); Lebergott pre-1948 | 1929–2025 | 4.3% |
| Recession & war dates | NBER | 1857–2025 | — |
import pandas as pd

# Federal deficit as % of GDP, straight from FRED — no API key
url = "https://fred.stlouisfed.org/graph/fredgraph.csv?id=FYFSGDA188S"
d = pd.read_csv(url, parse_dates=["observation_date"])
d.columns = ["date", "deficit"]
d["year"] = d["date"].dt.year

# Unemployment (annual average), then join
u = pd.read_csv("https://fred.stlouisfed.org/graph/fredgraph.csv?id=UNRATE",
                parse_dates=["observation_date"])
u["year"] = u["observation_date"].dt.year
u = u.groupby("year")["UNRATE"].mean()

m = d.set_index("year").join(u)
# Large full-employment deficits: >5% of GDP at <5% unemployment
print(m[(m.deficit < -5) & (m.UNRATE < 5)])06Data & reproducibility
The full annual series — deficit as a share of GDP, unemployment rate, and a war/recession/peacetime classification for every year from 1929 to 2025 — is available in open format.
License: Creative Commons Attribution 4.0 (CC BY 4.0). Free for research, academic and journalistic use with attribution.
07Questions & answers
Have US deficits ever been this large at full employment before?
Isn’t a large deficit at full employment automatically a problem?
Why don’t large deficits usually happen at full employment?
Is 4% unemployment really “full employment”?
What about 2019?
How is this measured?
08Sources & limitations
- PrimaryFRED (Federal Reserve) — Federal Surplus or Deficit [-] as Percent of GDP (FYFSGDA188S), 1929–present.
- PrimaryBLS — Civilian unemployment rate (UNRATE), 1948–present; Lebergott / Historical Statistics of the United States before 1948.
- PrimaryNBER — US business cycle expansions and contractions.
- This is a descriptive observation, not a judgment of sustainability. A rare configuration is not, by itself, evidence that the deficit is too large or that a problem is imminent.
- “Full employment” is a judgment. The 5% unemployment cutoff is explicit but the natural rate is debated, and unemployment rose from 3.4% to 4.3% across 2023–2025.
- Thresholds change the exact list. A 4%-of-GDP deficit line adds 2019; the qualitative pattern is robust, the precise membership is a definitional choice.
- Pre-1948 unemployment is reconstructed and fiscal-year deficits are matched to calendar-year unemployment — neither affects which years clear the thresholds, but both are approximations.
Last updated — 15 September 2026
Disclaimer – Financial Information: The analyses, commentary, and content published on eco3min.fr are provided for informational and educational purposes only. They do not constitute investment advice or a solicitation to buy or sell financial instruments. Past performance is not indicative of future results. All investment decisions involve risk and are the sole responsibility of the reader.