
How fast US prices moved, relative to inflation
How fast US prices moved, relative to inflation
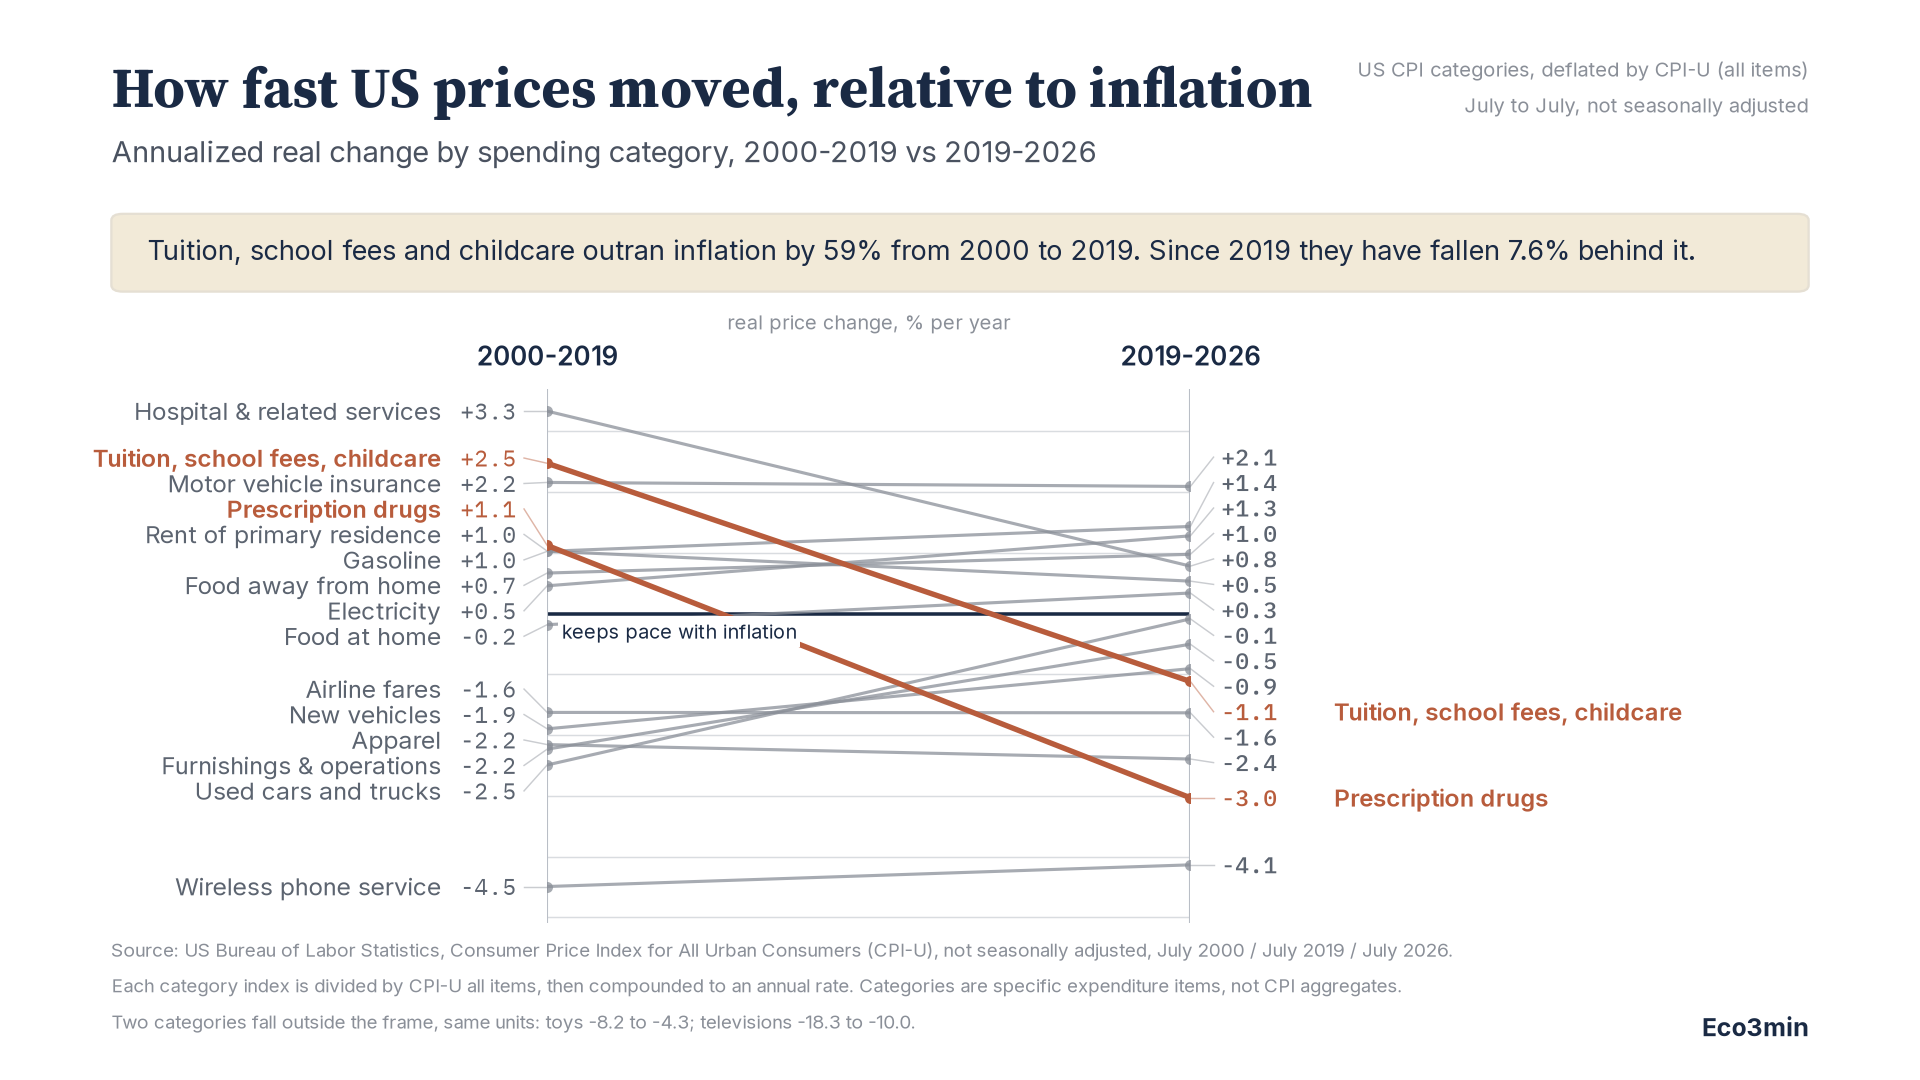
Each line connects one spending category’s price change over 2000–2019 to its change over 2019–2026. Categories that outran inflation in the first era and fell behind it in the second are highlighted.
Source: US Bureau of Labor Statistics, Consumer Price Index for All Urban Consumers (CPI-U), not seasonally adjusted. Anchors: July 2000, July 2019, July 2026. Real series are divided by CPI-U all items.
TL;DR
Between July 2000 and July 2019, tuition, other school fees and childcare rose 59.1% faster than US consumer prices as a whole. Between July 2019 and July 2026, the same category fell 7.6% behind them. Of the seventeen CPI spending categories examined here, only two crossed that line from above to below: education-and-childcare, and prescription drugs. The dollar prices did not fall. Tuition and fees still rose 20.3% in cash terms over the second period. What changed is that overall inflation ran faster. Faster overall inflation is what a regime change looks like from inside a price index, seen against the panorama of macro-financial regimes since the Great Moderation.
The two categories most often cited as evidence of runaway American cost growth (college and childcare, and prescription medication) stopped outrunning inflation after 2019, and are now falling behind it. This page documents the change using the Bureau of Labor Statistics Consumer Price Index, comparing each category’s price path over a nineteen-year period (July 2000 to July 2019) with its path over the seven years since (July 2019 to July 2026), in both nominal and inflation-adjusted terms. The full dataset is available for download.
The claim established by the data is narrow and worth stating precisely. It is not that education or medicine became affordable. It is that the relative price of these categories, meaning their cost measured against everything else a US household buys, reversed direction after two decades of moving one way. Relative price and affordability are different quantities, and the section below on what this chart does not measure sets out why.
Key Findings at a Glance
Source: BLS Consumer Price Index for All Urban Consumers (CPI-U), not seasonally adjusted
Anchors: July 2000, July 2019, July 2026 (latest available month)
Categories covered: 17 specific CPI expenditure items, no aggregates
Overall CPI-U: +48.5% over 2000–2019 (2.10% per year), +30.1% over 2019–2026 (3.84% per year)
Tuition, other school fees, and childcare, real: +59.1% then −7.6%
Tuition, other school fees, and childcare, nominal: +136.2% then +20.3%
Prescription drugs, real: +23.6% then −19.4%
Hospital and related services, real: +86.4% then +5.6%
Motor vehicle insurance, real: +50.0% then +15.6% (the one fast riser that did not decelerate)
Categories above inflation: 8 of 17 in the first period, 7 of 17 in the second
Categories crossing from above inflation to below: 2 of 17
Dispersion of annualized real rates: standard deviation 4.97 points, then 2.88 points
What the chart measures
Each of the seventeen lines is one CPI expenditure category. The left-hand value is that category’s compound annual price change over July 2000 to July 2019, after dividing its index by the all-items CPI-U. The right-hand value is the same calculation over July 2019 to July 2026. A value of zero means the category kept exact pace with overall consumer inflation. A positive value means it grew more expensive relative to everything else; a negative value means it grew cheaper relative to everything else.
The break point is July 2019 rather than 2020 deliberately. Anchoring on 2020 would place the base of the second period inside the pandemic price collapse, which distorted gasoline, apparel and airline fares in particular, and would manufacture apparent acceleration in exactly those categories. A pre-pandemic anchor removes that artefact. The cost is that the second period is seven years long against nineteen for the first, which is discussed under limitations below.
The two categories that crossed
Tuition, other school fees, and childcare is the category that carried two decades of American cost-growth commentary. Its CPI index stood at 321.7 in July 2000 and 760.0 in July 2019: a nominal rise of 136.2% against 48.5% for consumer prices overall, which works out to 59.1% of real, relative price growth, or 2.47% per year compounded.
Since July 2019 the index has reached 914.2. In cash terms that is still a rise, of 20.3%. But all-items CPI-U rose 30.1% over the same seven years, so in relative terms the category has given back 7.6%, at a compound rate of −1.12% per year. The swing between the two periods is 3.59 percentage points of annual real growth.
Prescription drugs moved further. The category ran 23.6% ahead of inflation over 2000–2019 (+1.12% per year), then fell 19.4% behind it over 2019–2026 (−3.03% per year), a swing of 4.15 points, the largest of any category in the set. Its nominal index rose only 4.9% across the entire seven-year period, against 30.1% for consumer prices.
These two are the only categories of the seventeen that cross the inflation line from above to below. Hospital and related services decelerated sharply, from +3.33% to +0.78% per year in real terms, but remained above the line. Motor vehicle insurance did not decelerate at all, holding +2.16% then +2.09% per year, and is the clearest counter-example in the dataset.
Two readings of the same data
The pattern admits two interpretations, and the dataset alone does not settle which carries more weight.
The first reading is that something real changed in these markets. The categories that reversed are the two where price-setting is least like an ordinary market: administered prices, third-party payers, subsidy structures and published list prices that few buyers actually pay. Independent evidence points the same way on the education side. The College Board’s Trends in College Pricing and Student Aid 2025 reports that average net tuition and fees paid by first-time, full-time, in-state students at public four-year institutions peaked in 2012–13 at $4,450 in 2025 dollars and is estimated at $2,300 for 2025–26. That series is built from what students pay after aid rather than from published prices, and it falls on its own terms. On the drug side, the mechanism usually cited is the expiry of patents on branded molecules and the resulting shift in the prescription mix toward generics. Under this reading the change is a change in the pricing regime itself, and would be expected to persist.
The second reading is that the comparison is doing the work. Two mechanical effects push in the same direction. First, the denominator moved: overall inflation ran at 3.84% per year in the second period against 2.10% in the first, so a category whose nominal growth merely stayed constant would show up as decelerating in real terms. Second, extremes in any distribution measured over a long window tend to look less extreme over a shorter one. Ten of the seventeen categories moved closer to zero between the two periods, and dispersion narrowed from a standard deviation of 4.97 points to 2.88 points, but seven categories moved further from zero, so this is not a uniform convergence, and the single largest move toward zero belongs to televisions, a quality-adjusted series whose measured decline is not a straightforward price observation.
The honest position is that both effects are present and the data here cannot apportion them. What the data does establish, and what neither reading disputes, is the sign change itself: two categories that spent nineteen years above the inflation line have spent the last seven below it.
What this chart does not measure
Relative price is not affordability. A household’s ability to pay for college or medication depends on its income, on the credit available to it, and on what it pays for everything else, none of which appear here. Tuition falling behind inflation while wages also fall behind inflation would leave affordability unchanged or worse. This chart holds a mirror only to the price of one category against the price of all categories.
Nor does it measure the level. Tuition, other school fees and childcare is 184% higher in nominal terms than in July 2000, and 47% higher relative to consumer prices. Seven years of falling slightly behind inflation returns a small fraction of that. The reversal is a change in direction, not a return to a previous level. Direction is exactly what a shift in inflation regimes and their structural drivers changes first.
The chart also says nothing about causes. It shows the coincidence in time between a change in relative price and a period of higher general inflation. Attributing the change to any particular policy, market structure or institutional shift is an inference the data on this page does not license.
Counter-arguments and limitations
The two periods are not the same length. Nineteen years against seven. Annualizing makes the rates comparable in units but not in reliability: a seven-year window is more exposed to where its endpoints happen to fall. Every figure on this page is reproducible from the downloadable dataset with different anchors.
Some series are quality-adjusted. Televisions, apparel, and new and used vehicles are quality-adjusted by BLS, meaning measured quality improvement is treated in part as a price decline. Their large negative values combine genuine price change with measured quality change and should not be read as pure price observations. The two reversing categories are services and medication, and are not adjusted in this way.
CPI categories are not household budgets. Each category is weighted in the overall index by its share of consumer spending, but this chart weights all seventeen equally on the page. A category can move sharply and matter little to the average household, or move slightly and matter a great deal.
The choice of categories is a choice. The seventeen are specific expenditure items rather than CPI aggregates, chosen to span everyday household spending. Including or excluding items changes the dispersion statistics quoted above, though not the two crossings, which are properties of those series alone.
Methodology and sources
All series are Consumer Price Index for All Urban Consumers (CPI-U), US city average, not seasonally adjusted, published by the US Bureau of Labor Statistics. Series identifiers appear in the downloadable dataset alongside every value used. Not-seasonally-adjusted data is appropriate here because all comparisons are July-to-July, which removes the seasonal component without adjustment.
The real index for a category is its CPI index divided by the all-items CPI-U index for the same month. Real change over a period is the ratio of real indexes at the two endpoints, minus one. The annualized figure is the compound annual rate implied by that ratio over 19 years for 2000–2019 and 7 years for 2019–2026. Category names are the official BLS item names; where the chart shortens a name for space, the dataset carries the full version.
Download the full dataset (CSV, CC-BY 4.0). It carries every index level, every nominal and real change, every series identifier and every source link.
Frequently Asked Questions
Did college get cheaper?
Not in dollars. The CPI category covering tuition, other school fees and childcare rose 20.3% in nominal terms between July 2019 and July 2026. It got cheaper only relative to everything else, because all-items consumer prices rose 30.1% over the same span.
Why start the second period in 2019 rather than 2020?
Because a 2020 anchor would sit inside the pandemic price collapse. Gasoline, apparel and airline fares were all sharply depressed in mid-2020, and using that as a base would manufacture apparent acceleration in those categories over the years that followed. July 2019 is the last clean pre-pandemic July.
Is this just an artefact of higher inflation after 2021?
Partly, and the article says so explicitly. Overall inflation ran at 3.84% per year in the second period against 2.10% in the first, which mechanically pushes every category’s real rate down. But that effect applies to all seventeen categories equally, and only two crossed from above the line to below it while seven moved further from zero. The faster denominator explains part of the movement, not the specific pattern of which categories moved.
Why is the television line so extreme?
Televisions are hedonically quality-adjusted in the CPI: when a set at the same price offers materially more capability, BLS records part of that as a price decline. The measured fall of 97.8% in real terms over 2000–2019 therefore combines genuine price change with measured quality improvement, and is not comparable to a service price. It is included for completeness and flagged as such in the dataset.
Does prescription drug CPI capture what people actually pay?
Partly. BLS prices prescriptions dispensed at retail, mail-order and internet pharmacies, and records the transaction price, meaning the negotiated amount net of discounts rather than a list price. But the figure it records is the total reimbursement to the pharmacy from the patient and all eligible payers combined, so it is not a measure of what a household pays out of pocket. An individual’s own experience depends on coverage and can diverge from the index in either direction.
Does the whole distribution of prices converge?
No, and the chart should not be read that way. Dispersion narrowed, from a standard deviation of 4.97 annualized points across the seventeen categories in the first period to 2.88 in the second, but ten categories moved toward zero while seven moved away from it. The reliable claim is about the two crossings, not about a general convergence.
Conclusion
For most of two decades, the shape of the American price story was consistent: services bought through institutions grew steadily more expensive relative to everything else, and manufactured goods grew steadily cheaper. Over the seven years since July 2019, two of the categories that carried that story most visibly (education with childcare, and prescription medication) have sat on the other side of the inflation line. Fifteen of the seventeen categories examined here did not cross it, and one of the fastest risers of the earlier period did not slow at all. Whether the reversal reflects a durable change in how these prices are set, or the arithmetic of comparing any period against an era of faster general inflation, is the question the next few years of data will answer.
Last updated — 18 September 2026
Disclaimer – Financial Information: The analyses, commentary, and content published on eco3min.fr are provided for informational and educational purposes only. They do not constitute investment advice or a solicitation to buy or sell financial instruments. Past performance is not indicative of future results. All investment decisions involve risk and are the sole responsibility of the reader.