
Equity Markets vs Real Economy: Earnings Cycles, Index Structure and Monetary Regimes
This page extends the analysis of the Equities & ETFs pillar. It formalizes the structural framework for equity market analysis, not the general mechanisms of price formation (covered in the Expectations sub-pillar of the Financial Markets pillar), but the specific relationship between equity markets, the earnings cycle, index composition and the real economy.
Equity markets arbitrate future scenarios within a given monetary regime: they do not comment on the observable economy. This single sentence captures the source of most misunderstandings about the stock market. When the S&P 500 gains 26% in 2023 (S&P Global) while the early-year consensus expects a recession, the casual observer concludes that markets are irrational. The analyst observes that markets had, correctly, anticipated that the recession would not materialize, and had begun pricing a soft landing as early as October 2022, well before consensus forecasts were revised.
The question structuring this sub-pillar is not “why is the stock market rising or falling?”; it is: what are the structural drivers of equity market performance, why does their trajectory diverge from the observable economy, and how does this divergence interact with the earnings cycle and the prevailing monetary regime?
The structural lag: equity markets as a leading indicator
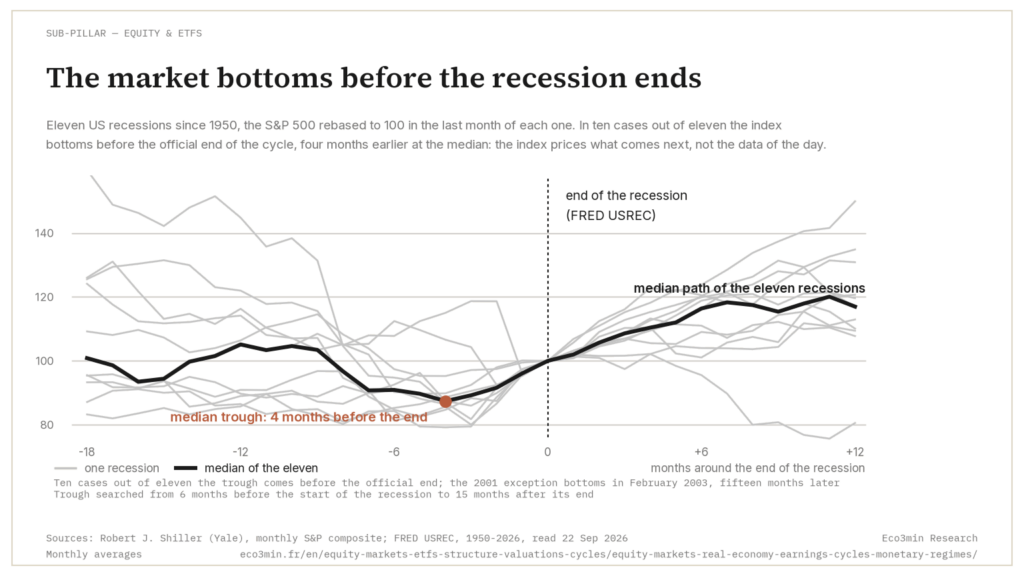
Equity markets do not measure the present state of the economy: they anticipate its future state. This temporal gap is empirically documented and remarkably stable. The S&P 500 is officially classified as a leading indicator by The Conference Board and is included in the US Leading Economic Index (LEI). On average, the S&P 500 has bottomed several months before the official end of recessions (NBER dating) and peaked several months before the start of recessions since 1950.
Recent examples confirm this regularity. In March 2009, the S&P 500 bottomed, before the NBER dated the end of the Great Recession in June 2009. In March 2020, the Covid low was reached while unemployment was about to surge to 14.7% (BLS): the market had already priced in massive monetary and fiscal intervention before its full announcement. In October 2022, the tightening-cycle low was reached well before consensus abandoned its recession forecast: the S&P anticipated the soft landing economists were not yet willing to price.
This lag creates a permanent paradox: equity markets systematically appear “ahead” of economic data. They rise during recessions (anticipating recovery) and correct during expansions (anticipating slowdown). The mistake is comparing index levels to contemporaneous data (GDP, employment, industrial production) when the index reflects future data discounted at the prevailing monetary regime’s rate.
The earnings cycle: the fundamental long-term driver
Over the long term, equity markets follow earnings. S&P 500 earnings per share (EPS) grew at an average annual rate of 6.8% between 1950 and 2024 (S&P Global, Shiller). Total S&P 500 return, dividends reinvested, reached 10.3% annually over the same period (Ibbotson/Morningstar). The difference is explained by dividends and, residually, multiple expansion. Over horizons of 10 years and more, earnings growth explains more than 80% of total equity return variation (Bernstein Research).
But over short and medium horizons, the earnings cycle is highly volatile. S&P 500 EPS fell sharply between the 2007 peak and the 2009 trough (FactSet): almost entirely concentrated in financials. EPS declined sharply between end-2019 and Q2 2020 (FactSet). They fell year-on-year in Q2 2023 (FactSet), an “earnings recession” that did not prevent the S&P from rising over the same period.
This last observation is crucial: equity markets do not react to the absolute level of earnings but to their expected trajectory. In 2023, the market looked through the earnings contraction because it anticipated, correctly, a return to EPS growth in H2 2023 and in 2024 (FactSet consensus). Earnings revision dynamics, the ratio of upward revisions to total revisions (Citi Earnings Revision Index), empirically provide a better predictor of 6-month equity performance than absolute results. When this ratio falls below 0.50, signaling that most analysts are revising downward, the probability of S&P 500 underperformance becomes high over the following six months (Citi Research). Earnings revisions as a false stability signal and earnings surprises in regime shifts are analyzed in our dedicated articles.
Index composition: why the stock market is not the economy
The divergence between equity markets and the real economy is not an anomaly: it is structural, explained by their radically different composition.
Weighted indices do not represent the economic fabric
The S&P 500 is capitalization-weighted. In 2024, the ten largest companies (Apple, Microsoft, Alphabet, Amazon, Nvidia, Meta, Broadcom, Tesla, Berkshire, JPMorgan) account for a very large share of the index’s total market capitalization (S&P Global). The Magnificent 7 alone account for a considerable share. These firms generate a disproportionate share of revenue internationally: Apple derives 60% of revenue outside the US (Apple 10-K), Nvidia 75% (Nvidia 10-K). Their performance reflects global technology and AI demand, not domestic US conditions.
Conversely, the US economy is dominated by services (78% of GDP, BEA), SMEs (47% of employment, SBA) and household consumption (68% of GDP, BEA). Reference release: the Bureau of Economic Analysis national accounts. These segments are not proportionally represented in indices. The Russell 2000, the small-cap index, underperformed the S&P 500 by more than 30 cumulative points between 2021 and 2024 (FTSE Russell), reflecting the reality of a pressured domestic economy while internationally diversified mega-caps prospered.
Listed company margins do not reflect the average economy
S&P 500 net margins reached a record in 2021 (FactSet), a level that would have seemed implausible two decades earlier. Margin expansion reflects the rise of technology (25–35% net margins for major tech platforms), digital scale effects, international tax optimization and share buybacks concentrating profitability among fewer shares. S&P 500 companies repurchased hundreds of billions of dollars of their own stock in 2023 (Goldman Sachs): a mechanical flow supporting prices and raising EPS without operational improvement.
This concentration of profitability among large listed firms coexists with a very different reality for SMEs and private companies. US corporate bankruptcies reached 642 in 2023: the highest since 2010 (S&P Global Market Intelligence). High-yield default rates have risen sharply from their very low levels of 2021-2022 (Moody’s). The “dual economy”, flourishing mega-caps alongside pressured productive fabric, is a structural feature of the current regime, not a temporary anomaly.
Concluding that “the stock market is disconnected from the real economy” because the S&P 500 rises while GDP growth slows. The S&P 500 is not the US economy: it is a weighted portfolio of the largest globally diversified companies listed in the US, whose earnings depend far more on global demand, the technology cycle and the cost of capital than on domestic GDP.
The monetary regime as the determinant of valuation multiples
If earnings are the long-term engine, the monetary regime determines the multiple markets are willing to pay for those earnings, and multiples, far more than earnings, drive short- and medium-term performance.
The mechanism is direct: the real rate sets the discount rate for future cash flows. When 10-year TIPS yield −1.19% (August 2021, Federal Reserve), distant cash flows are worth more in present value: multiples expand mechanically. The S&P 500 forward P/E reached 23x (FactSet). When 10-year TIPS rise to +2.40% (October 2023), the same flows are worth less: multiples compress (FactSet). The 360-basis-point swing in real rates between 2021 and 2023 largely explains multiple compression independently of earnings evolution.
Sensitivity to real rates is not uniform. “Long-duration” equities, whose cash flows lie far in the future (growth, unprofitable tech, pre-revenue biotech), are most sensitive to discount-rate changes, just like long-duration bonds. The Goldman Sachs Non-Profitable Technology Index fell 75% between February 2021 and December 2022 (Bloomberg), while firms with present and stable earnings (value, dividend, defensive) proved more resilient. In 2022, the S&P 500 Value outperformed the S&P 500 Growth by a wide margin (S&P Global): a historic gap directly reflecting the real-rate regime shift. The real-rates/valuation link is developed in the Monetary Policy & Rates pillar.
Three equity market regimes since 2009
The interaction between earnings, multiples and the monetary regime has produced three distinct equity market configurations since the 2008 crisis.
2009–2019: multiple-driven expansion
The S&P 500 rose sharply between March 2009 and end-2019 (S&P Global). Performance decomposition is revealing. Annualized earnings growth was well above its historical average (FactSet), driven by margin expansion, buybacks and technology. Forward P/E rose sharply, a multiple expansion explaining roughly half of total performance. In other words, half the rally reflected not fundamental improvement but the discount-rate decline produced by the zero-rate regime.
The most striking feature of this period was the absence of meaningful rotation. The growth factor outperformed value every year except 2016 (S&P Global). FAANG stocks sharply increased their share of S&P 500 capitalization between 2013 and 2019 (S&P Global). Concentration increased steadily: a logical process in a low-rate regime where long duration is mechanically favored. Favored on the way up, a long-duration tilt is what the record of the Nasdaq falling harder than the broad market in bear markets since 1971 puts to the test on the way down.
2020–2021: the speculative climax
Massive monetary and fiscal stimulus in 2020–2021 propelled equity markets into a historic episode of price-fundamental dislocation. The S&P 500 reached a new high a few months after the March 2020 trough, the fastest recovery on record, while unemployment still stood at 8.4% (BLS, Aug-2020). Forward P/E peaked at 23x in late 2021 (FactSet). The GS Non-Profitable Technology Index surged within a few months (Bloomberg). IPOs reached 1,035 in 2021 (Renaissance Capital), the highest since 2000.
This was not irrationality: it was the mechanical consequence of a regime where the cost of capital was near zero. With TIPS at −1.19%, any asset promising future growth, however distant or uncertain, received a high valuation under discounted cash flow logic. Individually rational decisions, investing in positive-return assets when cash yields negative real returns, produced a collectively unsustainable outcome. The conditions enabling this regime vanished in 2022.
2022–?: the return of discrimination
The 2022–2023 tightening restored the fundamental mechanism neutralized by the prior regime: discrimination by cost of capital. When real rates are positive and cash yields 5%, capital is no longer forced into risky assets: it moves only when expected return justifies risk. Consequences are measurable.
Performance dispersion among S&P 500 constituents reached historic levels. In 2023, the Magnificent 7 rose far more on average than the S&P 493 (Goldman Sachs). The gap between cap-weighted and equal-weighted S&P 500 was exceptionally wide (S&P Global). The Russell 2000 underperformed: small caps, more leveraged and rate-sensitive, bore the brunt of the regime shift.
Sector rotation became a regime marker. In 2022, value clearly outperformed growth (S&P Global). In 2023–2024, performance concentrated around AI: Nvidia rose 239% in 2023 and rose sharply again in 2024 (Nasdaq), creating an ultra-concentrated engine masking stagnation elsewhere. The share of S&P 500 stocks beating the index fell to a very low level in 2023 (S&P Global), signaling that index gains reflected exceptional performance by a narrow group rather than broad fundamental improvement.
Five mechanisms behind equity–real economy divergence
Divergence between equity markets and the real economy is the norm, not the exception. It stems from five structural mechanisms that can be formalized.
Temporal lag. Markets anticipate the cycle several months ahead. They rise during recessions (anticipating recovery) and correct during expansions (anticipating slowdown). Comparing index levels with contemporaneous economic data is systematically misleading.
Index composition. The S&P 500 is not the US economy: it is a portfolio of 500 globally diversified large companies whose earnings depend more on global demand, the technology cycle and capital costs than on domestic GDP.
Survivorship bias. Indices constantly renew: failing firms are replaced by growing ones. The S&P 500 renews part of its constituents annually (S&P Dow Jones Indices). Over the long run, a large share of its members change. The index does not measure economic performance: it measures successive winners. The corresponding analytical frame is set out in our study on why Index Stability Can Mask Growing Risk.
Share buybacks. S&P 500 buybacks, hundreds of billions of dollars annually (Goldman Sachs), reduce shares outstanding, mechanically raising EPS without operational improvement. This flow supports prices independently of fundamentals. Between 2012 and 2024, net buybacks accounted for more than half of net inflows into US equities (Fed Flow of Funds).
Discount-rate effect. Markets do not value present earnings: they value future earnings discounted at the real rate. A 100-bp decline in the 10-year real rate mechanically raises the present value of a 10-year cash flow by 10–15%. This mechanism allows markets to rise while earnings stagnate or fall simply because rates decline, and vice versa. A deeper analysis appears in our reference article on structural divergence between equity markets and the real economy.
Equity markets do not comment on the present economy: they arbitrate future scenarios for earnings, rates and liquidity within a given monetary regime. Their trajectory structurally diverges from the observable economy for five formalizable reasons: anticipatory temporal lag, internationalized index composition, survivorship bias, the mechanical effect of share buybacks and sensitivity to discount rates. The monetary regime determines the multiple markets pay for earnings, and multiples, far more than earnings, drive short- and medium-term performance. In a negative real-rate regime, multiples expand and gains are broad-based. In a positive real-rate regime, multiples compress, dispersion rises and discrimination by cost of capital becomes dominant. The relevant diagnosis is not “is the market too high?” but “within which regime of real rates, earnings and concentration is the market operating, and what are its structural properties?”.
Further reading
Why equity markets can durably diverge from the real economy: The sub-pillar’s reference article detailing structural mechanisms of anticipation, temporality and index composition.
Earnings revisions as a false stability signal: How revision dynamics can mask underlying fragility.
Earnings surprises in regime shifts: Why reactions to results change with the monetary regime.
← Back to pillar page Equities & ETFs
Last updated — 25 September 2026
Disclaimer – Financial and Legal Information: The analyses, commentary, and content published on eco3min.fr are provided for informational and educational purposes only. They do not constitute investment advice or a solicitation to buy or sell financial instruments. Past performance is not indicative of future results. All investment decisions involve risk and are the sole responsibility of the reader. Data, charts and calculated series are provided as is and may contain errors or lag behind their source: check any figure against the primary source cited before relying on it. Content describing laws, regulations or contracts reflects the law as of its publication date and does not constitute legal or tax advice; applying it to a specific situation requires a qualified legal or tax professional.
Read next
Full pillar →Why Index Stability Can Mask Growing Risk
Equity index stability is not evidence of risk stability. Aggregation, internal dispersion and earnings revisions can quietly redistribute…
Equity Markets and the Economic Cycle: Stocks Call Recoveries Better Than Recessions
In each of the nine US recessions since 1960, the stock market bottomed before payrolls did; its top,…
Sector Rotation and Style Regimes: Value, Growth and Market Cycles
Sector rotation is not a prediction strategy: it is a reading of the market’s implicit arbitrages. When flows…