
Every US Dollar Bull and Bear Market Since 1973
Since the dollar began floating in 1973, its trade-weighted value has moved in long swings rather than a single direction. Each recurring forecast of a structural dollar decline has so far met the same counter-pattern: a cyclical low, then reversal.
This study dates every completed bull and bear phase in the Federal Reserve’s dollar index since the float, measures each one’s length and depth, and sets the 2025–26 weakness against that fifty-year record.
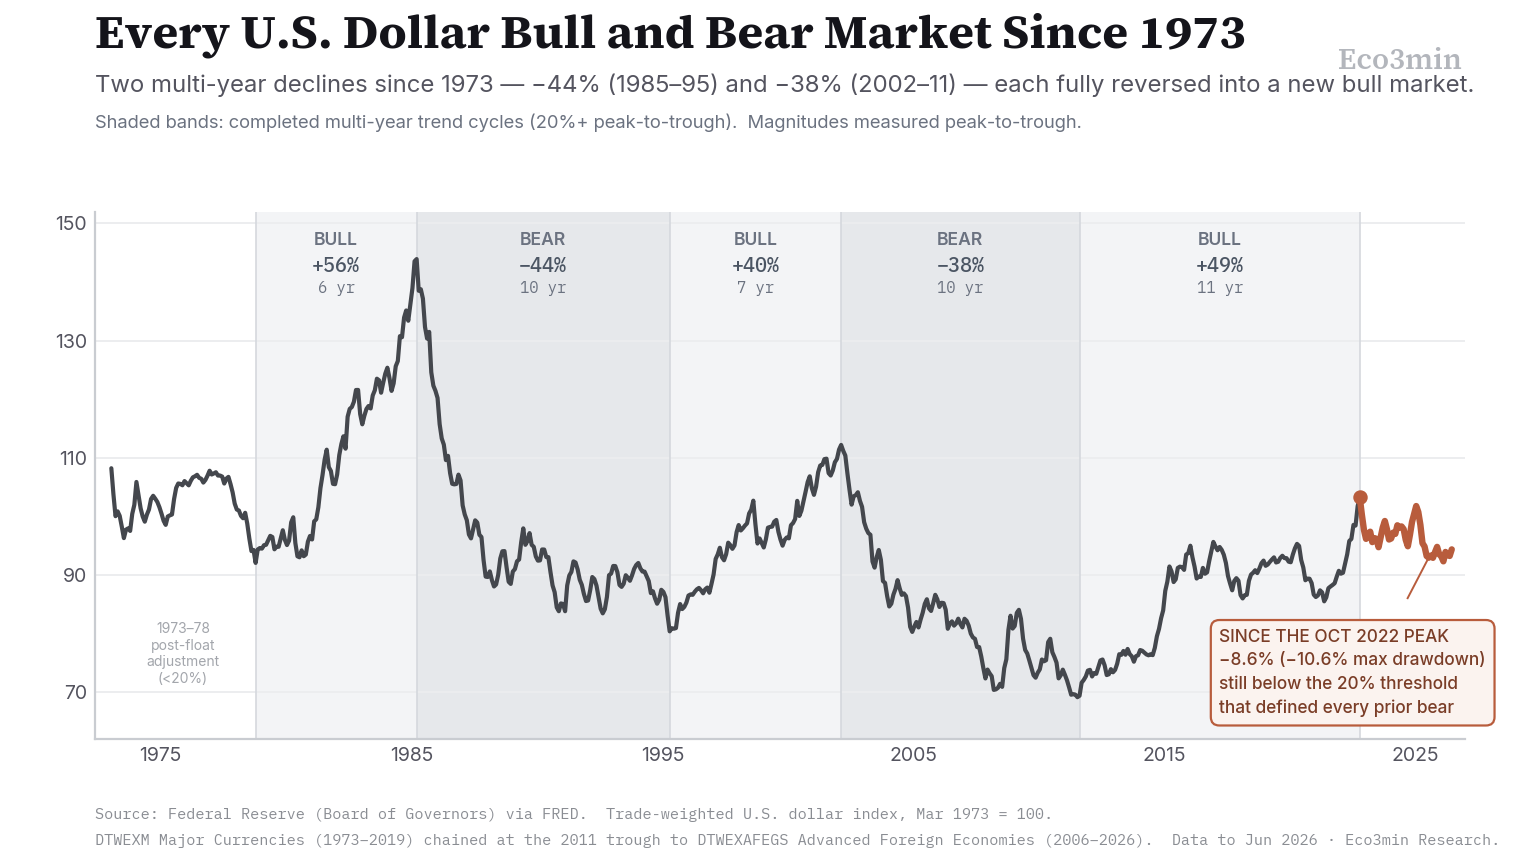
Both multi-year dollar declines since 1973, of −44% and −38%, fully reversed into new bull markets; the 2025–26 move is so far about a quarter of the average bear.
- Five completed trend cycles since the 1973 float (three bull, two bear), using a 20%-or-more peak-to-trough rule on the Federal Reserve’s trade-weighted index; the count is identical at a 25% threshold.
- Bull phases averaged about +48% over roughly eight years; bear phases about −41% over roughly ten. The sample is small: three bulls and two bears.
- From its October 2022 peak the dollar is down 8.6%, and was down 10.6% at its February 2026 low, short of the 20% that defined every prior bear (Federal Reserve via FRED, data to June 2026).
The case for a fading dollar is loud again. The currency weakened through 2025, central banks kept diversifying their reserves, and the familiar themes of sanctions, deficits and a multipolar trading system returned to the front pages. Yet the phrase “the dollar is declining” quietly bundles two different measurements: the dollar’s price, meaning its exchange value against other currencies, and its share of global official reserves. They move on different clocks.
This study is about the first. On the Federal Reserve’s trade-weighted index, the dollar has never fallen in one direction for long. It has alternated between multi-year bull and bear phases of broadly comparable size, and each of its two sustained declines has so far ended in a new bull market. The table below dates every completed cycle since 1973.
| Phase | Period | Duration | Move (peak‑to‑trough) | Conditions around the turn |
|---|---|---|---|---|
| Bull | Oct 1978 – Mar 1985 | 77 mo (~6 yr) | +56% | Volcker disinflation widened real-rate differentials; large fiscal deficits |
| Bear | Mar 1985 – Apr 1995 | 121 mo (~10 yr) | −44% | Real-rate gap narrowed; the September 1985 Plaza Accord followed the peak and accelerated the descent |
| Bull | Apr 1995 – Feb 2002 | 82 mo (~7 yr) | +40% | “Strong-dollar” policy stance; productivity boom and capital inflows |
| Bear | Feb 2002 – Aug 2011 | 114 mo (~10 yr) | −38% | Fed easing and twin deficits; the 2008 crisis spike was a counter-move inside the decline |
| Bull | Aug 2011 – Oct 2022 | 134 mo (~11 yr) | +49% | Federal Reserve tightening against ECB and Bank of Japan easing widened the rate gap |
| Current | Oct 2022 – Jun 2026 | 44 mo so far | −8.6% (−10.6% low) | Below the 20% threshold; not yet a confirmed bear cycle |
Phases are measured on monthly averages of the Federal Reserve’s trade-weighted index; magnitudes are peak-to-trough. Cycles through 2011 use the Major Currencies series; the 2011–2022 cycle and the current move use the Advanced Foreign Economies series, chained at the shared 2011 trough (see Methodology).
The recurring case for a structural decline
The strongest version of the de-dollarization argument does not rest on the exchange rate at all. It rests on reserves. The dollar’s share of allocated global foreign-exchange reserves has fallen from about 71% at the start of 1999 to 56.9% in the third quarter of 2025, according to the IMF’s Currency Composition of Official Foreign Exchange Reserves (COFER). Over the same span the euro settled near 20%, the “other currencies” bucket of Canadian and Australian dollars, the renminbi and the Korean won roughly doubled its share, and central banks, particularly in emerging markets, accumulated gold.
That trend is real and decades long, and it has an institutional logic: reserve managers diversify against concentration risk, and the use of financial sanctions has given some holders a reason to hold fewer dollar claims. When the exchange rate weakened through 2025, the two stories merged in commentary into a single narrative of waning dominance. The question this study can address is narrower and answerable: on the price side, is a multi-year dollar decline unusual, and how has it tended to end?
What fifty years of the price index show
Since the float, the dollar has completed five multi-year trend cycles: three bull phases and two bear phases. They are close to symmetric in scale. The three bull markets ran about eight years and averaged +48%; the two bear markets ran about ten years and averaged −41%. The longest single phase was the 2011–2022 bull at 134 months; the deepest was the post-Plaza decline of 1985–1995, which erased 44% of the index.
The pattern that matters for the de-dollarization debate is the ending. Both sustained declines reversed. The −44% bear of 1985–1995 gave way to the +40% bull of 1995–2002; the −38% bear of 2002–2011 gave way to the +49% bull that followed. On this index, across fifty years, the dollar has not entered a one-way secular slide. It has cycled.
The turns share a small family of conditions rather than one cause. Most coincided with a shift in real interest-rate differentials: the Volcker-era rate premium powered the early-1980s bull, and the gap between Federal Reserve tightening and ECB and Bank of Japan easing powered the 2014–2015 leg of the last one. One turn was a coordinated policy act, the September 1985 Plaza Accord, which came after the dollar had already peaked in early 1985 and accelerated a descent already underway. One was a crisis: the 2008 flight to safety produced a sharp dollar spike that, at a 20% threshold, registers as a counter-move within the larger 2002–2011 decline rather than a new bull. What none of the turns coincided with was a change in the dollar’s reserve status. The dataset records the dates; the association is left for the reader to weigh. For the broader picture: the precedents of Fed cuts into records.
On the Federal Reserve’s price index, every multi-year dollar decline since 1973 has reversed — a record about the exchange rate, not about reserve status.
The honest qualifications
A reversal record is not a forecast, and three caveats keep it from being one. The first is the one the table cannot show: price and reserve share are different series. The exchange-rate index measures what the dollar is worth; the COFER share measures how much of the world’s reserves sit in dollars. A price that cycles is entirely compatible with a reserve share that drifts lower over decades, and the latter has been doing exactly that.
Even that drift is noisier than the headline suggests. The IMF noted in October 2025 that exchange-rate movements, meaning non-dollar currencies appreciating in dollar terms rather than central banks selling dollars, accounted for roughly 92% of the share decline in the second quarter of 2025. Research published by CEPR in May 2026 makes the related point that the headline COFER number, dominated by a handful of large holders and by valuation effects, can overstate any change in how the dollar is actually viewed. The dollar still accounts for about 57% of allocated reserves, against the euro’s roughly 20%, and the Bank for International Settlements finds it on one side of close to 89% of global currency trades. On those measures its centrality is intact. Companion analysis: our breakdown of the U.S. dollar as a systemic variable in the global monetary system.
The second caveat is sample size. Five cycles in fifty years is a thin record, and two of them are bear markets; an “average bear of −41%” rests on two observations and should be read as description, not expectation. The third is partly definitional: a trough only counts as the end of a bear once a rise confirms it, so “every decline reversed” is built into the method. The content that is not circular is the scale of those reversals, full retracements into bull markets of +40% and +49%, and the simple fact that the price index has never trended one way across the half-century.
Two readings follow, and the data does not split them evenly. Some treat the 2025–26 move as the early sign of the dollar’s reserve role eroding structurally; others treat it as cyclical weakness in the mould of 1985 or 2002. On the price series, the evidence leans cyclical, because every multi-year decline has reversed. On the reserve-share series, there is a slow secular drift that this price index does not capture. The two camps are partly arguing about two different measurements.
Where the current move sits
Measured against that record, the 2025–26 weakness is, so far, modest. From its October 2022 peak the Federal Reserve’s advanced-economies index is down 8.6%, and was down 10.6% at its February 2026 low, roughly a quarter of the average historical bear and shorter than either of the two. The broad index, which includes China and other emerging markets, peaked later, in January 2025, and is down a similar single-digit amount. The more euro-weighted ICE Dollar Index, in which the euro alone carries about 58% of the basket, fell further, near 10% off its January 2025 high, which reflects its narrower composition rather than a different underlying signal.
By this study’s own rule, none of those moves yet qualifies as a new bear-market cycle. Whether the 2025–26 decline is the early down-leg of another multi-year cycle, like 1985 or 2002, or the start of a structural shift in the dollar’s global role, a price index cannot settle: the two questions track different series. A drawdown past 20% would be the historical marker that this move had joined the first group, and it has not reached it.
Methodology
A trend cycle is defined as a directional move of at least 20% from a major peak or trough, measured on monthly averages of the Federal Reserve’s trade-weighted dollar index, with counter-moves smaller than 20% not breaking the prevailing trend (a single-threshold swing rule). A twelve-month minimum excludes sub-annual blips, though it does not bind here: the shortest cycle retained is 76 months. The 20% threshold is the conventional bull-and-bear cutoff applied to the currency. The five-cycle count is identical at a 25% threshold; only at 15% does the 2008 crisis spike split the 2002–2011 bear into three legs, raising the count to seven. The result is therefore stable across the 20–25% range.
One series does not span the whole period. The Federal Reserve discontinued the long Major Currencies index (FRED series DTWEXM) in 2019, replacing it with the Advanced Foreign Economies index (DTWEXAFEGS), which begins in 2006. Measured by the FRED DTWEXBGS broad dollar index series. This study uses Major Currencies for the cycles through 2011 and Advanced Foreign Economies for the 2011–2022 cycle and the current move, chaining the two at the 2011 trough (August 2011). Over the 2006–2019 overlap the two indices move almost identically, with a correlation of 0.999 in monthly changes, and because the join falls on a cycle boundary, no cycle’s magnitude is measured across it. The broad index is not used for the chain, since it tracks the major and advanced series less closely: it includes the renminbi and other emerging-market currencies. The 1973–1978 post-float adjustment, about −15%, falls below the threshold and is not counted as a cycle. The dataset, one row per cycle, is available below, and every figure in this study is computed from it. Related coverage: the turn of the exorbitant privilege.
Frequently asked questions
How many bull and bear markets has the US dollar had since 1973?
Five completed multi-year trend cycles, three bull and two bear, on the Federal Reserve’s trade-weighted index, using a peak-to-trough rule of 20% or more. The count is the same at a 25% threshold; a looser 15% rule adds the 2008 crisis spike, for seven.
How long does a typical dollar cycle last?
Across the five since 1973, bull phases ran about eight years and bear phases about ten. The shortest was 77 months (the 1978–1985 bull) and the longest 134 months (the 2011–2022 bull). These are descriptive averages over a small sample, not a schedule.
Has the US dollar ever fallen in a straight line for good?
Not on the Federal Reserve’s price index since the 1973 float. The two multi-year declines, −44% in 1985–1995 and −38% in 2002–2011, each reversed into a new bull market of +40% and +49% respectively. The index has not trended one way across the half-century.
Is the dollar’s reserve-currency status declining?
The dollar’s share of allocated global reserves fell from about 71% in 1999 to 56.9% in the third quarter of 2025 (IMF COFER), a slow multi-decade drift. The IMF attributes much of the 2025 decline to exchange-rate effects rather than active selling. Reserve share is a separate measurement from the exchange-rate index this study tracks. Both, however, are read against the same backdrop, the long view of monetary regimes and liquidity cycles.
What turned each dollar cycle?
Each turn coincided with one of a few conditions: a shift in real interest-rate differentials, a coordinated intervention (the 1985 Plaza Accord), or a crisis flight to safety (2008), rather than a change in reserve status. The dataset records the dates of each turn; the association with these conditions is descriptive, not a causal claim.
Download the dataset: every US dollar cycle since 1973 (CSV)
License: CC BY 4.0
Related
- This study tracks multi-year trend cycles; for the dollar’s calendar-year seasonality, see the dollar’s weakest first halves since 1973.
- The same approach applied to bond markets: every Treasury yield-curve inversion since 1976.
- The dollar’s behaviour through past stress episodes: the dollar in global crises, 1973–2023.
- The policy rate behind the rate-differential story: a history of the federal funds rate.
- The real-rate gap that has marked several turns: US real interest rates over time.
Last updated — 15 September 2026
Disclaimer – Financial Information: The analyses, commentary, and content published on eco3min.fr are provided for informational and educational purposes only. They do not constitute investment advice or a solicitation to buy or sell financial instruments. Past performance is not indicative of future results. All investment decisions involve risk and are the sole responsibility of the reader.