
U.S. net investment income has fallen to near zero
Eco3min Research · Balance of Payments
The world’s largest net debtor long earned more on its foreign investments than it paid out. That surplus has fallen to near zero.
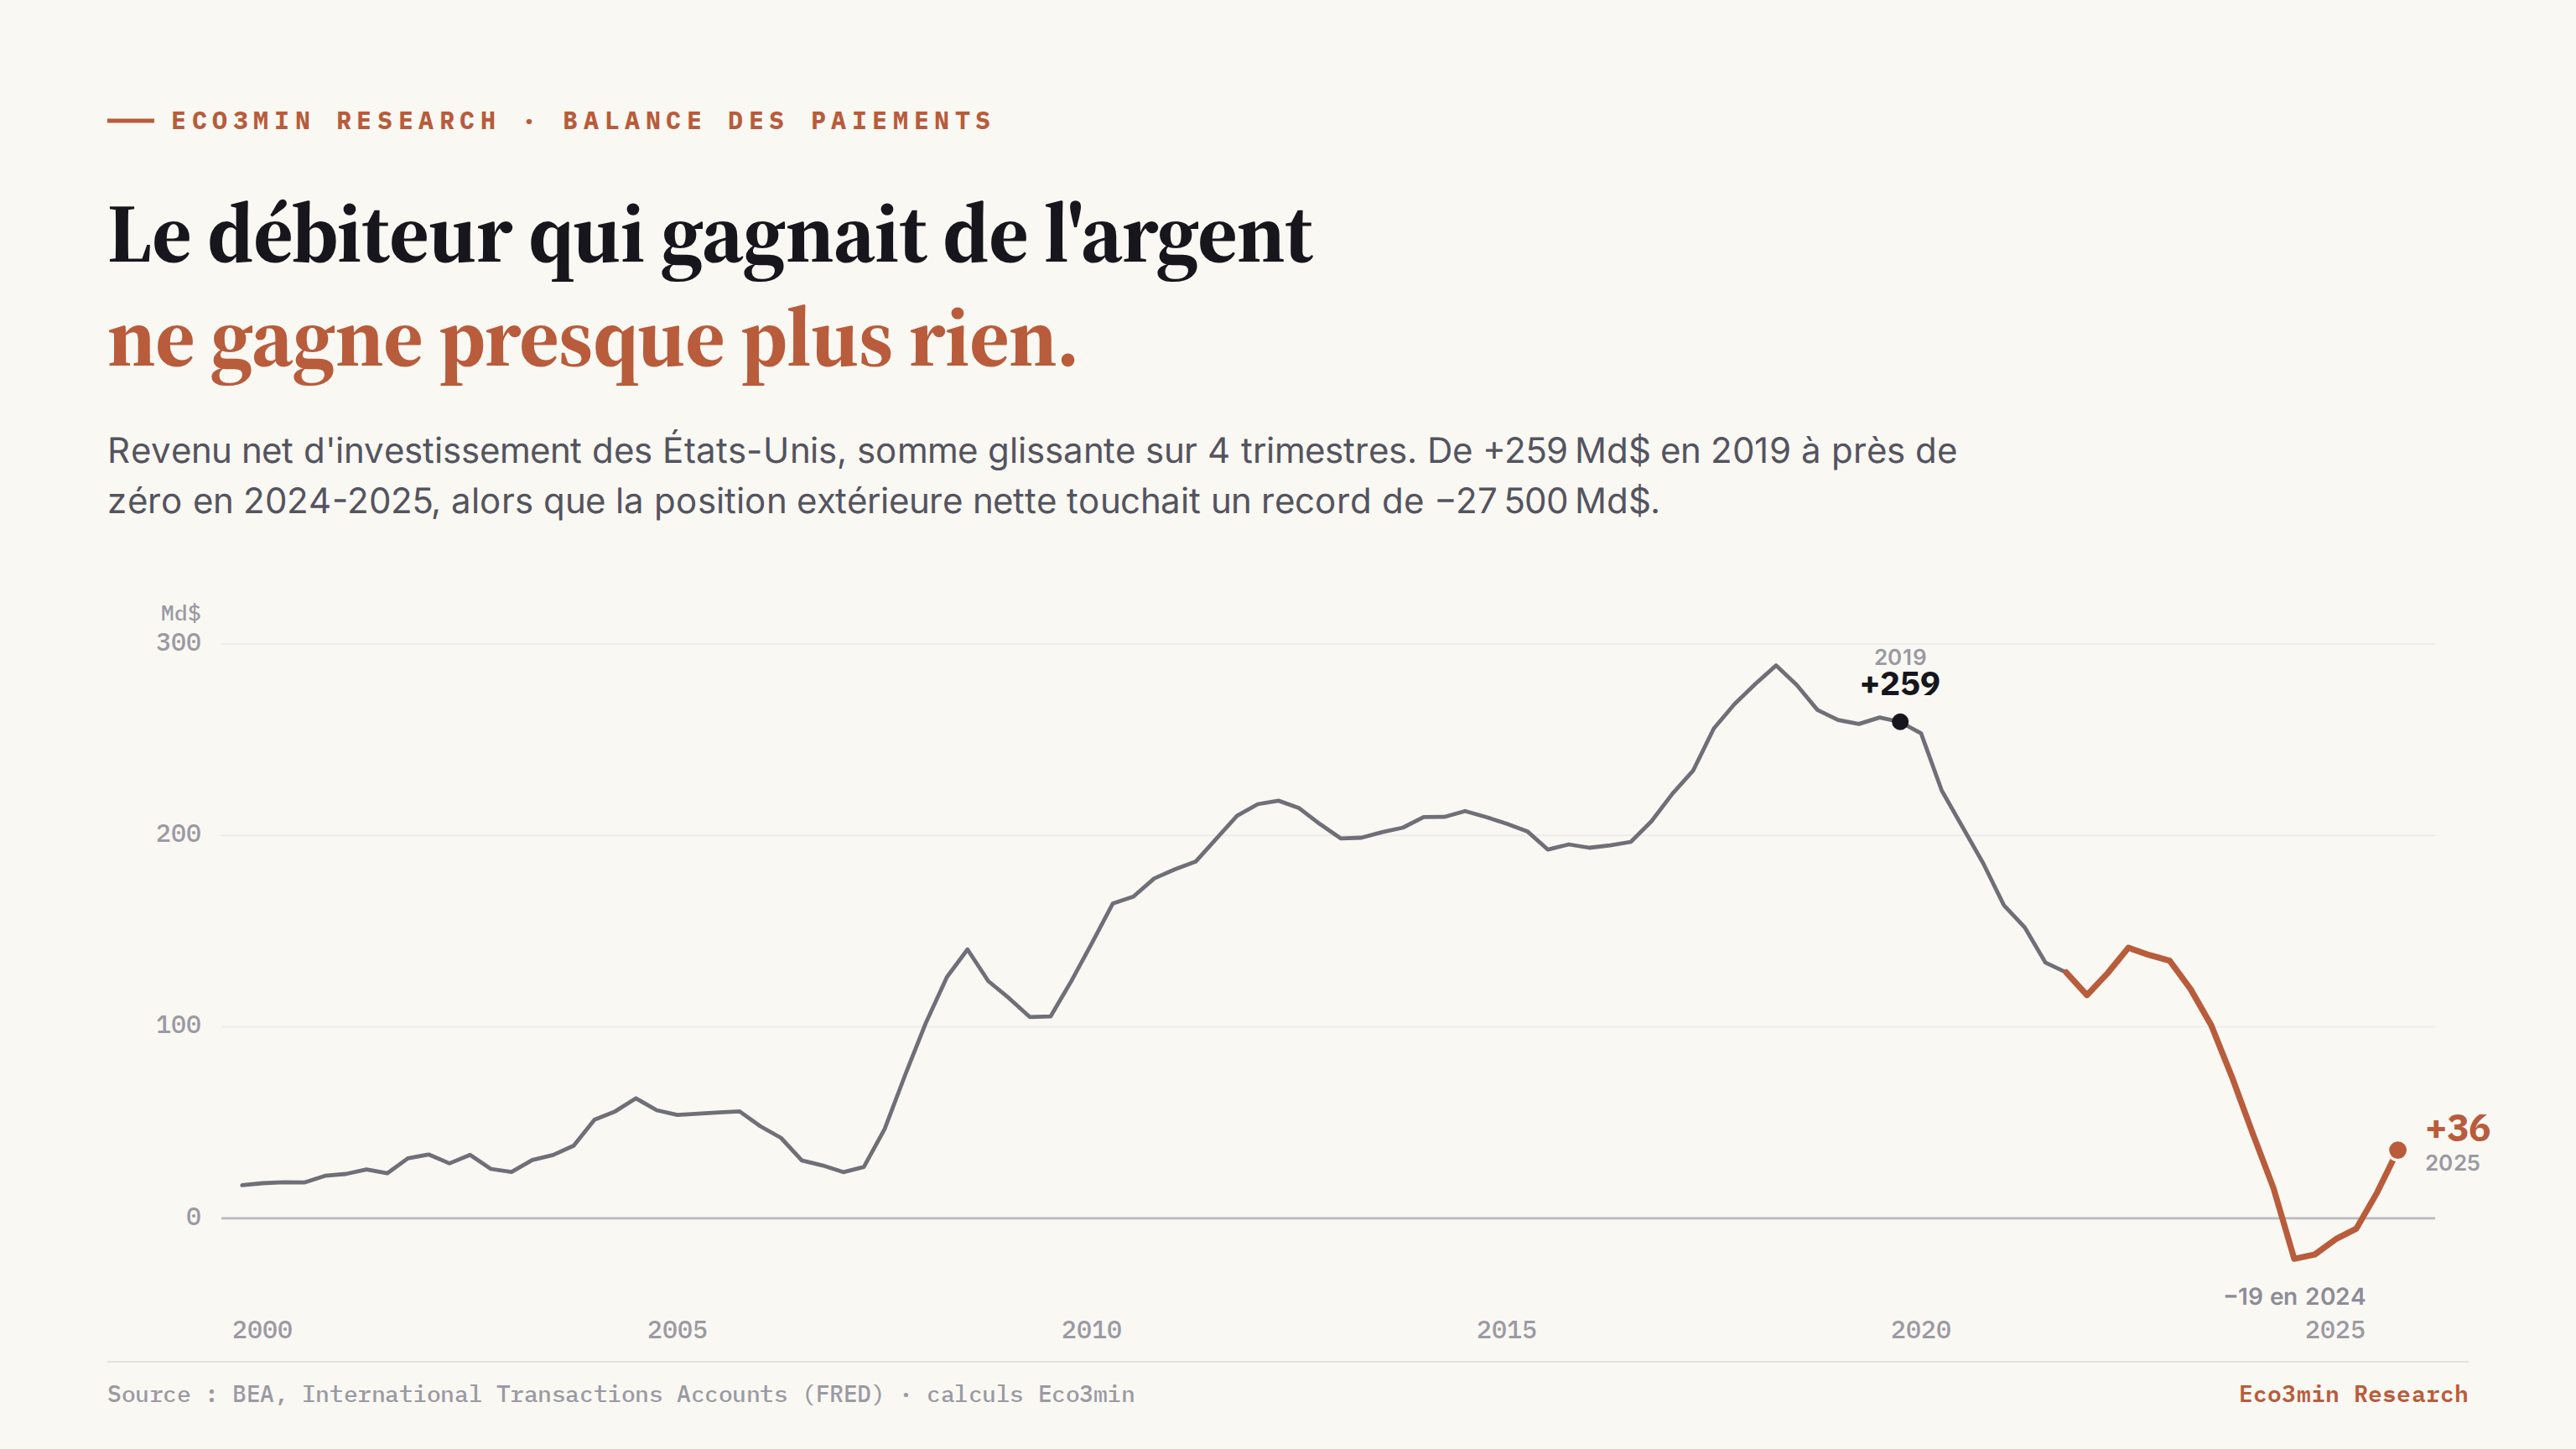
For decades the United States has displayed an accounting anomaly economists call the “exorbitant privilege”: the world’s largest net debtor, it nonetheless earned more income on its foreign investments than it paid to foreign holders of U.S. assets. A country that borrows from the rest of the world pays it, in principle, a net return. The United States did the opposite.
That anomaly is closing. According to the U.S. Bureau of Economic Analysis (International Transactions Accounts), U.S. net investment income fell from $259 billion in 2019 to near zero: −$19 billion in 2024, +$36 billion in 2025 (Eco3min calculations). Over the same span, the U.S. net international investment position — the gap between what Americans own abroad and what foreigners own in the United States — reached a record −$27.5 trillion, about 90% of GDP. This page traces the disappearance of the surplus, decomposes it source by source, and explains why it is more a matter of the interest bill than the end of the American advantage. More context: every deficit above 5% of GDP.
U.S. net investment income — what the country earns on its foreign assets minus what it pays foreign holders of U.S. assets — fell from $259 billion in 2019 to near zero.
- The yield advantage behind the exorbitant privilege is intact: net direct-investment income rose from $356 to $377 billion between 2019 and 2025.
- The entire deterioration is in interest-bearing income (portfolio plus other investment), which slid from −$98 to −$348 billion, a $250 billion swing.
- The trigger: higher rates after 2022 on the roughly $26 trillion of interest-bearing U.S. assets foreigners hold.
- This is not a clean break: −$19 billion in 2024, +$36 billion in 2025 — near zero, not durably negative.
01The exorbitant privilege: a debtor that made money
Basic economic intuition holds that a country running persistent current-account deficits — as the United States has since the 1980s — becomes indebted to the rest of the world and pays it, on net, an investment return. The United States long escaped that gravity. Its income receipts — profits, dividends and interest earned abroad — comfortably exceeded its payments, despite a markedly negative external position.
The mechanism has been understood since the work of Pierre-Olivier Gourinchas and Hélène Rey (2007) on the “exorbitant privilege”: U.S. assets held abroad consist largely of direct investment and equities, which earn high returns, while U.S. liabilities consist largely of safe, low-yielding debt — Treasuries above all. The United States behaved like an intermediary: it supplied the world with safe, low-yield assets and invested the incoming capital in more profitable holdings.
According to the Federal Reserve Bank of New York (Liberty Street Economics, May 2026), U.S. direct investments abroad recently earned 5.6% on $14 trillion of assets, against 1.8% on the $20 trillion of foreign direct investment in the United States. That gap is what lets positive investment income coexist with a negative external position.
02The surplus has fallen to near zero
The chart above shows the full path. After a plateau around $200 billion through the 2010s, net investment income rose to about $265 billion in 2017-2019 — a level lifted by a jump in direct-investment profits, partly tied to the 2017 U.S. tax reform. Then the decline: $185 billion in 2020, $128 billion in 2021, $138 billion in 2022, $74 billion in 2023, −$19 billion in 2024 and +$36 billion in 2025 (Eco3min calculations on BEA data). A broader view: our reference page on the U.S. dollar as a systemic variable in the global monetary system.
The decline does not hinge on the anchor point. Whether you start from the 2019 high ($259 billion) or the 2010s plateau (around $200 billion), the balance now converges toward zero. The table below gives the annual figures, in billions of dollars, summed over the four quarters of each year.
| Year | Net investment income | of which direct inv. | of which interest-bearing* |
|---|---|---|---|
| 2016 | +207 | +290 | −82 |
| 2017 | +268 | +352 | −84 |
| 2019 | +259 | +356 | −98 |
| 2021 | +128 | +268 | −140 |
| 2023 | +74 | +310 | −244 |
| 2024 | −19 | +297 | −324 |
| 2025 | +36 | +377 | −348 |
* “Interest-bearing” groups portfolio income (dividends + interest on securities) and other-investment income (interest on loans and deposits). Source: BEA, International Transactions Accounts (FRED series IEAX/IEAM); Eco3min calculations. Reserve-asset income, marginal, is not shown as a column.
This page measures net investment income in the strict sense (investment receipts minus payments). The BEA’s broader “balance on primary income,” which adds compensation of employees, shifted from a surplus in 2023 to a deficit in 2024, then oscillates around zero quarter to quarter in 2025. Taken from the Bureau of Economic Analysis international accounts. Both measures point to the same phenomenon — a balance reduced to almost nothing — without being the same thing.
03The decomposition: it all comes from the interest bill
The disappearance of the surplus is not a broad weakening. Decomposed by income type, it concentrates entirely on one component. Net direct-investment income, which carries the U.S. yield advantage, has not weakened — it actually rose from $356 billion in 2019 to $377 billion in 2025. Net portfolio and other-investment income, by contrast, deteriorated: from −$98 billion in 2019 to −$348 billion in 2025, a $250 billion swing.
The chart below isolates the three components. Hover over a year to read the values.
total +36 · FDI +377 · interest −348
Net income (receipts minus payments), trailing four-quarter sum. Direct-investment income stays high and stable; interest-bearing income falls and drags the total toward zero.
The cause is documented by the Federal Reserve Bank of New York (“Honey, Who Shrunk the U.S. Income Surplus?”, May 2026): the post-pandemic rise in rates raised the cost of U.S. liabilities. Foreigners hold roughly $26 trillion of interest-bearing U.S. assets — Treasuries and other debt securities above all — while the United States holds only a fraction abroad. When rates rise, that asymmetry comes due. The New York Fed estimates the net interest balance reached −$450 billion in 2025, and that about $170 billion of the $240 billion rise in net payouts since 2021 comes from rates alone; the rest comes from the continued growth of net liabilities. Related framing: every quarter interest crossed defense spending.
04Why this is not (yet) the end of the privilege
Reading this path as the end of the exorbitant privilege would be premature, for three reasons the data support.
First, most of the decline is cyclical. It rests on a rate shock that is, by nature, partly reversible: the New York Fed calculates that with the current $15 trillion gap between interest-bearing assets and liabilities, a 1-point fall in rates would add about $150 billion to net income. Part of the surplus would return mechanically if rates eased.
Second, the yield advantage behind the privilege is intact. Net direct-investment income rose over the period rather than falling. What deteriorated is the cost of debt, not the profitability of U.S. assets. A rising cost of debt is where this balance-of-payments story meets the interest-rate and liquidity regimes traced since 1990.
That direct-investment yield advantage is contested. Brad Setser (Council on Foreign Relations, November 2024) notes that 60% of U.S. direct-investment profits come from seven low-tax jurisdictions, and that the income surplus would disappear without the share tied to multinationals’ tax positioning. The New York Fed itself acknowledges that this three-decade-old debate is unsettled. The advantage is therefore measured, but its nature — a genuine risk premium or an accounting artifact — remains disputed. A parallel read: the historical record of US dollar cycles.
Third, the balance remains marginally positive on the most recent reading. Net investment income has not flipped durably into negative territory: it touched −$19 billion in 2024 before recovering to +$36 billion in 2025. The accurate phrasing is not “the privilege has gone” but “the surplus that embodied it has shrunk to almost nothing.” Both readings — the erosion of a structural advantage, or a simple squeeze from rates — are consistent with the same figures.
05Levels to watch
- Rate sensitivity. With the interest-bearing asset-liability gap at −$15 trillion, each 1-point move in U.S. and foreign rates shifts net income by about $150 billion, per the New York Fed. If rates eased durably, the balance would recover; if they stayed high, the interest deficit would keep weighing.
- Growth of net liabilities. As long as the United States finances a current-account deficit by selling assets, on net, to the rest of the world, the structural share of the servicing cost rises, independent of rates.
- Next release. The International Transactions Accounts (Q1 2026) are due June 23, 2026; the net international investment position is now published in the same release.
06Methodology & data
The indicator is U.S. net investment income: investment receipts (on U.S.-owned assets abroad) minus investment payments (on U.S. assets held by foreigners), as published by the BEA in the International Transactions Accounts. A related compilation: the US share of the world stock market. It breaks down into four functional categories — direct investment, portfolio, other investment, reserve assets. The series are quarterly, seasonally adjusted, at a quarterly rate; annual figures are the sum of the four quarters, and trailing values the sum over four quarters. All figures on this page are computed by Eco3min from the public series (FRED, prefix IEAX for receipts and IEAM for payments). Related reading: our reading of the stock-investing question.
| Series | Source | Coverage | 2025 |
|---|---|---|---|
| Net investment income | BEA · IEAXII−IEAMII | 1999–2025 | +36 |
| of which direct investment | BEA · IEAXID−IEAMID | 1999–2025 | +377 |
| of which interest-bearing | BEA · portfolio + other | 1999–2025 | −348 |
| Net international position | BEA · IIPUSNETIQ | 2006–2025 | −27,537 |
import pandas as pd

# Net investment income, straight from FRED — no API key
rec = pd.read_csv("https://fred.stlouisfed.org/graph/fredgraph.csv?id=IEAXII")
pay = pd.read_csv("https://fred.stlouisfed.org/graph/fredgraph.csv?id=IEAMII")
df = rec.merge(pay, on="observation_date")
df["net"] = df["IEAXII"] - df["IEAMII"]      # millions, quarterly rate
df["net_4q"] = df["net"].rolling(4).sum() / 1000 # $B, trailing sum07Data & reproducibility
The quarterly series of U.S. net investment income and its components is available in open format, updated when the underlying data are revised.
License: Creative Commons Attribution 4.0 (CC BY 4.0). Free for research, academic and journalistic use with attribution.
08Questions & answers
What is the “exorbitant privilege”?
Has U.S. investment income turned negative?
Why has the surplus disappeared?
Is this the end of the exorbitant privilege?
How does this differ from the balance on primary income?
Is the U.S. net international position a “debt”?
09Sources & limitations
- PrimaryBureau of Economic Analysis — International Transactions Accounts and International Investment Position, Q4 2025 (FRED series IEAX/IEAM, IIPUSNETIQ).
- AnalysisFederal Reserve Bank of New York — Matthew Higgins & Thomas Klitgaard, “Honey, Who Shrunk the U.S. Income Surplus?”, Liberty Street Economics, May 18, 2026.
- AnalysisBrad Setser — Council on Foreign Relations, November 2024 (analyses on the U.S. income balance).
- OriginGourinchas & Rey — foundational work on the “exorbitant privilege” and valuation effects (2007).
- Net investment income measures only income from capital. The broader balance on primary income reads slightly differently.
- The yield advantage on direct investment is debated. Part of it rests on the tax location of multinational profits, whose economic nature remains disputed.
- The decomposition used groups dividends and interest within portfolio. The New York Fed’s finer equity/interest split places the interest balance at about −$450 billion in 2025.
- The data are revised. Quarterly accounts are updated the following quarter and at the annual revision in March.
Last updated — 15 September 2026
Disclaimer – Financial Information: The analyses, commentary, and content published on eco3min.fr are provided for informational and educational purposes only. They do not constitute investment advice or a solicitation to buy or sell financial instruments. Past performance is not indicative of future results. All investment decisions involve risk and are the sole responsibility of the reader.