
US 3-2-1 Crack Spread: Daily Refining Margin Data Since 1986
The US 3-2-1 crack spread is the gross refining margin, in US dollars per barrel, earned by turning three barrels of crude oil into two barrels of gasoline and one barrel of distillate — the single most-watched proxy for US refinery profitability. This Eco3min composite reconstructs the 3-2-1 crack spread daily from three US Energy Information Administration (EIA) spot series — WTI at Cushing, New York Harbor conventional gasoline, and New York Harbor No. 2 heating oil — converting the product legs to a per-barrel basis and combining them as (2 × gasoline + 1 × distillate − 3 × crude) ÷ 3. It runs continuously since June 1986, which makes it the only 3-2-1 crack spread history assembled entirely from public EIA spot data and offered as a free download. Because EIA no longer distributes NY Harbor RBOB or NYMEX futures spot prices after April 2024, this construction uses the conventional-gasoline and heating-oil spot legs that remain continuous — a documented choice detailed in Construction & Components below.
Dataset: US 3-2-1 Crack Spread (1986–2026) · Updated 2026-09-15
Loading data…
Source: US Energy Information Administration (EIA) spot prices · Eco3min composite
Macro Takeaway
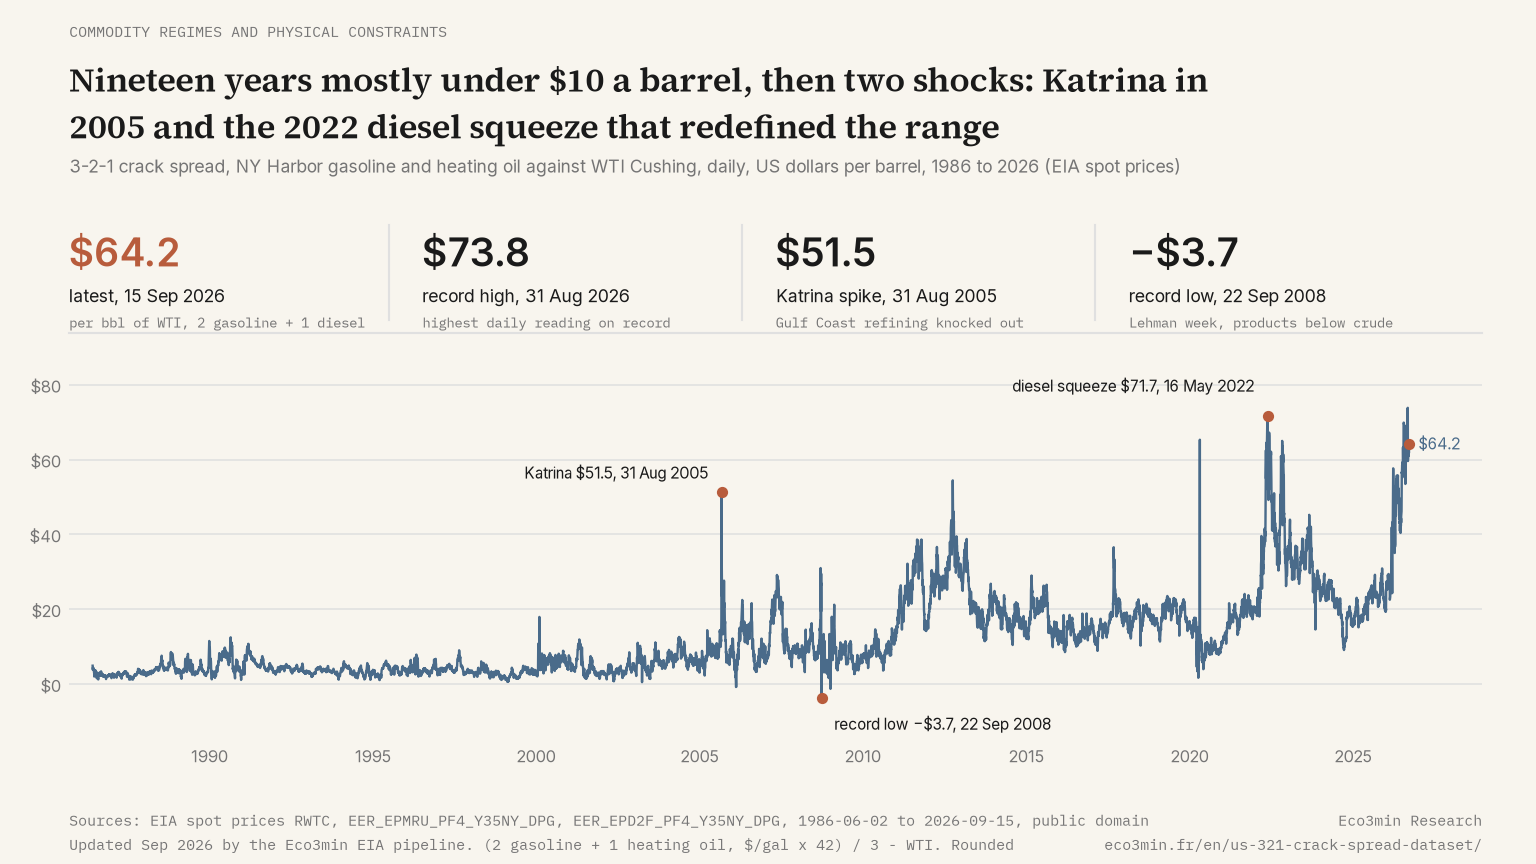
The 3-2-1 crack spread separates two distinct forces that a headline oil price blends together: the cost of crude and the tightness of refined-product markets. When the spread widens while WTI crude is stable or falling, the pressure at the pump is coming from refining and product supply, not from the barrel itself — the pattern that dominated 2022, when constrained refining capacity kept product prices elevated even as crude retreated. Over the full 1986–2026 history the spread has averaged roughly $12/bbl with a median near $8, so readings far above that band mark unusually profitable refining conditions rather than normal operation.
The historical extremes are informative. The spread reached $71.7/bbl on 16 May 2022 during the post-pandemic refining-capacity squeeze, which stood as the record until late August 2026, when it printed $73.70/bbl on the 28th and $73.84/bbl on the 31st. Readings of that order sit in the top percentile of the full history, previously reached only in acute supply dislocations. At the other end, the spread collapsed toward $1.7/bbl in early April 2020 as COVID-19 erased fuel demand. Read alongside US refinery throughput in the refinery utilization rate and the pump-level gasoline retail price, the crack spread places consumer fuel costs in their upstream margin context.
Construction & Components
The 3-2-1 crack spread approximates a simplified refinery yield — two barrels of gasoline and one of distillate per three barrels of crude — and expresses the gross margin per barrel of crude processed, before operating, energy and capital costs. This Eco3min composite computes it from EIA spot prices, converting the per-gallon product legs to a per-barrel basis (42 gallons per barrel) so all three legs share the same unit. A related angle appears in four decades of the 3-2-1 refining margin scrubbed through time.
Formula:
crack_321 = (2 × gasoline × 42 + 1 × distillate × 42 − 3 × WTI) / 3 [$/bbl]
Components:
- WTI crude (Cushing spot) — EIA series RWTC — daily, $/bbl. The crude input; already quoted per barrel.
- Gasoline (NY Harbor conventional regular spot) — EIA series EER_EPMRU_PF4_Y35NY_DPG — daily, $/gallon. The gasoline leg (2 barrels).
- Distillate (NY Harbor No. 2 heating oil spot) — EIA series EER_EPD2F_PF4_Y35NY_DPG — daily, $/gallon. The distillate leg (1 barrel), the traditional distillate reference of the crack.
Frequency reconciliation: All three legs are daily EIA spot prices. The composite is an inner join on common trading days — no interpolation and no forward-fill — so a value exists only for dates on which all three legs printed. The series therefore begins on 2 June 1986, the first date all three spot legs are available.
Coverage and construction choice: 1986–present, daily. The mainstream 3-2-1 crack is usually built from NYMEX RBOB and heating-oil futures; EIA does not publish a NY Harbor RBOB spot series (RBOB exists only as a discontinued futures series after April 2024). This construction therefore uses NY Harbor conventional gasoline spot for the gasoline leg and NY Harbor No. 2 heating oil spot for the distillate leg — both continuous since 1986, requiring no splice. The trade-off is a small, stable basis versus the RBOB-futures crack; see Data Quality below.
Dataset Overview
| Indicator | US 3-2-1 Crack Spread (1986–2026) |
|---|---|
| Geography | United States (WTI Cushing, NY Harbor products) |
| Frequency | Daily |
| Period | 1986–2026 |
| Variables | date, wti, gasoline, distillate, crack_321 |
| Format | CSV, Excel (XLSX) |
| Sources | US Energy Information Administration (EIA) spot prices — RWTC, EER_EPMRU_PF4_Y35NY_DPG, EER_EPD2F_PF4_Y35NY_DPG — combined as an Eco3min composite |
| Last updated | — |
Dataset Variables
The CSV and Excel files contain the following columns.
| Column | Type | Description |
|---|---|---|
date | Date (YYYY-MM-DD) | Observation date (common trading day for all three legs) |
wti | Float | WTI Cushing crude spot price, USD per barrel (EIA RWTC) |
gasoline | Float | NY Harbor conventional regular gasoline spot price, USD per gallon |
distillate | Float | NY Harbor No. 2 heating oil spot price, USD per gallon |
crack_321 | Float | 3-2-1 crack spread, USD per barrel — the derived headline metric |
Column names match the CSV headers exactly.
Where the Latest Margin Sits in the Distribution
The chart above shows the level; it does not say whether a given margin is ordinary or extreme for the period you care about. This tool places the latest 3-2-1 crack spread inside the distribution of every trading day in the window you select, from the full record since 1986 to the last five years, and reports its percentile rank, the window median and the dated extremes.
On 15 September 2026 the spread stood at $64.2, above 99.7 percent of the 10,120 trading days since June 1986, whose median is $7.9; against the last five years alone, median $26.8, it still ranks at the 97th percentile. The record high is $73.8 on 31 August 2026, the low −$3.7 on 22 September 2008.
Download the Complete Dataset
The full 3-2-1 crack spread dataset is available in CSV and Excel formats.
Direct CSV Access — Eco3min Structured Dataset
https://eco3min.fr/dataset/eia/us-321-crack-spread.csv
This URL returns the complete dataset in CSV format — date, the three spot legs, and the derived crack spread. It can be used directly in pandas, R, curl, or any data tool. The underlying spot legs are public EIA series; the crack spread itself is an Eco3min calculation and has no single upstream code. It can be read alongside our 3-2-1 crack spread simulator.
Using the Dataset in Python
import pandas as pd

url = "https://eco3min.fr/dataset/eia/us-321-crack-spread.csv"
df = pd.read_csv(url, parse_dates=["date"])

print(df.tail())
print(f"Latest 3-2-1 crack: {df['crack_321'].iloc[-1]:.2f} $/bbl")
Using the Dataset in R
library(readr)

url <- "https://eco3min.fr/dataset/eia/us-321-crack-spread.csv"
df <- read_csv(url)

tail(df)
summary(df$crack_321)
Both examples load the dataset directly from the URL — no download or API key required.
Methodology
The 3-2-1 crack spread is recomputed by an Eco3min pipeline that pulls the three EIA spot series from the EIA open-data API and combines them according to the formula in Construction & Components. EIA compiles each spot price from broker and market reports of physical trades: WTI at the Cushing, Oklahoma delivery point, and the two product legs at New York Harbor. The pipeline aligns the three legs on their common trading days, applies the per-barrel conversion, and writes the CSV, Excel and JSON files daily.
Because the series is derived, its cadence follows the slowest input on any given day; in practice all three legs are daily EIA spot prices published with roughly a one-business-day lag. The full CSV is regenerated on each run rather than appended, so any upstream EIA spot revision propagates through the derived series automatically. Upstream of those spot legs sits the physical balance itself: US commercial crude inventories, weekly since 1982, whose draws and builds decide how hard refiners bid for crude.
Data Quality & Provider Notes
The 20 April 2020 point is distorted by negative crude and is an anomaly, not a margin signal. On that day the WTI Cushing spot printed −$36.98 as the expiring May futures contract collapsed. Because the formula subtracts three times the crude price, a negative crude value inflates the crack spread mechanically — the series shows roughly $65/bbl that day, which does not represent a real refining margin. It is the only day in the entire history on which WTI printed below $5. Genuine refining-margin behaviour that week is better read from the surrounding days, when the spread sat near $10–14/bbl.
Rare negative readings reflect crude-product dislocations. The spread has closed below zero on five days in forty years: three times in February 2006, and on 22 September 2008 (when WTI spiked to $122.6 on a futures-expiry squeeze) and 31 December 2008 (crude falling faster than products). The dataset low of −$3.72/bbl on 22 September 2008 is one such single-day dislocation rather than a sustained regime.
Basis versus the RBOB-futures crack. This EIA-spot construction differs by a small, stable basis from the widely quoted 3-2-1 crack built on NYMEX RBOB and heating-oil futures, because conventional gasoline trades slightly above RBOB blendstock. The two move together and agree closely at turning points; for late June 2022, for example, this series reads near $49/bbl against a published RBOB-based figure of about $48. A futures-based reconstruction is not reproducible from EIA data after April 2024, when EIA stopped distributing NYMEX futures prices — a further reason this spot-based series exists.
Alternative sources. Commercial vendors (RBN Energy, Argus, Platts, exchange-traded crack futures on CME) publish refining-margin benchmarks, generally on the RBOB-futures convention and behind subscription. There is no free, continuous EIA-spot 3-2-1 crack history other than this dataset.
What This Index Captures (And What It Doesn’t)
The 3-2-1 crack spread is a gross-margin proxy and a regime indicator, not a measure of refiner profit and not a market-timing tool.
What it captures:
- The gross dollar margin per barrel between refined products and crude — the headline gauge of US refining economics.
- Product-versus-crude tightness: widening cracks signal that gasoline and distillate markets are tight relative to crude supply, independent of the crude price level.
- Refining-capacity stress: sustained high cracks historically coincide with capacity shortfalls, outages, or demand surges that refiners cannot immediately meet.
What it does NOT capture (common misinterpretations):
- Net refiner profit. The spread is a gross margin before operating costs, energy inputs, catalyst, and capital charges — typically several dollars per barrel — so it overstates the cash margin a refiner actually keeps.
- An exact match to the traded crack. This is an EIA-spot construction (conventional gasoline + heating oil), not the NYMEX RBOB/ULSD futures crack; the two differ by a basis, discussed in Data Quality.
- A single refinery’s economics. The 3-2-1 yield is a stylised US-complex approximation; individual refineries with different crude slates and product mixes realise different margins.
- The 2020 negative-crude spike. The 20 April 2020 reading is a crude-pricing artifact, not a margin signal, as noted above.
The series is most useful as a regime-classification and diagnostic tool for the refined-products complex, read alongside crude and refinery-throughput data, rather than as a tactical trigger.
Historical Regimes
1986–2004 — Structurally thin margins. For most of this period the spread held in the low single digits, averaging well below its long-run mean, with brief seasonal widenings. Refining capacity was ample relative to demand and product markets rarely dislocated from crude.
2005 — Gulf Coast hurricanes. Hurricanes Katrina and Rita knocked out a large share of Gulf refining, and the spread jumped to roughly $51/bbl on 31 August 2005 as products tightened against crude — the first sustained break above the historical band.
2008 — Extreme volatility. As crude ran to record highs and then collapsed, the crack whipsawed and printed negative twice: −$3.7/bbl on 22 September during a WTI futures-expiry squeeze, and again on 31 December as crude fell faster than products in the financial crisis.
2020 — Demand collapse. COVID-19 erased fuel demand and the spread fell toward $1.7/bbl in early April 2020, among the lowest readings in the dataset. The 20 April negative-crude print (see Data Quality) is an artifact, not a margin surge.
2021–2022 — Refining-capacity squeeze. Post-pandemic demand recovery, the loss of Russian refined-product flows, and closures of global refining capacity drove the spread to $71.7/bbl on 16 May 2022, the highest reading in the series at the time, with margins staying historically elevated through the year.
2023–2026 — Elevated but volatile. Margins normalised off the 2022 peak yet stayed high by historical standards: the stretch since January 2023 averages $28.95/bbl against $12.27 for the full record and $4.27 across 1986–2004. On 31 August 2026 the spread set a new dataset high of $73.84/bbl, surpassing the May 2022 peak.
Related Macroeconomic Datasets
The crack spread is best read alongside its crude input, the product legs at the pump, and refinery throughput.
- WTI Crude Oil Price — the crude leg of the crack; the spread is the product complex net of this input
- US Refinery Utilization Rate — the throughput gauge; high cracks and high utilization typically coincide
- US Gasoline Retail Price — the pump-level counterpart of the gasoline leg
- US Diesel Retail Price — the on-highway counterpart of the distillate leg
- NY Harbor Heating Oil Spot Price — the distillate leg used in this construction, as a standalone series
- US Gulf Coast Jet Fuel Spot Price — the middle-distillate cut adjacent to diesel and heating oil
Related Analysis
- Refining Margins: The Hidden Driver of Oil Profits — how refining margins shape oil-sector earnings beyond the crude price
- What drives oil refining margins? — the supply-and-demand forces behind crack-spread moves
Macroeconomic Dataset Hub
This dataset is part of the Eco3min macro-financial data repository. Explore all available datasets including energy benchmarks, interest rates, equity returns, credit spreads, and currency indicators.
Explore the Eco3min Dataset Hub
Sources
- US Energy Information Administration (EIA) — WTI Cushing spot (RWTC)
- US Energy Information Administration (EIA) — NY Harbor conventional gasoline spot (EER_EPMRU_PF4_Y35NY_DPG)
- US Energy Information Administration (EIA) — NY Harbor No. 2 heating oil spot (EER_EPD2F_PF4_Y35NY_DPG)
- Eco3min Research — 3-2-1 crack spread composite calculation
Dataset Reference
Last updated — 22 September 2026
Disclaimer – Financial Information: The analyses, commentary, and content published on eco3min.fr are provided for informational and educational purposes only. They do not constitute investment advice or a solicitation to buy or sell financial instruments. Past performance is not indicative of future results. All investment decisions involve risk and are the sole responsibility of the reader.