
US Crude Oil Stocks: Weekly Commercial Inventories Excluding SPR Since 1982
US crude oil stocks measure the commercial inventories of crude oil held in the United States, excluding the Strategic Petroleum Reserve, in thousands of barrels at the end of each week. Published by the US Energy Information Administration (EIA) every Wednesday in the Weekly Petroleum Status Report since August 1982, it is the single most-watched weekly number in the oil market: the week-on-week change is the headline print traders react to at 10:30 ET. At the week ending 11 September 2026 the series stood at 423.4 million barrels, after a draw of 0.6 million.
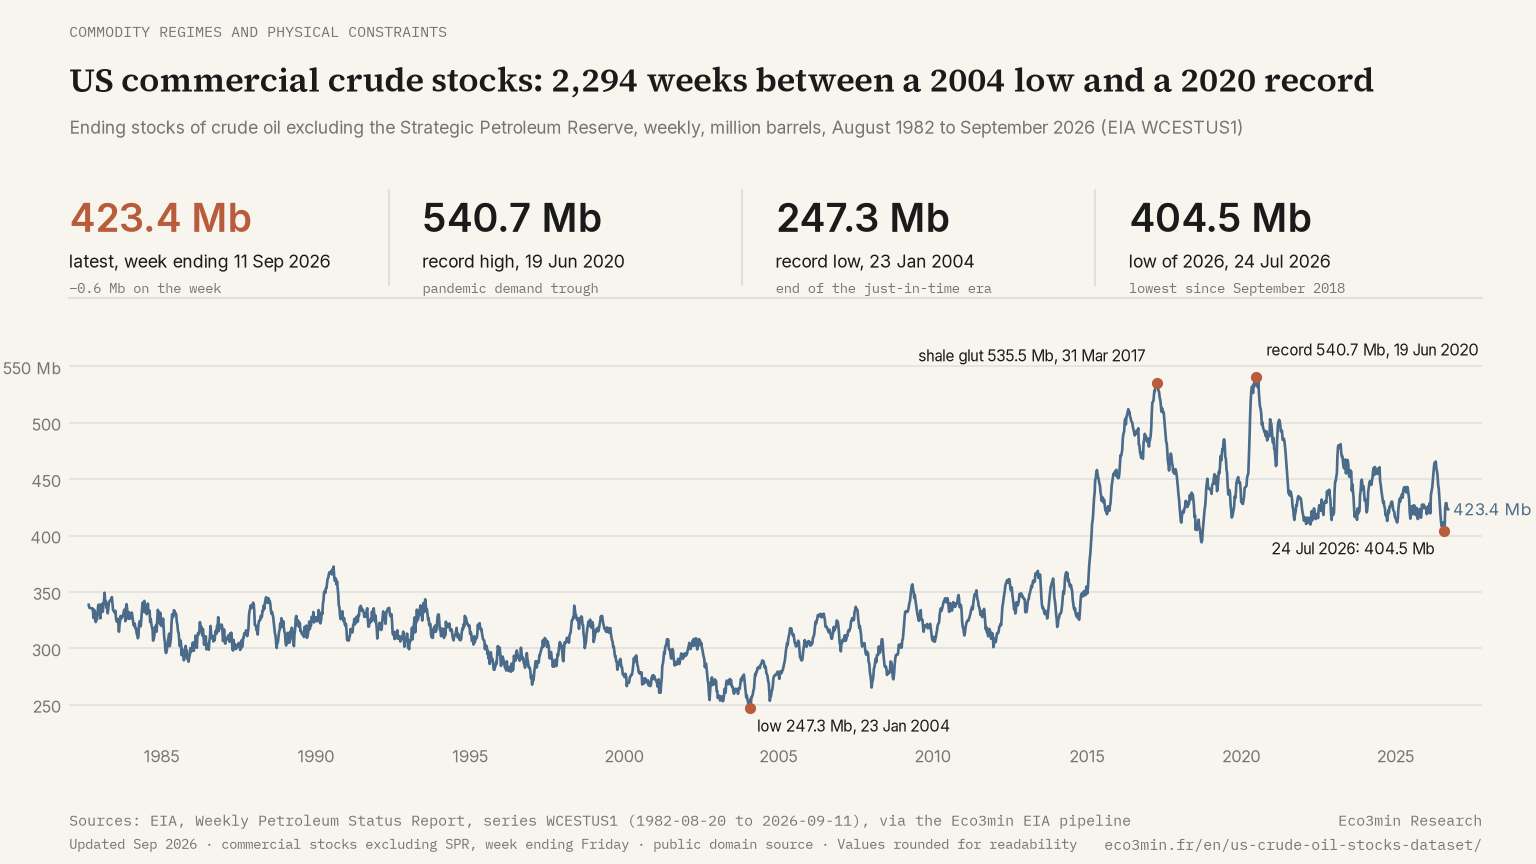
Weekly US commercial crude inventories excluding the SPR, 2,294 observations since 20 August 1982, from the EIA Weekly Petroleum Status Report, served as CSV, Excel and JSON.
- The record high is 540.7 million barrels on 19 June 2020, at the trough of pandemic demand; the record low is 247.3 million on 23 January 2004, at the end of two decades of inventory minimisation.
- Over the full record the median weekly change is 3.0 million barrels in absolute terms and 26.1 percent of weeks move by 5 million or more; since 2020 those figures are 3.5 million and 30.9 percent.
- Seasonality is strong: stocks build from January to April during refinery maintenance and draw from June to September, with draws in more than 60 percent of summer weeks since 1982.
Dataset: US Commercial Crude Oil Stocks excl. SPR (1982–2026) · Updated 2026-09-11
Loading data…
Source: US Energy Information Administration (EIA), Weekly Petroleum Status Report · series WCESTUS1
Macro Takeaway
Commercial crude stocks are the buffer between US production plus imports on one side and refinery runs plus exports on the other, so their weekly change is a direct reading of the physical balance: a draw means refiners and exporters pulled more crude than arrived, a build means the opposite. Because the number excludes the Strategic Petroleum Reserve, it isolates the market-held inventory that responds to prices, and it is read together with the refinery utilization rate, published in the same report, and with the 3-2-1 crack spread, which turns the crude-versus-products balance into a margin. The level matters less than the change and the season: a 3 million barrel draw in July is ordinary, the same draw in February is not.
The pandemic gave the series its extremes in both directions. Stocks rose from 453.7 million barrels in the week ending 13 March 2020 to a record 540.7 million on 19 June 2020 as refiners cut runs faster than producers shut wells; they then drained for fifteen months to 414.0 million by 17 September 2021 as demand recovered and exports absorbed the surplus. In the following years the range narrowed to roughly 405 to 480 million barrels, and the 404.5 million of 24 July 2026 was the lowest reading since September 2018, at a time when the WTI crude oil price closed at 91.74 dollars.
Dataset Overview
| Indicator | US Commercial Crude Oil Stocks excluding SPR (1982–2026) |
|---|---|
| Geography | United States |
| Frequency | Weekly (week ending Friday) |
| Period | 1982–2026 |
| Variables | date, crude_stocks_excl_spr |
| Unit | Thousand barrels |
| Format | CSV, Excel (XLSX), JSON |
| Sources | US Energy Information Administration (EIA), Weekly Petroleum Status Report — series WCESTUS1 |
| Last updated | — |
Dataset Variables
The CSV and Excel files contain the following columns.
| Column | Type | Description |
|---|---|---|
date | Date (YYYY-MM-DD) | Week-ending observation date (Friday) |
crude_stocks_excl_spr | Integer | US ending stocks of crude oil excluding the Strategic Petroleum Reserve, thousand barrels (EIA WCESTUS1) |
Column names match the CSV headers exactly. The week-on-week change quoted in the press is the difference between two consecutive rows.
Seasonal Profile of Weekly Changes
Crude inventories follow the refinery calendar. Spring and autumn maintenance lowers crude runs and lets stocks build; the summer driving season and the year-end inventory drawdown pull them down. The component below computes, for the window you choose, the median weekly change and the share of drawing weeks for each month of the year, and overlays the actual weekly changes of any year since 2010 so a single print can be read against its season rather than against the previous week.
Over 1982–2025, the median weekly change is positive from January to April, peaking at +2.3 million barrels in March, and negative from June to September, with July the deepest at −1.8 million; October rebuilds (+2.2 million) before a December draw (−1.5 million). The share of drawing weeks runs from 28.8 percent in March to 68.2 percent in December.
Download the Complete Dataset
The full US commercial crude oil stocks dataset is available in CSV and Excel formats.
Direct CSV Access — Eco3min Structured Dataset
https://eco3min.fr/dataset/eia/us-crude-oil-stocks.csv
This URL returns the complete dataset in CSV format. It can be used directly in pandas, R, curl, or any data tool. The underlying data is EIA series WCESTUS1, published in the EIA Weekly Petroleum Status Report; this page provides a clean, analysis-ready CSV with a consistent header and both CSV and Excel downloads. A JSON version is served at the same path with the .json extension.
Using the Dataset in Python
import pandas as pd

url = "https://eco3min.fr/dataset/eia/us-crude-oil-stocks.csv"
df = pd.read_csv(url, parse_dates=["date"])
df["weekly_change_mb"] = df["crude_stocks_excl_spr"].diff() / 1000

print(df.tail())
print(f"Latest stocks: {df['crude_stocks_excl_spr'].iloc[-1] / 1000:.1f} million barrels")
Using the Dataset in R
library(readr)

url <- "https://eco3min.fr/dataset/eia/us-crude-oil-stocks.csv"
df <- read_csv(url)
df$weekly_change_mb <- c(NA, diff(df$crude_stocks_excl_spr)) / 1000

tail(df)
summary(df$weekly_change_mb)
Both examples load the dataset directly from the URL — no download or API key required.
Methodology
The US Energy Information Administration collects weekly inventory data from refineries, bulk terminals and pipelines through its Form EIA-800 series surveys and publishes national ending stocks of crude oil in the Weekly Petroleum Status Report (series WCESTUS1). The figure covers commercial stocks in the 50 states and the District of Columbia, including crude in pipelines, at tank farms and in Alaskan transit, and excludes the Strategic Petroleum Reserve, which is reported separately. The Eco3min pipeline pulls the series from the EIA Open Data API v2 (route petroleum/stoc/wstk) and writes the CSV, Excel and JSON files.
EIA publishes the report on Wednesdays at 10:30 ET, covering the week ending the prior Friday, one day later in weeks with a US federal holiday; the pipeline refreshes the morning after each release. Weekly figures are occasionally revised in the following release and the monthly Petroleum Supply Monthly supersedes the weekly estimates with survey-based data.
Historical Regimes
1982–1990 — Post-shock inventories. The series opens at 338.8 million barrels in August 1982, in the aftermath of the second oil shock, and averages 322.2 million over the decade; the buffer built in the late 1970s was slowly run down as prices fell after 1986, closing 1990 at 315.9 million.
1991–2004 — Just-in-time drawdown. Consolidation of the refining industry and tighter working-capital management pushed inventories to their lowest levels in the record: the average fell to 298.4 million barrels and the all-time low of 247.3 million was set on 23 January 2004.
2005–2014 — Rebuilding. Higher prices and growing Cushing storage lifted stocks back to an average of 323.7 million barrels, with a peak of 368.8 million on 24 May 2013; the year 2014 closed at 353.0 million, on the eve of the shale surplus.
2015–2019 — Shale glut and the export era. Domestic output outran refining capacity: stocks crossed 500 million barrels for the first time in March 2016 and reached 535.5 million on 31 March 2017, the pre-pandemic record. The lifting of the crude export ban in December 2015 then opened the outlet that drained them, and 2019 closed at 429.9 million. The average of the period, 455.3 million, is 132 million above the previous decade.
2020–2021 — Pandemic swing. Refinery runs collapsed faster than production, and stocks rose from 453.7 million barrels on 13 March 2020 to the record 540.7 million on 19 June 2020. The rebound in demand and exports then produced the longest sustained draw in the series, to 414.0 million on 17 September 2021; the largest single-week build, +21.6 million on 26 February 2021, came in the week after Winter Storm Uri shut Gulf Coast refineries.
2022–2026 — Narrow range, low cover. With the SPR releases of 2022 excluded from this series, commercial stocks have oscillated between 481.2 million barrels on 17 March 2023 and 404.5 million on 24 July 2026, the lowest reading since September 2018, for an average of 433.4 million; the largest single-week draw of the record, −17.0 million, dates from 28 July 2023. The register of US refinery shutdowns since 1990 shows the capacity side of the same balance: fewer plants processing a domestic output that exports now clear.
Related Macroeconomic Datasets
Crude inventories are best read with the refinery runs that draw them, the margin they feed, and the crude and product prices around them.
- US Refinery Utilization Rate — the throughput side of the same weekly report
- US 3-2-1 Crack Spread — the margin that decides how hard refiners pull crude
- WTI Crude Oil Price — the Cushing benchmark priced against these inventories
- Brent Crude Oil Price — the seaborne benchmark that sets the export arbitrage
- US Gasoline Retail Price — the product the summer draw season feeds
- Real Crude Oil Price — WTI adjusted for inflation over the same decades
Related Analysis
- Refining Margins: The Hidden Driver of Oil Profits — why the crude-versus-products balance moves oil-sector earnings
- The 3-2-1 crack spread explained — the formula that links crude stocks to product margins
- How to read the US refinery utilization rate — the seasonal calendar that drives crude builds and draws
Macroeconomic Dataset Hub
This dataset is part of the Eco3min macro-financial data repository. Explore all available datasets including energy benchmarks, interest rates, equity returns, credit spreads, and currency indicators.
Explore the Eco3min Dataset Hub
Sources
- US Energy Information Administration (EIA) — Weekly Petroleum Status Report, US ending stocks excluding SPR of crude oil, thousand barrels (WCESTUS1), via the EIA Open Data API v2
- US Energy Information Administration (EIA) — Weekly Petroleum Status Report release schedule and holiday exceptions
- Eco3min Research — structured dataset compilation, seasonal statistics and regime dating
Dataset Reference
Last updated — 21 September 2026
Disclaimer – Financial Information: The analyses, commentary, and content published on eco3min.fr are provided for informational and educational purposes only. They do not constitute investment advice or a solicitation to buy or sell financial instruments. Past performance is not indicative of future results. All investment decisions involve risk and are the sole responsibility of the reader.