
Copper-Gold Ratio: Industrial Metal Versus Safe Haven, Monthly Since 1992
Copper-Gold Ratio — the price of copper divided by the price of gold, a market-implied growth and risk indicator. An Eco3min monthly composite since 1992, tracking the cyclical-versus-defensive metals balance. CSV download, free.
The Copper-Gold Ratio is an Eco3min monthly composite that divides the price of copper — an industrial metal driven by manufacturing and construction demand — by the price of gold, a non-yielding safe-haven asset. Calculated as copper (USD per metric ton) divided by gold (USD per troy ounce) and scaled by 1000 for readability, the Copper-Gold Ratio runs monthly from January 1992 to present. When copper outperforms gold, the market is pricing growth and risk-on flows; when gold outperforms copper, the market is pricing slowdown or systemic fear. The ratio has historically tracked the direction of Treasury yields and PMI readings closely enough to be cited as a cross-asset macro signal in institutional research.
Dataset: Copper-Gold Ratio (1992–2026) · Updated 2026-07-01
Loading dataset…
Source: IMF Primary Commodity Prices, Global Price of Copper (FRED: PCOPPUSDM)
Macro Takeaway
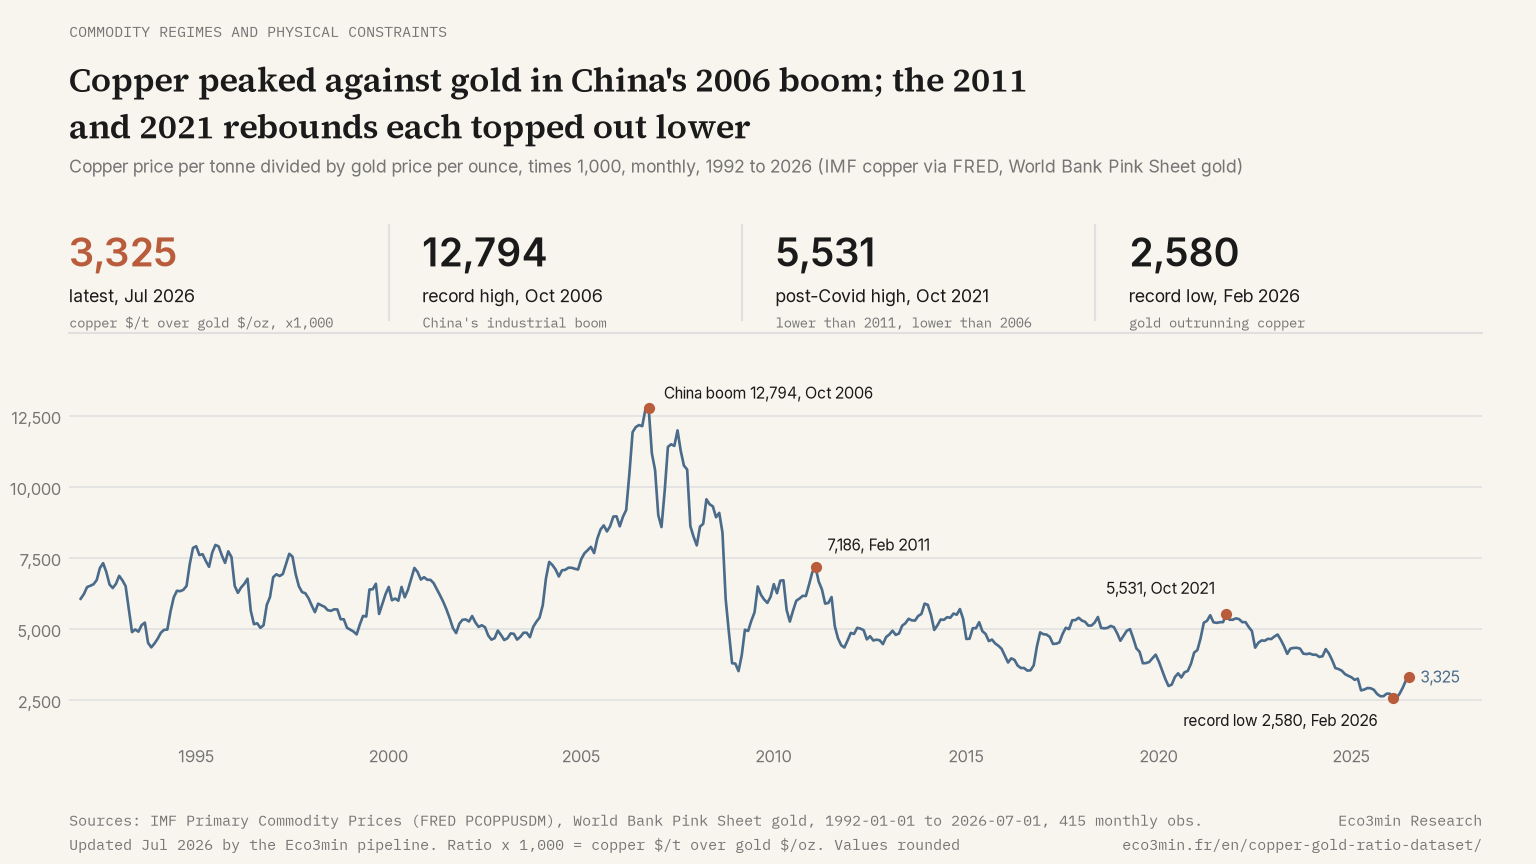
The Copper-Gold Ratio compresses two distinct market signals into a single number — cyclical demand expectations (via copper) and safe-haven demand (via gold). That safe-haven leg of the ratio is the subject of the case for gold as a reserve hedge and de-dollarization gauge. When the ratio rises, it suggests market participants are reallocating from defensive to cyclical commodities; when it falls, the reverse. Over the 1992–2026 sample, the ratio peaked in October 2006 at 12,794, at the height of the China-driven commodity supercycle, and reached its sample low in February 2026 at 2,580, as central-bank gold demand outpaced copper. Intermediate troughs cluster around recessions and financial stress (2001–2002, 2008–2009, 2020).
Cross-referencing the Copper-Gold Ratio with the WTI crude oil price, the US Dollar Index, and the copper price history situates it within the broader commodity-and-growth complex. Correlation with Treasury yields is well-documented in the literature but varies across regimes — particularly when one of the two metals is driven by idiosyncratic factors (Chinese inventory cycles for copper, central-bank reserve diversification for gold).
Construction & Components
The Copper-Gold Ratio is a simple price ratio between two commodities measured in different units, with a scaling factor applied for readability. No deflation or seasonal adjustment is used.
Formula:
Copper-Gold Ratio = (Copper Price [USD/metric ton] / Gold Price [USD/troy ounce]) × 1000
Components:
- Copper price — FRED series
PCOPPUSDM, the global copper price published by the IMF in its Primary Commodity Price System, USD per metric ton. Used as published, without unit conversion. Source frequency: monthly. - Gold price — World Bank Pink Sheet monthly gold price, USD per troy ounce. London Bullion Market Association (LBMA) PM fixing, averaged across the month. Source frequency: monthly.
Frequency reconciliation: Both components are natively monthly, so no interpolation or aggregation step is required. Observations are matched on month-end timestamp and the ratio is computed directly. The ×1000 scaling produces values that read in the 100–500 range across most of the sample, more interpretable than the raw small fraction.
Coverage: January 1992 to present, 415 monthly observations to July 2026. The start date is set by the copper leg: the IMF series PCOPPUSDM begins in January 1992. The World Bank Pink Sheet gold series runs from 1960, but the ratio can only start where both legs exist.
Dataset Overview
| Indicator | Copper-Gold Ratio (1992–2026) |
|---|---|
| Geography | Global |
| Frequency | Monthly |
| Period | 1992–2026 |
| Variables | date, copper_price, gold_price, copper_gold_ratio |
| Format | CSV, Excel (XLSX) |
| Sources | IMF Primary Commodity Price System, via FRED PCOPPUSDM (copper) + World Bank Pink Sheet (gold) |
| Last updated | — |
Dataset Variables
The CSV and Excel files contain the following columns.
| Column | Type | Description |
|---|---|---|
date | Date (YYYY-MM-DD) | Observation date |
copper_price | Float | Copper price (USD per metric ton) |
gold_price | Float | Gold price (USD/oz) |
copper_gold_ratio | Float | Copper/Gold ratio (×1000) |
Column names match the CSV headers exactly.
Where the Latest Ratio Sits in the Distribution
Because the ratio has trended down since 2006, a reading that looks low against the full record can be ordinary against the last decade. This tool places the latest copper to gold ratio inside the distribution of monthly readings for the window you choose, and reports its percentile rank, the window median and the dated extremes.
The July 2026 ratio of 3,325 sits at the 6th percentile of the 415 months since January 1992, whose median is 5,307, and at the 30th percentile of the last five years, median 4,138. The record high is 12,794 in October 2006, the low 2,580 in February 2026.
Download the Complete Dataset
The full dataset is available in CSV and Excel formats.
Direct CSV Access — Eco3min Structured Dataset
https://eco3min.fr/dataset/copper-gold-ratio.csv
This URL returns the complete pre-computed ratio in CSV format. It can be used directly in pandas, R, curl, or any data tool. Note that the gold price component is sourced from the World Bank Pink Sheet rather than FRED, so no single FRED CSV reproduces the full composite.
Using the Dataset in Python
import pandas as pd

url = "https://eco3min.fr/dataset/copper-gold-ratio.csv"
df = pd.read_csv(url, parse_dates=["date"])

print(df.head())
print(df["copper_gold_ratio"].describe())
Using the Dataset in R
library(readr)

url <- "https://eco3min.fr/dataset/copper-gold-ratio.csv"
df <- read_csv(url)

head(df)
summary(df$copper_gold_ratio)
Both examples load the dataset directly from the URL — no download or API key required.
Methodology
The Copper-Gold Ratio is recomputed monthly by an Eco3min pipeline that pulls PCOPPUSDM from the FRED API and gold prices from the World Bank Commodities Pink Sheet release. The copper price is used as published, in USD per metric ton, without unit conversion. The two series are matched on month-end and divided, with the ×1000 scaling applied. The pipeline runs after each World Bank Pink Sheet release (typically the first week of each month).
Both inputs are monthly averages of daily spot prices, which smooths intra-month volatility but means the composite cannot detect short-lived dislocations.
Data Quality & Provider Notes
Latency for the Copper-Gold Ratio is dictated by the slower of the two components, typically the World Bank Pink Sheet (~1-week lag after month-end). The FRED-distributed IMF copper series is usually available within a few days of the same window.
Both components are revised infrequently, but spot-price benchmarks (LBMA PM fixing for gold, LME or Comex settlement for copper) can be re-stated for quality control purposes. The Eco3min pipeline back-stamps any such revisions to keep the composite consistent with the latest source release.
A daily-frequency Copper-Gold Ratio can be constructed from Comex futures or LBMA gold fixings combined with LME copper, but it diverges from the monthly composite during high-volatility weeks. The breakdown is provided in this analysis of silver volatility gold ratio. The monthly version is the standard reference used in published macro research and is more comparable across long-horizon backtests.
What This Index Captures (And What It Doesn’t)
The Copper-Gold Ratio is a parsimonious cross-asset macro signal — a single number that summarizes the relative pricing of two metals with opposite cyclical exposures. Its appeal is its simplicity; its limitations come from the same source.
What it captures:
- The relative pricing of cyclical (copper) versus defensive (gold) commodity demand
- Coincident shifts in global growth expectations as priced by physical-commodity markets
- Long-horizon comparability across commodity supercycles, since both metals span the same historical window
- A simple cross-check on whether Treasury yields, equity-cyclicals, and PMI readings are pointing in consistent directions
What it does NOT capture (common misinterpretations):
- A direct timing signal. Historical correlation with Treasury yields is well-documented but unstable across regimes. Periods of structural divergence (2011–2015, 2020–2022) are not rare and can persist for years.
- Pure growth expectations. Copper prices are influenced by Chinese inventory and stimulus cycles, supply-side shocks (Chilean strikes, Peruvian disruption), and the energy transition demand for electrification. Gold prices reflect real rates, dollar strength, and central-bank reserve flows. The ratio mixes all of these.
- Equity-market direction. The ratio is a commodity-derived signal, not an equity indicator. Mapping it onto sector rotations or risk-on/risk-off equity flows is an inferential step, not a direct read.
- Causal information. The Copper-Gold Ratio is a price ratio, not a forecast. It coincides with growth signals rather than leading them — it tells you what is priced now, not what will happen next.
The Copper-Gold Ratio is best used as one cross-asset confirmation among several in a broader macro-regime framework, not as a standalone allocation signal.
Historical Regimes
The Copper-Gold Ratio spans more than three decades, from January 1992 to today. Regime classification is approximate, since both metals exhibit long cycles with overlapping drivers. The full account is given in copper and oil as macro bellwethers.
- 1992–2002 — Disinflation-era range. Annual averages held between roughly 4,900 and 7,600 with no sustained trend, through the US expansion, the Asian crisis and the 2001 recession.
- 2003–2008 — China supercycle. Copper appreciated dramatically as Chinese infrastructure investment surged; the ratio reached its sample high of 12,794 in October 2006. Gold also rose but more slowly — copper outperformance was structural. More context: Iron ore versus copper as a China signal.
- 2008–2009 — GFC collapse. The ratio fell sharply in late 2008 as copper collapsed and gold held up. Among the cleanest regime transitions in the series.
- 2011–2019 — Post-crisis range. The ratio oscillated in a narrow band as both metals traded sideways relative to each other. Period of mild divergence with Treasury yields.
- 2020–2022 — Reflation-then-fear. Sharp drop in March 2020, sharp recovery on stimulus and the green-energy demand narrative, then renewed weakness as China stimulus disappointed in 2022.
- 2023–2026 — Electrification-versus-fear tension. The ratio has reflected two opposing forces: structural copper demand from electrification and EVs versus persistent gold strength tied to central-bank reserve diversification and elevated geopolitical risk. Gold has had the upper hand over this stretch: the ratio set its sample low of 2,580 in February 2026, and averaged 2,871 over the first seven months of that year.
Related Macroeconomic Datasets
The Copper-Gold Ratio sits within a broader commodity-and-growth complex. Cross-checking with individual commodity prices and the dollar-cycle helps isolate which component is driving any given regime shift.
- Copper Price History — the cyclical numerator
- WTI Crude Oil Price — the other major industrial-cyclical commodity
- Brent Crude Oil Price — global oil benchmark
- Real Crude Oil Price — WTI adjusted for CPI inflation
- Natural Gas Price History — energy demand complement
- US Dollar Index (DTWEXBGS) — dollar cycle context for commodity pricing
Macroeconomic Dataset Hub
This dataset is part of the Eco3min macro-financial data repository.
Explore the Eco3min Dataset Hub
Sources
- IMF Primary Commodity Prices, Global Price of Copper (FRED: PCOPPUSDM)
- World Bank Commodities Price Data (Pink Sheet), Gold price, USD/oz
Dataset Reference
Last updated — 22 September 2026
Disclaimer – Financial Information: The analyses, commentary, and content published on eco3min.fr are provided for informational and educational purposes only. They do not constitute investment advice or a solicitation to buy or sell financial instruments. Past performance is not indicative of future results. All investment decisions involve risk and are the sole responsibility of the reader.
Source terms. This series is produced by the International Monetary Fund (Primary Commodity Price System) and redistributed here under the IMF Terms and Conditions for the Use of IMF Data. Attribution to the IMF is required, the integrity of the data must be preserved, and these same conditions apply to any onward distribution. It is not available under a Creative Commons licence. Full terms.