
Iron Ore vs Copper: Which Metal Reads China Best?

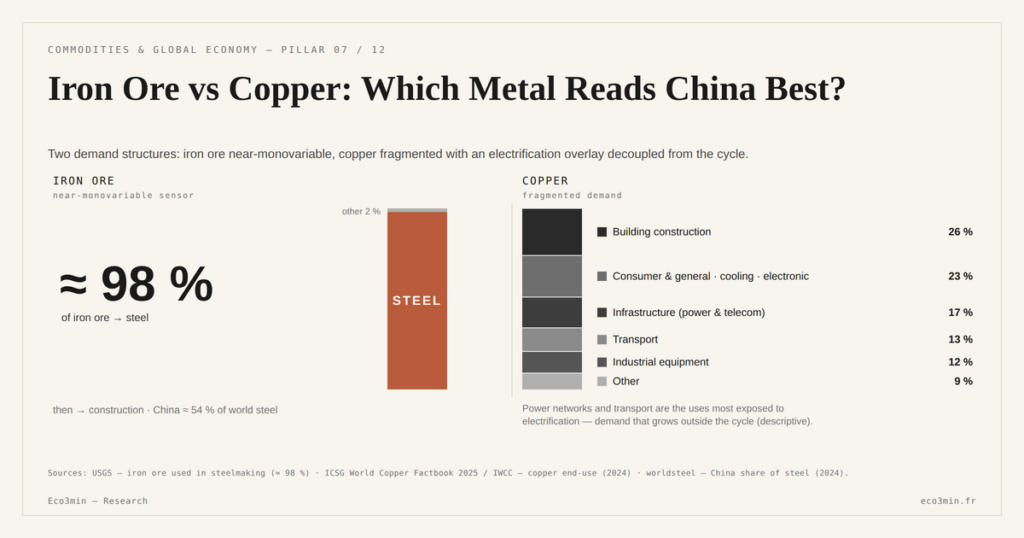
Copper and iron ore are both read as barometers of the industrial cycle. But electrification has given copper a demand layer that blurs its signal, where iron ore remains a near-pure sensor of Chinese construction. The two metals no longer say the same thing.
TL;DR
Iron ore's near-monovariable demand makes it a trustworthy read on Chinese construction, while copper's electrification layer turns it into a richer but noisier gauge of the global cycle.
- When the two diverge, copper supported while iron ore retreats, the gap isolates fading Chinese construction from electrification-linked demand that holds.
- Iron ore goes close to 98% into steel and gains no transition overlay; green steel only shifts the split between grades, while copper's structural demand keeps running through the cycle.
- The discipline is to match the question to the instrument: iron ore answers a narrow question sharply, copper a broad one with caveats.
Comparing iron ore and copper means understanding why two supposedly interchangeable indicators have diverged: one measures a global transition, the other a Chinese sector. Their gap has become information in itself.
Two metals, two messages
For a long time, iron ore and copper were read as two versions of the same indicator: industrial metals whose prices rise when the world economy accelerates and fall when it slows. Copper, nicknamed “Dr Copper” for its reputation as a cyclical diagnostician, and iron ore, the thermometer of steelmaking, seemed to carry a converging message about the health of the cycle. That equivalence now belongs to the past. The two metals have seen their demand functions diverge to the point of measuring distinct realities.
The “Dr Copper” reputation rested on a simple logic: because copper enters almost every industrial activity — building, machinery, electronics, wiring — its price aggregated the state of the real economy better than any other metal. That diagnostic quality assumed, however, that copper demand tracked the cycle. It held in a world where most consumption served cyclical uses. The emergence of structural electrification demand has weakened that property: copper remains an excellent indicator, but of a more composite reality than in the era that earned it its nickname.
The reason lies in the composition of demand. Iron ore goes close to 98% into making steel, and that steel goes mostly into construction, dominated by China. Copper, by contrast, is split among construction, power grids, vehicles, electronics and capital goods, across a far wider geographic spread. That structural difference was not decisive as long as all these uses moved together with the cycle. It became decisive once part of copper demand began to grow for reasons unrelated to the classic cycle.
Copper’s electrification overlay
What transformed copper is electrification. The energy transition added to its traditional demand a structural layer that no longer depends on the conjuncture: densifying power grids, electrifying the vehicle fleet, deploying renewables, multiplying data centres. These uses consume copper for long-term reasons — decarbonization, digital transition — that continue even when growth sags. A grid keeps being reinforced, an electric-vehicle maker keeps its lines running, a solar farm goes up, regardless of where the cycle stands.
The scale of this new demand is not marginal. An electric vehicle carries several times the copper of a combustion one; a wind or solar installation requires high tonnages per unit of installed capacity; data centres and grid modernization add a continuous draw. As these uses scale up, they account for a growing share of world copper consumption — a share that follows the curve of the transition, not that of the cycle. It is this rise that has progressively dissociated the copper price from the traditional industrial conjuncture.
This overlay deeply changes what the copper price signals. Part of its demand is now decoupled from the conventional industrial cycle, which makes interpretation trickier: a rise in copper can reflect an acceleration in the economy, or simply the ramp-up of the transition, or both. Copper has become a richer indicator — it captures a major structural dynamic — but a noisier one, because its message blends several drivers. The detail of that dynamic is the subject of a specific analysis of copper’s structural electrification demand, which separates what in the price belongs to the cycle from what belongs to the transition.
Why iron ore has no equivalent
Iron ore has no comparable overlay. Steel decarbonization exists — direct reduction of ore, the use of hydrogen, so-called green pathways — but it does not create an additional demand layer. On the contrary: green steel still consumes iron units, and rather high-grade ore, better suited to direct-reduction processes. The transition, on the iron side, merely shifts the split between grades; it adds no demand driver layered on top of the construction cycle.
The result is that iron ore stays anchored to one dominant variable: Chinese building activity. Where copper carries a double message, iron ore carries a simple one. It is this absence of a transition filter that makes it the cleanest sensor of China — a point developed in our study of the purest construction signal. The flip side is familiar: what iron ore gains in sharpness on China, it loses in reach on the global cycle. It says almost nothing about US or European growth, where copper, through its diversified demand, retains value as a global signal.
This narrowness is worth restating as a strength, not a defect. An instrument that isolates a single variable is, for that variable, more reliable than one that aggregates several. Iron ore will not tell you whether global manufacturing is turning, but it will tell you, with little interference, whether Chinese construction is. The value of a gauge lies in knowing exactly what it measures; iron ore’s near-monovariable demand is precisely what makes its reading trustworthy on its own terms.
Divergence as a signal
From this asymmetry comes a powerful reading tool: the gap between the two metals. When copper and iron ore move together, they confirm a broad move in the industrial cycle — an acceleration or slowdown touching both Chinese construction and global metals demand. When they diverge, the gap isolates precisely what distinguishes their two demands.
One configuration has become emblematic: copper supported while iron ore retreats. This is no paradox: it describes a Chinese economy whose construction is fading — what iron ore reads — while global demand for electrification-linked metals holds up — what copper captures. Reading the gap therefore separates the China-construction signal from the global-transition signal, where each metal taken alone would blend them. Copper, through its sensitivity to the financial cycle and to rates, also serves as the basis for other macro readings, such as the copper-gold ratio macro signal, which exploits the red metal’s financial dimension.
This divergence frame has a virtue: it turns a difficulty — the blurring of the copper signal by electrification — into usable information. Rather than seeking a cycle diagnosis in copper alone, one reads the relative position of the two metals. Iron ore supplies the China-construction anchor; copper, the global and structural dimension. Their gap tells which of the two dynamics dominates at a given moment.
The divergence frame nonetheless has limits. The two metals share common factors — the dollar, global financial conditions, metal-specific supply shocks — that can move them together for reasons unrelated to Chinese demand or the transition. A currency move or a mining disruption specific to one of them can blur the reading of the gap. Divergence is a diagnostic tool, not an exact measure: it points to a direction, provided one checks that a common factor does not explain it before reading it as information about underlying demand.
- Iron ore (close to 98% destined for steel, itself dominated by Chinese construction) and copper (demand split among construction, grids, vehicles, electronics) no longer measure the same reality.
- Electrification has given copper a structural demand layer decoupled from the cycle; iron ore has no equivalent, green steel only shifting the split between grades.
- Iron ore is the cleanest read on China but the narrowest on the global cycle; copper is broader but noisier.
- The gap between the two metals is information: it separates the China-construction signal from the global-transition signal that each metal alone would blend.
Using each signal well
The practical conclusion is not that one metal is better than the other, but that they serve different, complementary readings. For anyone seeking a diagnosis of Chinese construction, iron ore offers a near-pure sensor, stripped of the transition filter. For anyone seeking a barometer of the global cycle laced with the electrification dynamic, copper remains the richest instrument, provided one accepts its ambiguity. Confusing the two — expecting from copper iron ore’s sharpness on China, or from iron ore copper’s global reach — leads to misreadings.
In practice, the two are best read side by side rather than in isolation. Iron ore answers a narrow question sharply; copper answers a broad question with caveats. Watched together, they let an observer locate where in the system a move originates — Chinese building, the global cycle, or the transition — instead of forcing one metal to carry a message it is no longer equipped to send alone. The discipline is to match the question to the instrument, and to read the gap when the two disagree.
This reading requires knowing the underlying market of each metal: its producers, its buyers, its price formation. For iron ore, those markers — a seaborne good, Chinese demand, the 62% Fe benchmark — are set out in our presentation of the structure of the iron ore market. Placed within the wider set of physical resources, treated inside the geoeconomics of physical resources, the iron-copper comparison illustrates a general rule: two indicators are interchangeable only as long as their demands remain parallel, and the energy transition has precisely broken that parallelism.
Last updated — 28 June 2026
Disclaimer – Financial Information: The analyses, commentary, and content published on eco3min.fr are provided for informational and educational purposes only. They do not constitute investment advice or a solicitation to buy or sell financial instruments. Past performance is not indicative of future results. All investment decisions involve risk and are the sole responsibility of the reader.
Read next
Full pillar →Reading the refinery utilisation rate: the threshold, the season, the turnarounds
A refinery runs full near ninety percent, not a hundred: the last slice of nameplate capacity is a…
IMO 2020: the regulatory shock that rewrote product spreads
An environmental rule on marine sulfur can move a refining spread more than a swing in crude. IMO…
The 2022–2023 refining golden age: anatomy of an episode
In 2022, refined fuel prices climbed faster than crude. That gap, measured by the 3-2-1 crack spread, reached…


