
Every US bank failure since 1934
Deposit insurance began on 1 January 1934. Since that day the FDIC has recorded 4,117 closures of insured institutions, of which 2,499 were commercial bank failures. This register lists every one, and sets each against the monetary regime of its year.
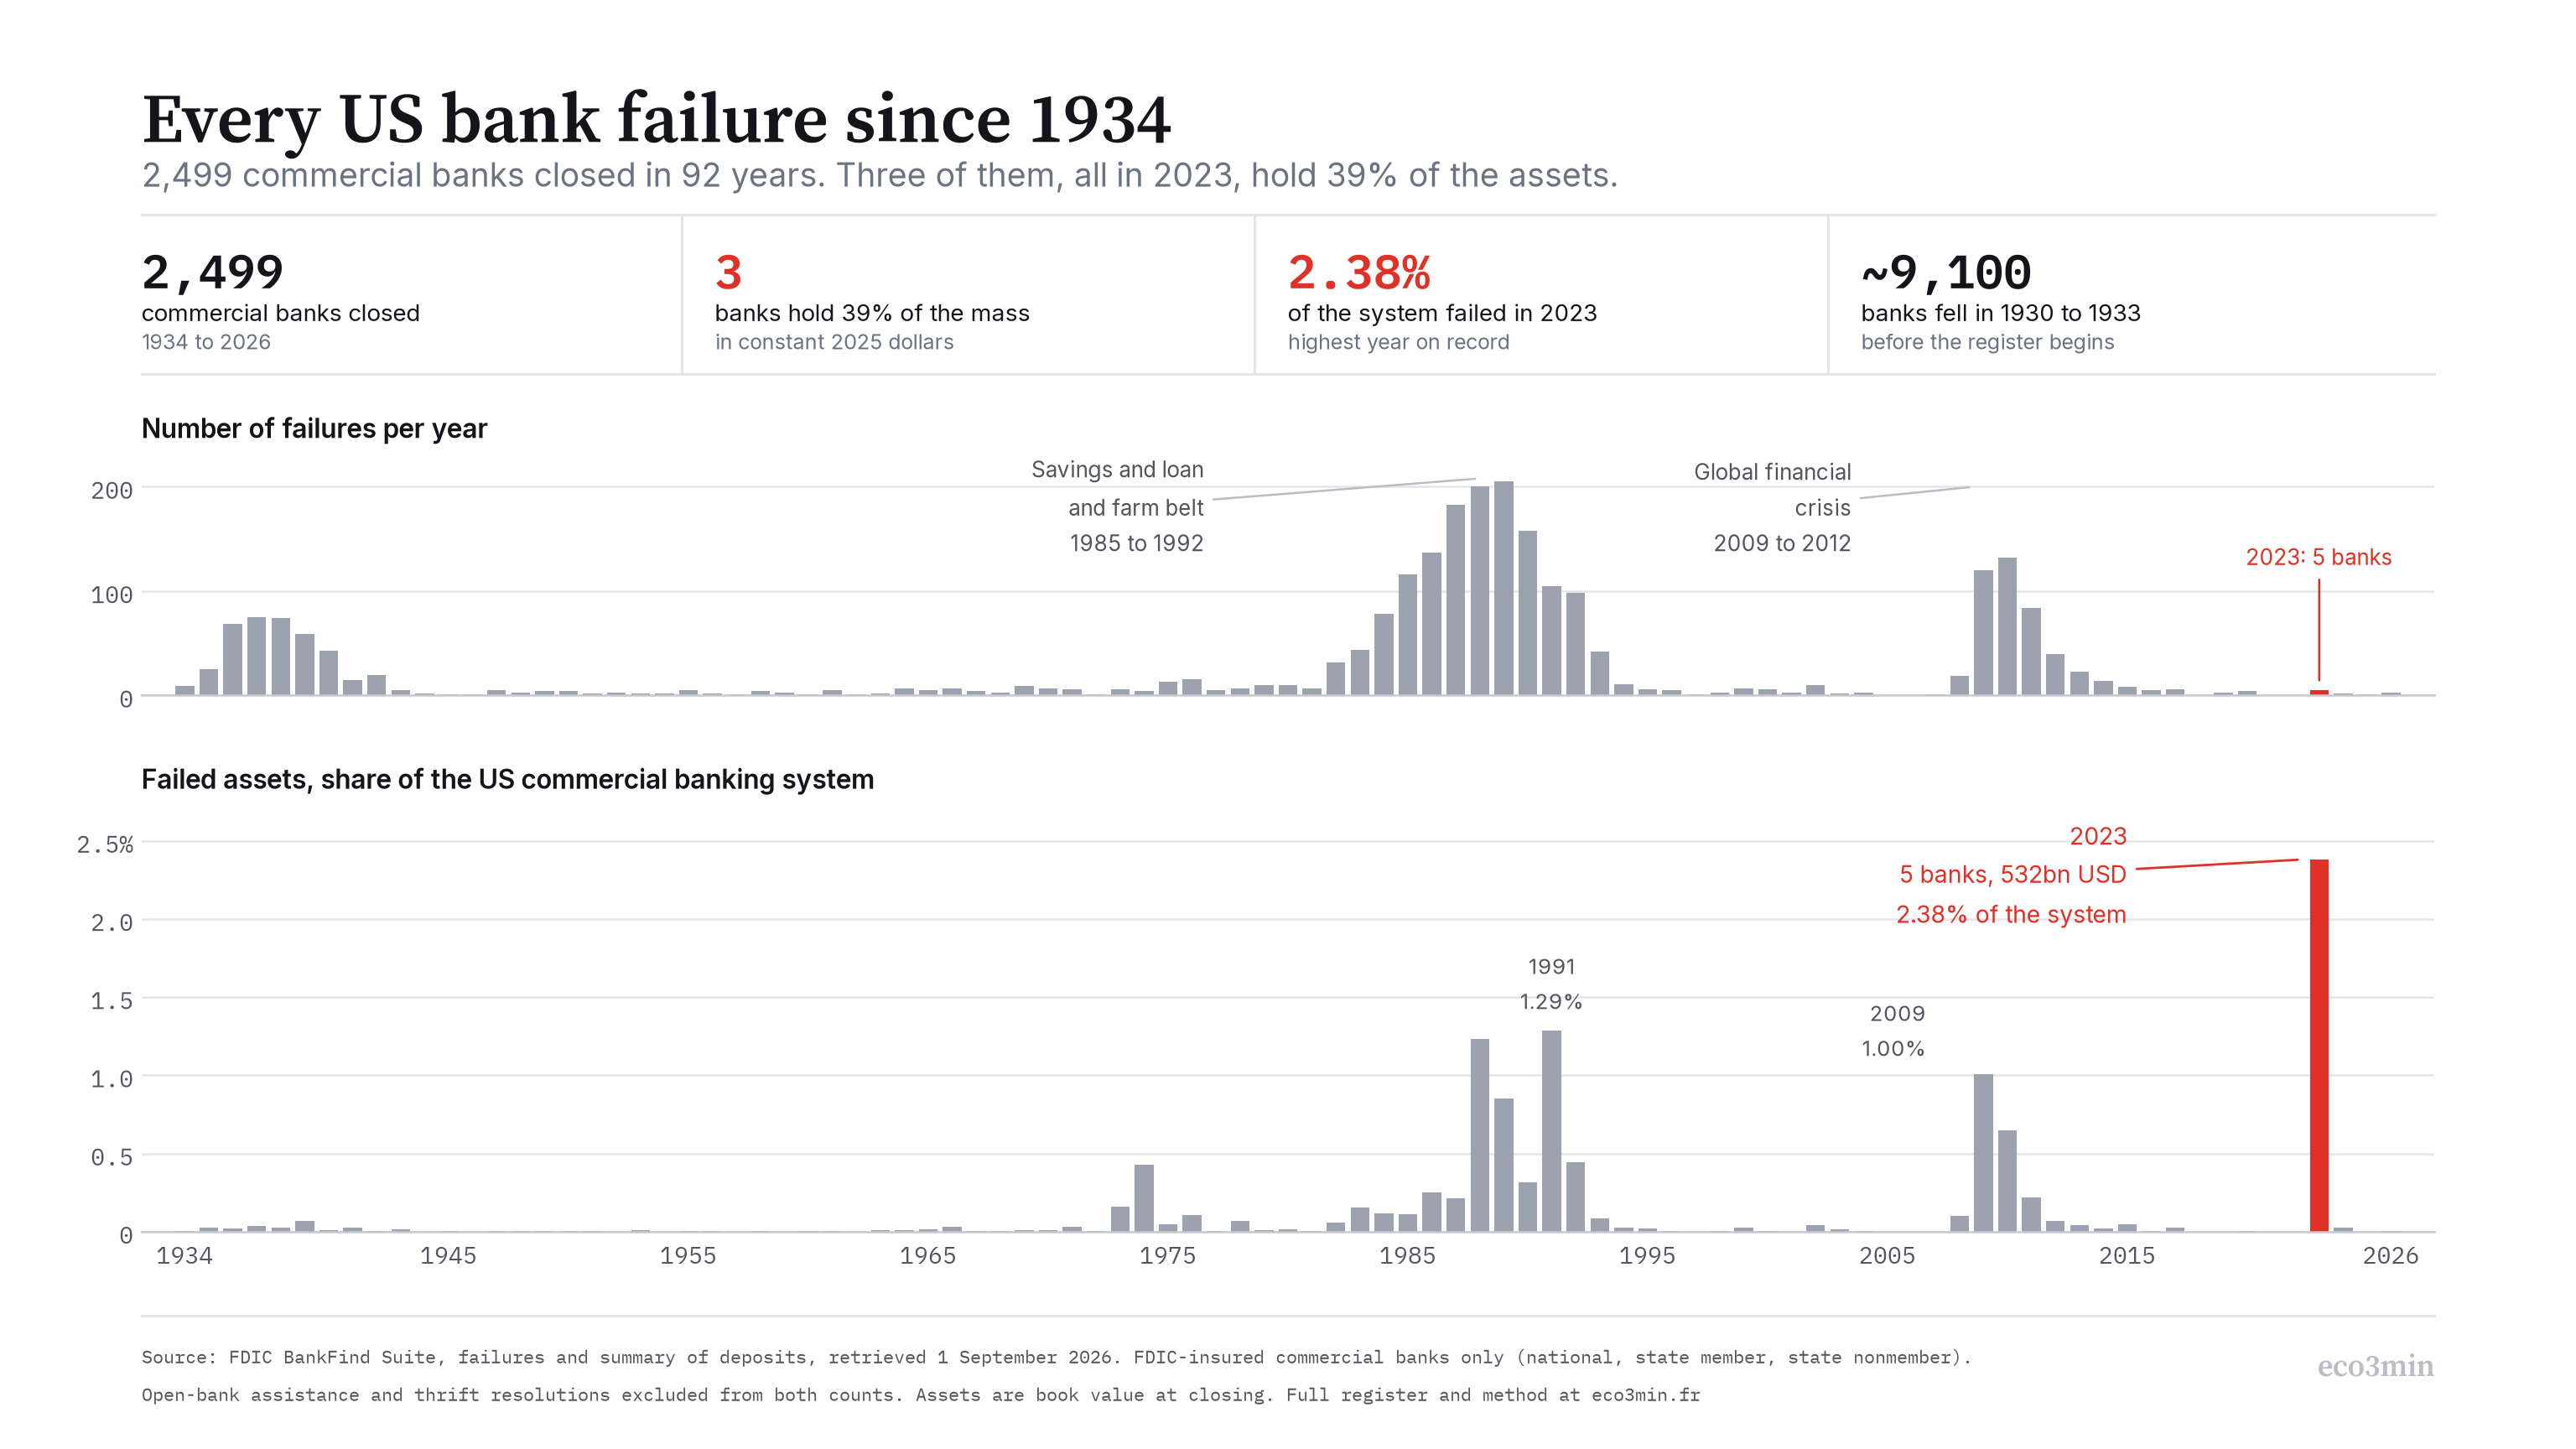
Ranked by number of banks, the worst years are 1989 and 2010. Ranked by assets, the worst year is 2023, and the gap is not close.
Three banks failed in the spring of 2023. In constant dollars they hold 38.6% of every asset ever lost to commercial bank failure since 1934.
- 2,499 FDIC-insured commercial banks failed between 1934 and 2026. Around 9,100 more suspended between 1930 and 1933, before insurance existed, and the register cannot see them.
- 2023 took 2.38% of US commercial banking assets, the highest share of any year on the register. Second is 1991, at 1.29%.
- Counted per bank, failures cluster under a steep curve: 44.7 per 10,000 a year, against 5.2 when the curve is inverted.
- Failure is not loss. Silicon Valley Bank and First Republic were sold within days, and their depositors were made whole.
Three banks, thirty-nine per cent
The register holds 2,499 commercial bank failures across 92 years. Book value of assets at closing, added up in current dollars, comes to 984.7bn USD. Three institutions that failed within eight weeks of each other in 2023 account for 54.0% of it. Deflate every line to constant 2025 dollars, which is the only fair way to add up ninety-two years, and the same three still hold 38.6%.
| Date | Institution | State | Assets, bn USD | Cost to fund, bn USD | Acquirer | |
|---|---|---|---|---|---|---|
| 2023-05-01 | First Republic Bank | CA | 212.6 | 15.5 | Jpmorgan Chase Bank, N.A. | |
| 2023-03-10 | Silicon Valley Bank | CA | 209.0 | 18.7 | First-Citizens Bank & Trust Company | |
| 2023-03-12 | Signature Bank | NY | 110.4 | 0.0 | Flagstar Bank, N.A. | |
| 2009-08-14 | Colonial Bank | AL | 25.5 | 2.4 | Bb&T | |
| 1988-07-29 | First Republicbank-Dallas, N.A. | TX | 17.1 | 2.0 | Ncnb Texas National Bank | |
| 1991-01-06 | Bank Of New England, National Assoc | MA | 13.4 | 0.6 | New Bank Of New England, Na | |
| 1991-09-19 | Southeast Bank, National Association | FL | 11.0 | 0.0 | First Union National Bank O | |
| 2009-11-06 | United Commercial Bank | CA | 10.9 | 0.6 | East West Bank | |
| 2010-04-30 | Westernbank Puerto Rico | PR | 10.8 | 2.2 | Banco Popular De Puerto Rico | |
| 2009-10-30 | California National Bank | CA | 7.8 | 0.2 | U.S. Bank, Na | |
| 1991-01-06 | The Connecticut Bank & Trust Co | CT | 7.2 | 0.2 | New Connecticut Bank & Trus | |
| 2009-09-11 | Corus Bank, N.A. | IL | 7.0 | 0.0 | Mb Financial, N.A. |
First Republic Bank is the largest commercial bank the FDIC has ever closed. Silicon Valley Bank follows two months earlier, Signature Bank two days after that. Washington Mutual was bigger than all three at 307.0bn USD in September 2008, and it is absent from this table for a reason worth stating: it was a savings bank, and thrifts are held apart from the commercial bank series throughout this page. Continental Illinois is absent for a different reason. The bank that gave the phrase too big to fail its meaning in 1984 was never resolved as a failure. The FDIC recorded it as open bank assistance, and the register keeps that distinction.
What the register counts, and what it cannot
Federal deposit insurance took effect on 1 January 1934, covering 12,551 commercial banks. The four years before that date are the reason it exists. The FDIC counts about 1,350 bank suspensions in 1930, 2,300 in 1931, 1,450 in 1932 and 4,000 in 1933, of which 3,800 had already happened by 16 March. Roughly 9,100 banks in four years, against 2,499 in the ninety-two that followed. Every superlative on this page carries that boundary with it: the register opens the day the problem it documents had already peaked. In the companion register of US government shutdowns since 1976, the counting convention alone moves the longest episode from 75 to 76 days, and the boundary is printed next to the number.
Three further exclusions shape the counts, and each is reversible in the published file.
- 593 rows are open bank assistance, not failures. Bank of America and Citibank appear among them in 2008 and 2009, with balance sheets above a trillion dollars. Counting assistance as failure would put two of the largest banks in the country at the top of a failure register they never entered.
- 1,025 failures were savings institutions, savings and loans or savings banks, and 559 of them were resolved by the Resolution Trust Corporation rather than the deposit insurance fund. They stay in the downloadable register, flagged, and out of every rate on this page, because the denominator of insured thrifts is not published far enough back to match them.
- Assets are book value on the last regulatory report before closing. Not market value. For a bank that failed on the gap between the two, that distinction is not a footnote, it is the mechanism.
A failure register that counts institutions measures the health of small banks, not the size of banking crises.
Counted banks, weighed banks
Rank the 92 years by how many banks failed, then rank them again by how much of the banking system failed, and the two lists barely overlap.
| Year | Failures | Rate per 10,000 | Share of system assets | Rank by rate | |
|---|---|---|---|---|---|
| 2023 | 5 | 12.4 | 2.38% | >10 | |
| 1991 | 105 | 88.2 | 1.29% | 9 | |
| 1988 | 200 | 152.4 | 1.23% | 4 | |
| 2009 | 120 | 176.1 | 1.00% | 2 | |
| 1989 | 205 | 161.5 | 0.85% | 3 | |
| 2010 | 132 | 202.9 | 0.65% | 1 | |
| 1992 | 98 | 85.6 | 0.45% | 10 | |
| 1974 | 4 | 2.8 | 0.43% | >10 | |
| 1990 | 158 | 128.2 | 0.32% | 7 | |
| 1986 | 137 | 96.5 | 0.25% | 8 |
2010 is the worst year the register has by rate: 202.9 failures per 10,000 insured commercial banks. By assets it ranks sixth, at 0.65%. Run it the other way and 2023 is first by assets at 2.38%, and does not reach the top ten by rate at all, at 12.4 per 10,000. Counting bank failures and weighing them tell two different histories.
The insurance fund follows the mass, not the count. The five commercial banks that failed in 2023 cost it 34.3bn USD as the FDIC estimated the loss at 31 July 2026, against 17.0bn for the 120 banks of 2009, or 25.5bn once 2009 is restated in 2025 dollars. Two banks in one spring outweighed a wave that took two years and sixty times as many institutions. Weight rather than number is the scale on which systemic fragilities are read, and where the word systemic earns its meaning.
Where the failures sit in the monetary cycle
Each line of the register carries the monetary regime of its year: the real three-month rate, the slope of the yield curve, the Baa to Aaa corporate spread. Sorting the ninety-two years by the shape of the curve produces the result that runs hardest against intuition.
| Curve in that year | Years | Failures | Rate per 10,000 | Rate excluding 1984 to 1994 | |
|---|---|---|---|---|---|
| Inverted, below 0 | 6 | 34 | 5.2 | 5.2 | |
| Flat, 0 to 1 point | 26 | 298 | 11.2 | 3.7 | |
| Normal, 1 to 2 points | 27 | 427 | 14.0 | 4.7 | |
| Steep, above 2 points | 34 | 1,740 | 44.7 | 31.4 |
An inverted curve is the most-cited recession signal in finance, and it is the regime in which American commercial banks fail least: 5.2 per 10,000 a year, against 44.7 under a steep one. A factor of 8.6. The gap is not an artefact of the savings and loan wave either: strip out 1984 to 1994 entirely and the steep-curve rate falls to 31.4, still six times the inverted-curve rate, which does not move at all because none of the six inverted years falls inside that window.
Push the measurement forward in time and the shape of the thing appears. Take the six years in which the curve was inverted, then read the failure rate one, two and three years later: 5.2 in the year itself, 9.5 the year after, 12.9 two years on, 21.8 after three. Banks do not break during the inversion. They break on the way out of it, once the central bank has already started cutting and the curve has re-steepened.
2023 is the exception that gives the register its shape. Five commercial banks failed that year with the curve inverted by -1.11 points on the annual average, and it is still the heaviest year in ninety-two. A rate shock and a credit cycle do not kill the same banks, and they do not kill them at the same point in the cycle. The shock takes a few large ones quickly, through the funding side. The credit cycle that follows takes many small ones slowly, through the loan book. It is that cycle, more than the rate shock, that the countercyclical buffers born of the logic of macroprudential policy are aimed at.
Interactive register, 1934 to 2026. Switch the measure, move across the chart for the reading of a single year. The strip below the axis marks the years the yield curve was inverted.
What this does not prove
The curve is not an exogenous variable and this page does not treat it as one. It re-steepens because the central bank is cutting in response to the shock that is already breaking banks. Steepness does not cause failures. It dates them, which is the entire claim being made here and the reason the finding survives the objection rather than dissolving under it.
Four more limits, stated rather than buried.
- Six inverted years is a thin sample: 1973, 1974, 1979, 1981, 2023 and 2024. The lag result rests on a handful of episodes and should be read as a description of those episodes, not as a law.
- The 2.38% of 2023 is assets that changed hands, not assets destroyed. Two of the three banks were sold inside a weekend.
- Signature Bank carries a cost of zero in the FDIC file as revised to 31 July 2026. That field is the estimated loss to the insurance fund after the receivership has sold what it could, and it is not the same measure as the special assessment the FDIC levied in 2023. The register publishes the FDIC value and substitutes nothing for it.
- 2026 is incomplete. It runs to the last FDIC index of 25 August 2026 and will move.
A bank failure is read as money destroyed. It is a change of ownership under receivership, and the loss is only the shortfall the insurance fund absorbs. Of the 532bn USD that failed in 2023, the fund records 34.3bn as its own loss.
Method, and the register itself
Failures come from the FDIC BankFind Suite failures endpoint, index built 25 August 2026, retrieved on 1 September 2026: 4,117 rows, 1934 to 2026. Every field on this page is FDIC data. Nothing is filled in from a secondary source, and lines with a missing field carry the gap rather than an estimate.
The denominator, the number of insured commercial banks each year, comes from the FDIC aggregate series behind its Historical Statistics on Banking: 14,146 at the end of 1934, 3,798 at the end of 2025. Rate variables come from the Federal Reserve Bank of St Louis: the three-month Treasury bill, the ten-year Treasury constant maturity from April 1953, the long-term US government securities yield before it, the Baa and Aaa corporate indices, and the consumer price index for both the real rate and the constant-dollar restatement. The splice in the long yield is disclosed in the yearly file, in a column that names the source used for each year.
Assets at closing are missing for 150 of the 2,499 commercial bank failures: 149 of them between 1935 and 1942, plus a single case in 1962. The acquirer field is empty for every failure before 1980, because the FDIC did not record it. Estimated cost to the fund does not exist at all before 1980: any statement about cost on this page is bounded by that date, and any statement about counts is not.
Questions on the register
How many US banks have failed since 1934?
The FDIC records 4,117 closures of insured institutions between 1934 and 2026. 3,524 of them are failures and 593 are open bank assistance transactions. Within the failures, 2,499 were commercial banks and 1,025 were savings institutions.
What was the largest bank failure in US history?
By assets at closing, Washington Mutual in September 2008, at 307.0bn USD. It was a savings bank. The largest commercial bank failure is First Republic Bank in May 2023, at 212.6bn USD, followed by Silicon Valley Bank at 209.0bn. Continental Illinois in 1984 was larger than either at the time but the FDIC resolved it as open bank assistance, so it does not appear in the failure counts.
Was 2023 a bigger banking crisis than 2008?
The two years measure differently. By number of commercial banks, 2008 and the years that followed are far larger: 120 failures in 2009 and 132 in 2010, against 5 in 2023. By share of banking system assets, 2023 is the highest year in the register at 2.38%, ahead of 2009 at 1.00%. By estimated cost to the insurance fund, 2023 is also first, at 34.3bn USD.
Do bank failures happen when the yield curve inverts?
Not in the same year, on this data. Across 1934 to 2026, commercial banks failed at 5.2 per 10,000 a year in years when the curve was inverted, and at 44.7 when it was steep. Reading the same inverted years three years later gives 21.8 per 10,000. The curve re-steepens because the central bank cuts in response to the shock, so the relationship is one of timing rather than cause.
How much does a bank failure cost the FDIC?
The FDIC publishes an estimated loss to the insurance fund per failed institution, revised as the receivership sells assets. The field begins in 1980. Across commercial bank failures from 1980 to 2026 the estimates total 107.4bn USD. Deposit insurance covers 250,000 USD per depositor, per insured bank, per ownership category, a level made permanent by the Dodd-Frank Act in July 2010.
The register was built to answer a narrow question, whether American bank failures concentrate in high real rates or in the exit from low ones, and it answered a different one. Both, but not the same failures. The 1980s and the 2010s produced long tails of small closures in the wake of a monetary turn. 2023 produced three very large ones during it. A register that only counts institutions records the first and misses the second entirely, which is most of what there is to say about why banking crises are so often described after the fact as smaller than they were.
Related reading on this site: how FDIC insurance actually pays a depositor, the 2023 regional bank episode set against 2008, the Silicon Valley Bank timeline hour by hour, what a concentrated deposit base does to a balance sheet, the mechanics that make a run self-fulfilling, and the companion register of S&P 500 drawdowns since 1950. The wider frame sits in the pillar on monetary regimes, rates and liquidity cycles.
Last updated — 19 September 2026
Disclaimer – Financial Information: The analyses, commentary, and content published on eco3min.fr are provided for informational and educational purposes only. They do not constitute investment advice or a solicitation to buy or sell financial instruments. Past performance is not indicative of future results. All investment decisions involve risk and are the sole responsibility of the reader.