
Every Fed Pause Since 1971: What Markets and the Economy Did Next
Each time the Federal Reserve stops raising interest rates and holds, the same question returns: is the pause the start of the pivot? Markets tend to answer yes, and to price the hold as a dovish, risk-on signal.
But a “pause” is a classification, not an event — and once the definition is fixed and every pause since 1971 is lined up, the historical record is more divided than the reflex implies. This page is a reference catalogue: for each pause, how long the Fed held, whether it cut or resumed hiking, and what the S&P 500, unemployment and inflation did over the following six and twelve months.
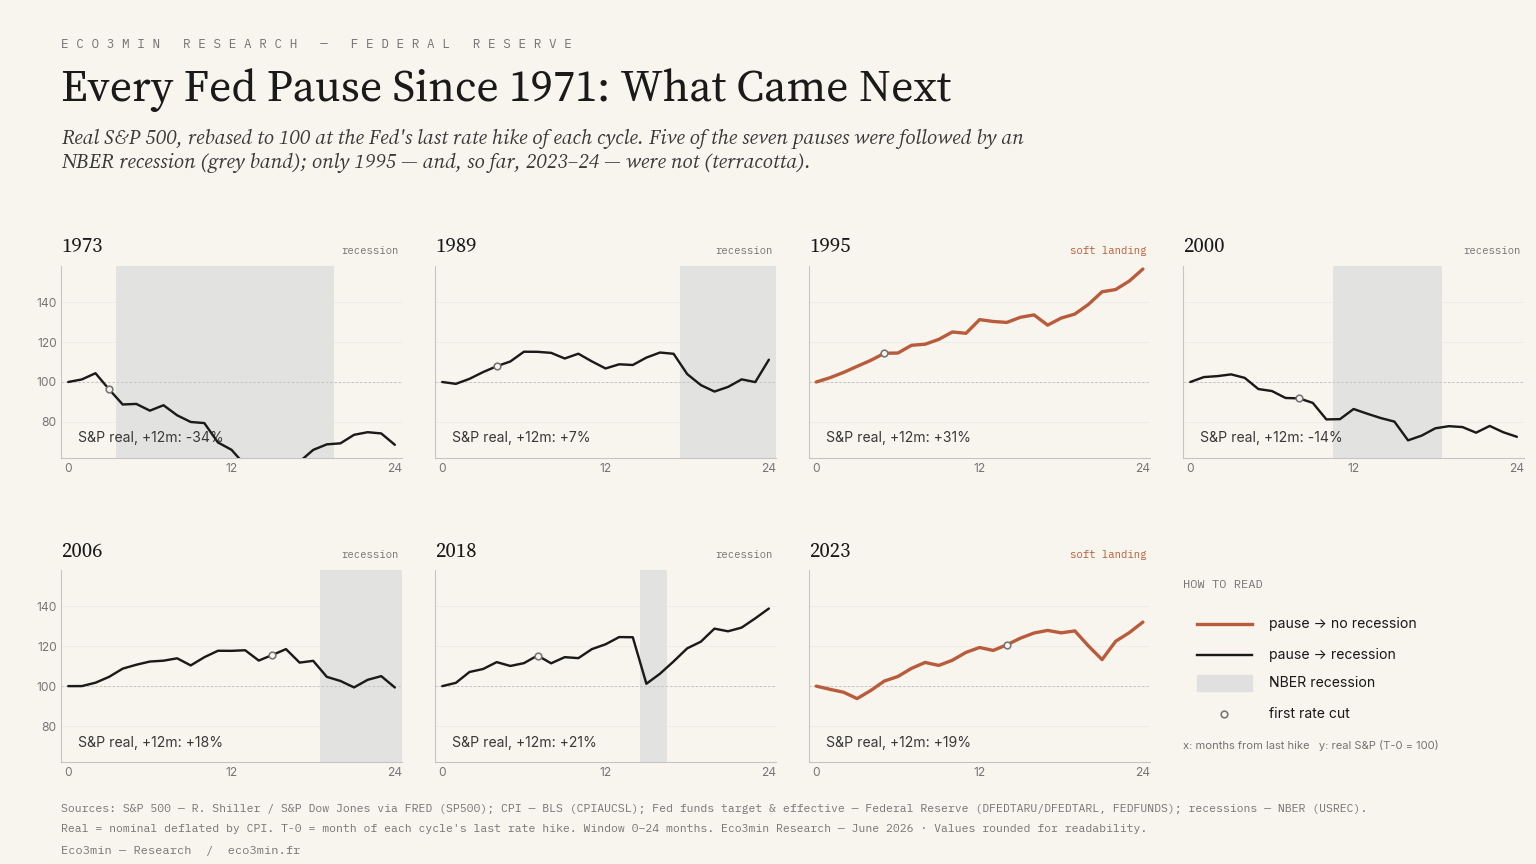
Of six completed Fed hiking cycles since 1971 that ended in a pause, only 1995 avoided a recession. The 2023–24 pause is the second attempt at a soft landing. On the same theme: our calendar of Federal Reserve meetings.
- Soft landings are rare: a recession began within roughly eighteen months of the last hike after five of the six completed pauses (1973, 1989, 2000, 2006, 2018). The lone exception was 1995.
- A pause is not a pivot: the first cut followed the last hike by four to fifteen months, and in 2015–16 the Fed held for a year and then resumed hiking instead of cutting.
- The one-year calm was not an all-clear: the real S&P 500 was higher twelve months after five of the seven pauses (median about +18%), yet a recession still followed most of them — the drawdown tended to arrive after the twelve-month mark.
A pause marks where the tightening stops — not, on the record, where the cutting, or the recession, begins.
Every Fed pause since 1971, at a glance
The table below lists each cycle-terminal pause — the Fed reached a hiking-cycle peak and held — together with the within-cycle hold of 2015–16, when the next move turned out to be another hike. “Next move” records what the Fed did when the hold ended. Equity returns are for the S&P 500 price index from the month of the last hike (T‑0); “real” deflates by the CPI. “Recession” is the NBER business-cycle peak that followed, with its lag from the last hike.
| Pause (last hike) | Peak rate | Plateau | Next move | S&P +6m | S&P +12m | Real +12m | Unemp. Δ12m | CPI +12m | Recession that followed |
|---|---|---|---|---|---|---|---|---|---|
| Aug 1973 | ~10.8%* | 4 mo | Cut | −10.0% | −26.8% | −33.9% | +0.7 pp | +10.9% | Nov 1973 (3 mo) |
| Feb 1989 | ~9.8% | 4 mo | Cut | +17.9% | +12.4% | +6.8% | +0.1 pp | +5.3% | Jul 1990 (17 mo) |
| Feb 1995 | 6.00% | 5 mo | Cut | +16.0% | +34.8% | +31.2% | +0.1 pp | +2.7% | None — soft landing |
| May 2000 | 6.50% | 8 mo | Cut | −2.9% | −10.4% | −13.5% | +0.3 pp | +3.6% | Mar 2001 (10 mo) |
| Jun 2006 | 5.25% | 15 mo | Cut | +13.0% | +20.8% | +17.7% | 0.0 pp | +2.7% | Dec 2007 (18 mo) |
| Dec 2018 | 2.25–2.50% | 7 mo | Cut | +12.6% | +23.7% | +20.9% | −0.3 pp | +2.3% | Feb 2020 (14 mo, COVID) |
| Jul 2023 | 5.25–5.50% | 14 mo | Cut | +6.6% | +22.8% | +19.3% | +0.7 pp | +2.9% | None so far |
| Dec 2015 † | 0.25–0.50% | 12 mo | Resumed hiking | +1.5% | +9.4% | +7.2% | −0.3 pp | +2.1% | None |
The pivot reflex
When the Fed stops hiking, the market’s working assumption is that the next chapter is easier money. The logic is straightforward: a central bank that has finished raising rates is, by implication, closer to lowering them; lower policy rates raise the present value of future cash flows and loosen financial conditions; so a hold reads as the first step toward a cut, and a cut reads as fuel for risk assets. The reflex is reinforced by the calendar — roughly eight FOMC meetings a year, each able to confirm or deny the pivot, plus every inflation and jobs print in between. It is the most frequently re-litigated question in macro.
And it is not naïve. The Fed does, eventually, cut after it pauses. The question this catalogue addresses is narrower: how quickly the cut arrives, on what terms, and what tends to be happening in the economy underneath while the pause holds. The economy underneath is itself a moving target, shaped by the monetary regimes that have governed rates and liquidity since 1990.
What the record actually shows
Two facts sit uneasily together. The first flatters the equity reflex: a year after the last hike, the real S&P 500 was higher in five of the seven pauses, with a median gain of about 18% (roughly +21% in nominal terms). The only exceptions were 1973 and 2000. Read in isolation, that looks like vindication for “a pause is bullish.”
The second fact is harder to square with it. A recession began within roughly eighteen months of the last hike after five of the six completed pauses; the only completed pause not followed by a recession was 1995. How can both be true at once? Because the recession — and the equity drawdown that came with it — usually arrived after the twelve-month window the first fact measures. The clearest case is 2006: the real S&P 500 was up about 18% twelve months after the Fed’s final hike, while the NBER-dated recession began eighteen months after it, in December 2007, with the market’s peak in between. The one-year calm was not an all-clear; it was the interval before the turn. In the same vein: the chronology of inflation reaccelerations.
The other half of the reflex — that a pause signals an imminent pivot — fares no better against the dates. In none of these episodes did the first cut follow the last hike immediately: the gap ran from four months in 1989 to fifteen in 2006, a median of roughly seven to eight. And the next move is not even guaranteed to be a cut. In 2015–16 the Fed held for a full year through a bout of market turmoil and then resumed hiking — the pivot, that time, was upward. A pause, in short, has reliably told you only that the tightening had stopped. It has not reliably told you that easing was near, or that the cycle would end without a recession. A closer look: the tally of postwar US recessions.
What a catalogue of seven cannot prove
Seven episodes are a record, not a law, and three qualifications belong in plain sight.
First, the sample is small and the regimes are not comparable. The 1973 pause sits inside the Great Inflation, with double-digit CPI and an effective funds rate above 10%; the 2018 pause sits at a 2.25–2.50% target with inflation near 2%. The starting level of rates, the starting level of inflation and the starting valuation of equities differ at every pause, and each plausibly shapes what follows more than the bare fact of the hold.
Second, one of the five “recession” outcomes is the 2020 pandemic — a shock from outside the cycle. Set it aside and four of the six completed pauses were followed by a domestically generated recession, with 2018–19 arguably on a soft-landing path until COVID intervened. The honest soft-landing tally is therefore one (1995) on the strictest reading, and perhaps two or three once you allow for the exogenous interruption and the unfinished 2023–24 episode.
Third, the 1973 figures rest on the effective funds rate, because there was no explicit funds-rate target before the early 1980s; that episode is a proxy read rather than a clean policy date. None of this overturns the central observation — that a pause has preceded both the cleanest soft landing on record (1995) and the deepest post-war recession (2008), and that the pause alone did not distinguish them. It does mean the right use of this page is descriptive: a record of what has happened, not a forecast of what will.
Methodology
Definition. A pause is the Federal Reserve holding its policy rate at the peak of a tightening cycle for at least three consecutive months before its next move — either a cut (a “cycle-terminal” pause) or, in the within-cycle case, a resumption of hikes. The three-month threshold is the highest that still captures the canonical short holds of spring 1989 (about four months) and early 1995 (five months) while excluding the routine gaps between hikes in a gradual cycle: the 2004–06 and 2015–18 campaigns moved in small steps almost every meeting, holding for two to three months at a time without pausing in the stop-and-assess sense. Raising the threshold to six months drops 1989 and 1995 but leaves the recession finding unchanged. More on this: cuts delivered into rising equities.
Detection and boundaries. Pauses are detected on the announced target rate from 1982 onward and on the effective federal funds rate before that; pre-1990 episode boundaries are anchored to the documented FOMC record, because the policy-rate series of that era carries sub-25-basis-point increments and, during the 1979–82 non-borrowed-reserves regime, no funds-rate target at all. Excluded, with reasons: the 1979–82 Volcker period (the funds rate was not targeted and swung between roughly 9% and 19% by design); the 1984 peak (the target reached 11.50% in August 1984 and then eased immediately, with no sustained hold — a soft landing without a pause); and the inter-hike gaps of gradual cycles.
Series. Federal funds effective and target rates from the Federal Reserve (FRED: FEDFUNDS, DFEDTAR, DFEDTARU/DFEDTARL); unemployment and the CPI from the BLS (UNRATE, CPIAUCSL); recession dates from the NBER (USREC); and the S&P 500 from Robert Shiller’s dataset through August 2023, extended with the index via FRED (SP500) thereafter — the two agree to the cent in the overlap. Real returns deflate the nominal price index by the CPI and exclude dividends; T‑0 is the month each cycle’s policy rate reached its peak; recession lags are measured to the NBER business-cycle peak. Every figure on this page is computed from the accompanying CSV; none is reproduced from a third party. Background: the Eco3min framework on how central banks set policy and transmit it to markets.
Frequently asked questions
What counts as a Federal Reserve “pause”?
Here, a pause is the Fed holding its policy rate at a hiking-cycle peak for at least three months before its next move. That threshold separates a genuine stop-and-assess hold from the two-to-three-month gaps between hikes in a gradual tightening cycle, which are not pauses in this sense.
How many times has the Fed paused since 1971?
Seven cycle-terminal pauses (1973, 1989, 1995, 2000, 2006, 2018 and 2023–24), plus a within-cycle hold in 2015–16 that ended in a resumption of hikes. The count is sensitive to the definition: raising the minimum hold from three to six months drops the two shortest holds, 1989 and 1995.
Does a Fed pause mean rate cuts are coming soon?
Not on the historical record. Across the pauses since 1971, the first cut followed the last hike by four to fifteen months, a median of roughly seven to eight. And the next move is not always a cut: in 2015–16 the Fed paused for a year and then resumed raising rates.
Has the stock market historically risen or fallen after a Fed pause?
The outcome has been bimodal. Twelve months after the last hike, the real S&P 500 was higher after five of the seven pauses (median about +18%), with large gains after 1995, 2006 and 2018, but double-digit losses after 1973 and 2000. The one-year figure has often been positive even when a recession was approaching, because the drawdown tended to come later.
How often has a recession followed a Fed pause?
A recession began within roughly eighteen months of the last hike after five of the six completed pauses; the exception was 1995, after which the expansion ran for another six years. One of the five, the 2020 downturn, was the pandemic rather than a cycle-driven recession. The 2023–24 pause has not been followed by a recession so far.
Data: Creative Commons Attribution 4.0 (CC BY 4.0). Methodology above.
Related
- Yield Curve Inversion History: Every 2s10s Inversion Since 1976
- The US Dollar Through Global Crises, 1973–2023
Last updated — 15 September 2026
Disclaimer – Financial Information: The analyses, commentary, and content published on eco3min.fr are provided for informational and educational purposes only. They do not constitute investment advice or a solicitation to buy or sell financial instruments. Past performance is not indicative of future results. All investment decisions involve risk and are the sole responsibility of the reader.