
Every U.S. Recession Since 1948: Duration, Depth, and What Preceded Each One
The National Bureau of Economic Research dates U.S. business cycles in prose, one paragraph per turning point. Laid out as a single table, twelve postwar recessions reveal a more legible pattern — and a counter-intuitive one. Most were not set off by the kind of dramatic shock the word “recession” tends to summon. They followed the ordinary turn of the monetary cycle.
Twelve U.S. recessions since 1948, each with its duration, depth, and the advance signal that preceded it — the reference table the NBER publishes only as prose.
- The U.S. has had 12 NBER-dated recessions since 1948, ranging from 2 months (2020) to 18 months (2007–09).
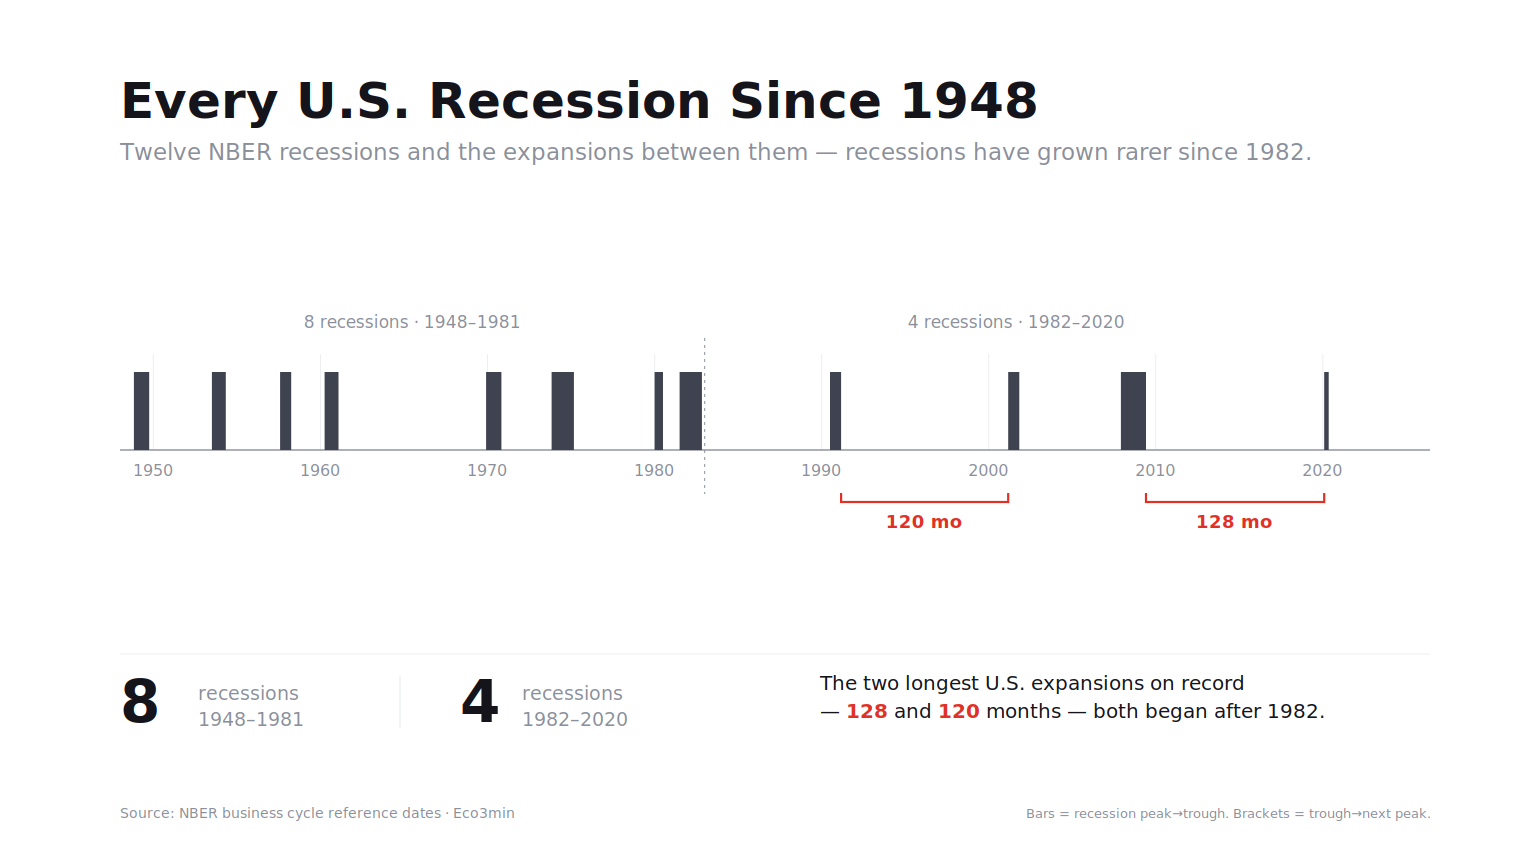
- Recessions have grown rarer: 8 began between 1948 and 1981, only 4 between 1982 and 2020. The two longest expansions on record (128 and 120 months) both began after 1982.
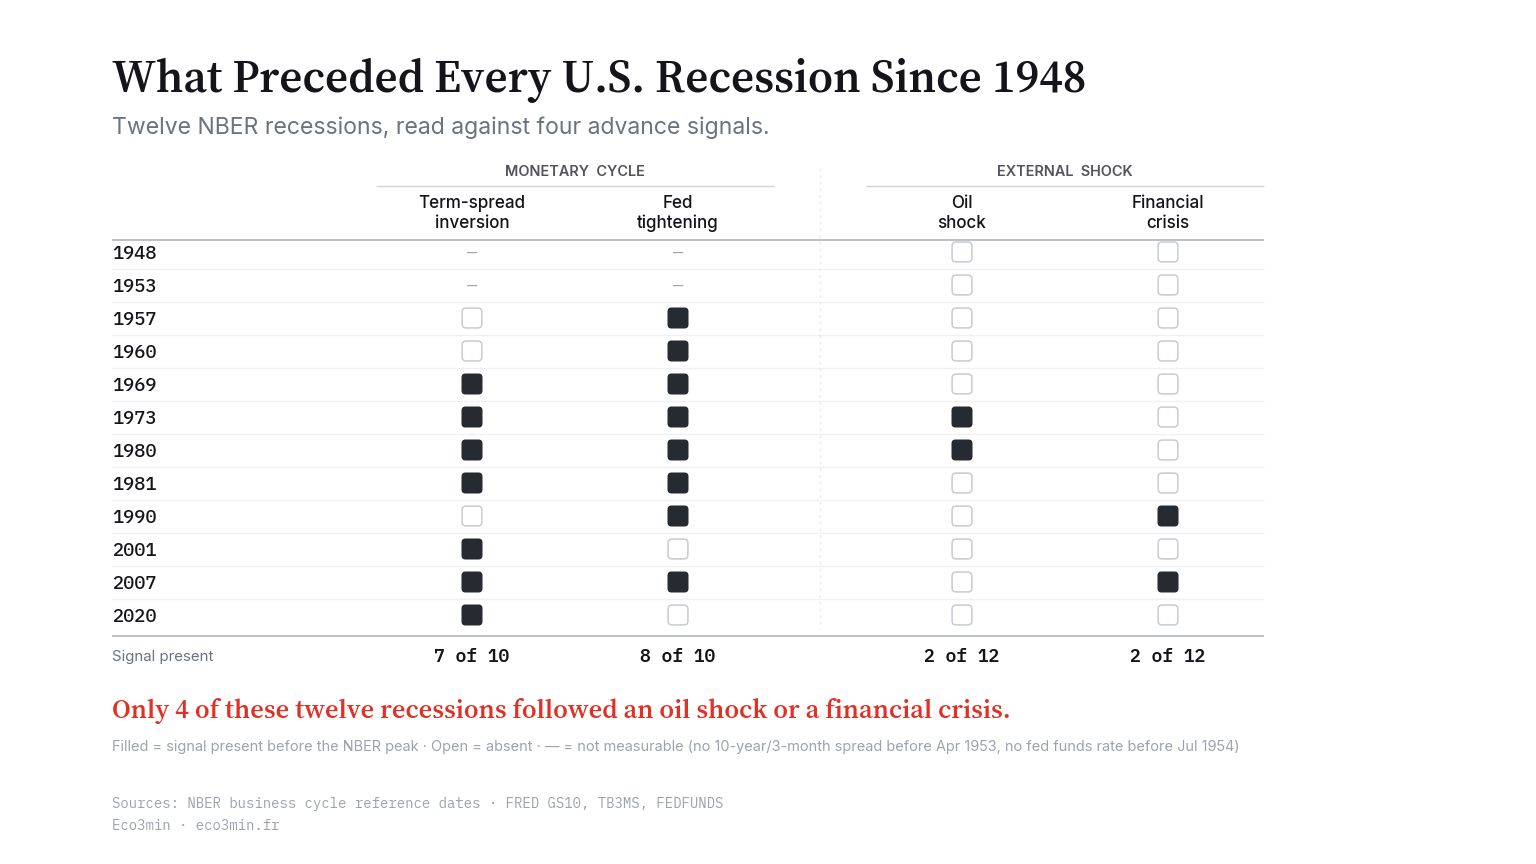
- Only four of the twelve recessions since 1948 followed an oil shock or a banking crisis; the other eight arrived without a dramatic trigger, after the ordinary turn of the monetary cycle.
The full record
| Recession | Duration (months) | Real GDP decline | Unemployment rise | Term spread before peak | Other preconditions |
|---|---|---|---|---|---|
| Nov 1948 – Oct 1949 | 11 | −1.7% | +4.4 pts | n/a (no series before 1953) | — |
| Jul 1953 – May 1954 | 10 | −2.5% | +3.6 pts | n/a (series begins Apr 1953) | — |
| Aug 1957 – Apr 1958 | 8 | −3.6% | +3.8 pts | +0.24 (no inversion) | Fed tightening |
| Apr 1960 – Feb 1961 | 10 | −1.3% | +2.3 pts | +0.20 (no inversion) | Fed tightening |
| Dec 1969 – Nov 1970 | 11 | −0.7% | +2.6 pts | −0.29 (inverted) | Fed tightening |
| Nov 1973 – Mar 1975 | 16 | −3.1% | +4.4 pts | −1.27 (inverted) | Oil shock; Fed tightening |
| Jan 1980 – Jul 1980 | 6 | −2.2% | +2.9 pts | −1.65 (inverted) | Oil shock; Fed tightening |
| Jul 1981 – Nov 1982 | 16 | −2.6% | +3.6 pts | −2.65 (inverted) | Fed tightening |
| Jul 1990 – Mar 1991 | 8 | −1.4% | +2.6 pts | +0.13 (no inversion) | Financial crisis (S&L); Fed tightening |
| Mar 2001 – Nov 2001 | 8 | −0.4% | +2.2 pts | −0.53 (inverted) | — |
| Dec 2007 – Jun 2009 | 18 | −3.8% | +5.4 pts | −0.38 (inverted) | Financial crisis; Fed tightening |
| Feb 2020 – Apr 2020 | 2 | −9.1% | +11.3 pts | −0.32 (inverted) | Pandemic |
Each row is an NBER business-cycle contraction, dated from peak to trough. Duration is measured in months between those turning points. Depth is the peak-to-trough decline in real GDP (grey bars scale to the deepest decline, 2020); the rise in unemployment is measured from its pre-recession low to its cycle high. The final columns record what preceded the downturn — the term spread in the months before the peak, and whether an oil shock, a financial crisis, or a Fed tightening cycle was in play. Related deep-dive: our deep dive into the signals that mark each phase of the economic cycle.
Sources: NBER business cycle reference dates (peak, trough); FRED series GDPC1 (real GDP), UNRATE (unemployment), GS10 and TB3MS (10-year/3-month term spread), FEDFUNDS. The term spread shown is the 10-year/3-month (GS10 minus TB3MS), the longest consistent series, available from 1953; no term spread predates it. The 2-year/10-year spread of the companion record begins only in 1976.
What the table shows
“Is a recession coming?” is the most persistently asked question in macro, and it is being asked now: the Federal Reserve has begun easing, the labour market is cooling unevenly, and the advance signals analysts watch are sending mixed readings. The instinct in such moments is to compare the present with the past — which is harder than it should be, because the canonical record of past recessions exists mainly as descriptive text. The table above assembles it from primary sources.
The dominant reading of recession risk treats each downturn as its own story — a unique shock, a one-off policy error, an unforeseeable crisis. Read across the full postwar record, two patterns cut against that. The first is monetary and pervasive: of the ten recessions since 1957 for which a term spread can be measured, seven were preceded by an inverted 10-year/3-month curve, and eight by a sustained Fed tightening cycle. Where the curve did not invert (1957, 1960, 1990), the Fed had tightened; where tightening was mild (2001, 2020), the curve had inverted. Methodology detailed in the Federal Reserve’s record of FOMC rate decisions. The second pattern is the opposite of recurrence: dramatic shocks are rare. Only two of the twelve recessions followed an oil shock (1973, 1980) and two a banking crisis (1990, 2007). The other eight had neither. On this record, most U.S. recessions were not triggered by a crisis — they followed the ordinary tightening of the monetary cycle, with the curve flat or inverted ahead of the peak. Adjacent reading: the record of full-employment deficits.
A second pattern is structural rather than cyclical. Recessions have become markedly less frequent. The thirty-four years from 1948 to 1981 contained eight of them; the thirty-eight years from 1982 to 2020 contained four. The 1982 dividing line marks the end of the Volcker disinflation, the conventional boundary of the so-called Great Moderation. The expansions in between lengthened accordingly: the two longest on record — the 128-month expansion of 2009–2020 and the 120-month expansion of 1991–2001 — both began after 1982. The contraction that the present cycle is measured against is, on this record, an increasingly rare event. Related reading: the postwar inflation-rebound record.
Depth is where the cycles diverge most. The median postwar recession cut real GDP by about 2.4%; the 2007–09 contraction ran close to 1.6× that, and the two-month pandemic stop of 2020 stands far outside the rest at 9.1%. Duration and depth do not move together: the 2020 recession was the shortest on record yet by far the deepest, while several mid-century downturns were longer but shallower.
Recession risk is usually read as a hunt for the next crisis. The postwar record points elsewhere: the signal that recurs is monetary — an inverted curve or a Fed tightening cycle preceded nearly every recession — while the dramatic shock, oil or a banking failure, is the exception. Most recessions simply followed the cycle turning.
What the record does not say
A pattern across twelve observations is a pattern across twelve observations. The sample is small, and three caveats bound what it supports. First, preconditions are not causes: a signal preceding a recession is a sequence, not a mechanism, and each of these stresses has also appeared without a recession following — the 1990s and mid-1980s tightening cycles among them. Second, the term-spread column is incomplete by construction. The 10-year/3-month spread does not exist before 1953, so the inversion signal cannot be read at all for the 1948 and 1953 recessions. An “n/a” in that column is missing data, not evidence that no signal was present. Further reading: the postwar record of Fed pauses.
Third, and most important for anyone reading this against the present: a record is not a forecast. That recessions have grown rarer does not make the next one less likely, and that four signals have preceded past contractions does not mean their current readings settle whether one is coming. The table describes what happened before twelve recessions. It does not tell you what the signals flashing now will precede. Read with the same restraint, the record of every US bank failure since 1934 is the banking-sector counterpart of this table.
Methodology and sources
Recession dates are the NBER business-cycle reference dates, taken at the monthly peak and trough. Duration is the number of months between peak and trough. Depth is the largest peak-to-trough decline in quarterly real GDP (FRED series GDPC1), measured from the highest quarter around the NBER peak to the lowest quarter through the contraction; because GDP is quarterly and NBER dates are monthly, the figure is a quarterly approximation. The rise in unemployment is the change in the headline rate (FRED series UNRATE, which begins in January 1948) from its pre-recession low to its cycle high, measured up to eighteen months past the trough because unemployment lags the cycle. A related compilation: Fed easing episodes into equity highs.
The term-spread column uses the 10-year/3-month Treasury spread (FRED GS10 minus TB3MS), the longest consistent series, available from 1953; the 2-year/10-year spread used in the companion record begins only in June 1976, so a single 10-year/3-month definition is used here for comparability across cycles. The Fed-tightening flag marks the largest cumulative rise in the effective federal funds rate (FRED FEDFUNDS, from July 1954) over the three years before the peak, and is set when that rise reaches at least 2 percentage points. Oil shocks and financial crises are recorded as explicit qualitative flags, kept separate from the series-derived inversion and tightening signals, under a stated rule: a signal counts as a precondition only if present before the NBER peak, not coincident with or following the downturn. Oil shocks are limited to supply disruptions that sharply raised crude before the peak, which excludes 2008 (oil peaked mid-recession). Financial crises denote systemic banking or credit-system stress, distinct from an equity-market correction: on that definition the 1990–91 recession is coded financial (the savings-and-loan crisis and 1989–90 credit crunch) rather than oil, since the Gulf price spike followed the July 1990 peak, and the 2001 recession is not coded financial. Where a recession predates the relevant series (no term spread before 1953, no federal funds rate before 1954), the cell is marked not measurable, not absent. Every figure on this page is computed from these series and reproduced in a single open dataset; data revisions and gaps are documented rather than interpolated. Related analysis: the chronology of oil shocks and triggers.
Frequently asked questions
How many recessions has the U.S. had since 1948?
Twelve, by the NBER’s business-cycle dating: 1948–49, 1953–54, 1957–58, 1960–61, 1969–70, 1973–75, 1980, 1981–82, 1990–91, 2001, 2007–09, and 2020.
What was the longest U.S. recession since 1948?
The 2007–09 recession, at 18 months from peak (December 2007) to trough (June 2009). The 1973–75 and 1981–82 recessions follow at 16 months each.
What was the shortest?
The 2020 recession, at 2 months (February to April 2020) — the shortest in the NBER record, though among the deepest by the scale of the real-GDP decline.
Have U.S. recessions become less frequent?
By count, yes. Eight recessions began between 1948 and 1981 and four between 1982 and 2020, with the two longest expansions on record both beginning after 1982. Why the frequency fell is debated; the table records the change without attributing a single cause. The post-1982 stretch is the one usually called the Great Moderation, the opening of the succession of macro-financial regimes that leads to the structural break.
Does a yield-curve inversion always precede a recession?
Not always. Using the 10-year/3-month spread, which is available from 1953, seven of the ten recessions with a measurable term spread were preceded by an inversion — and three (1957, 1960, 1990) were not. The signal is informative but not infallible; the 2-year/10-year version and its track record, including the false positives it has produced, are examined in the companion yield-curve record. No term spread can be read before 1953.
Last updated — 15 September 2026
Disclaimer – Financial Information: The analyses, commentary, and content published on eco3min.fr are provided for informational and educational purposes only. They do not constitute investment advice or a solicitation to buy or sell financial instruments. Past performance is not indicative of future results. All investment decisions involve risk and are the sole responsibility of the reader.