
Every U.S. Inflation Second Wave Since 1948
U.S. inflation comes back often. Across nearly eight decades it has almost never kept coming back bigger. Here is the full record — and where the 2026 wave sits inside it.
Since 1948, U.S. inflation has re-accelerated a dozen times; only once — the 1970s — did successive waves each peak higher than the last.
Twelve distinct re-accelerations; seven topped the wave immediately before them, but that earlier wave was usually a minor one. Sustained escalation across three successive waves happened a single time: 1970 (6.4%) → 1974 (12.2%) → 1980 (14.6%). No wave since 1980 has exceeded the 14.6% reached then.
The 2026 wave is underway: after bottoming at 2.3% in April 2025, year-over-year CPI is back to 4.2% (May 2026) on the Iran energy shock — up nearly two percentage points, still well below the 9.0% of 2022.
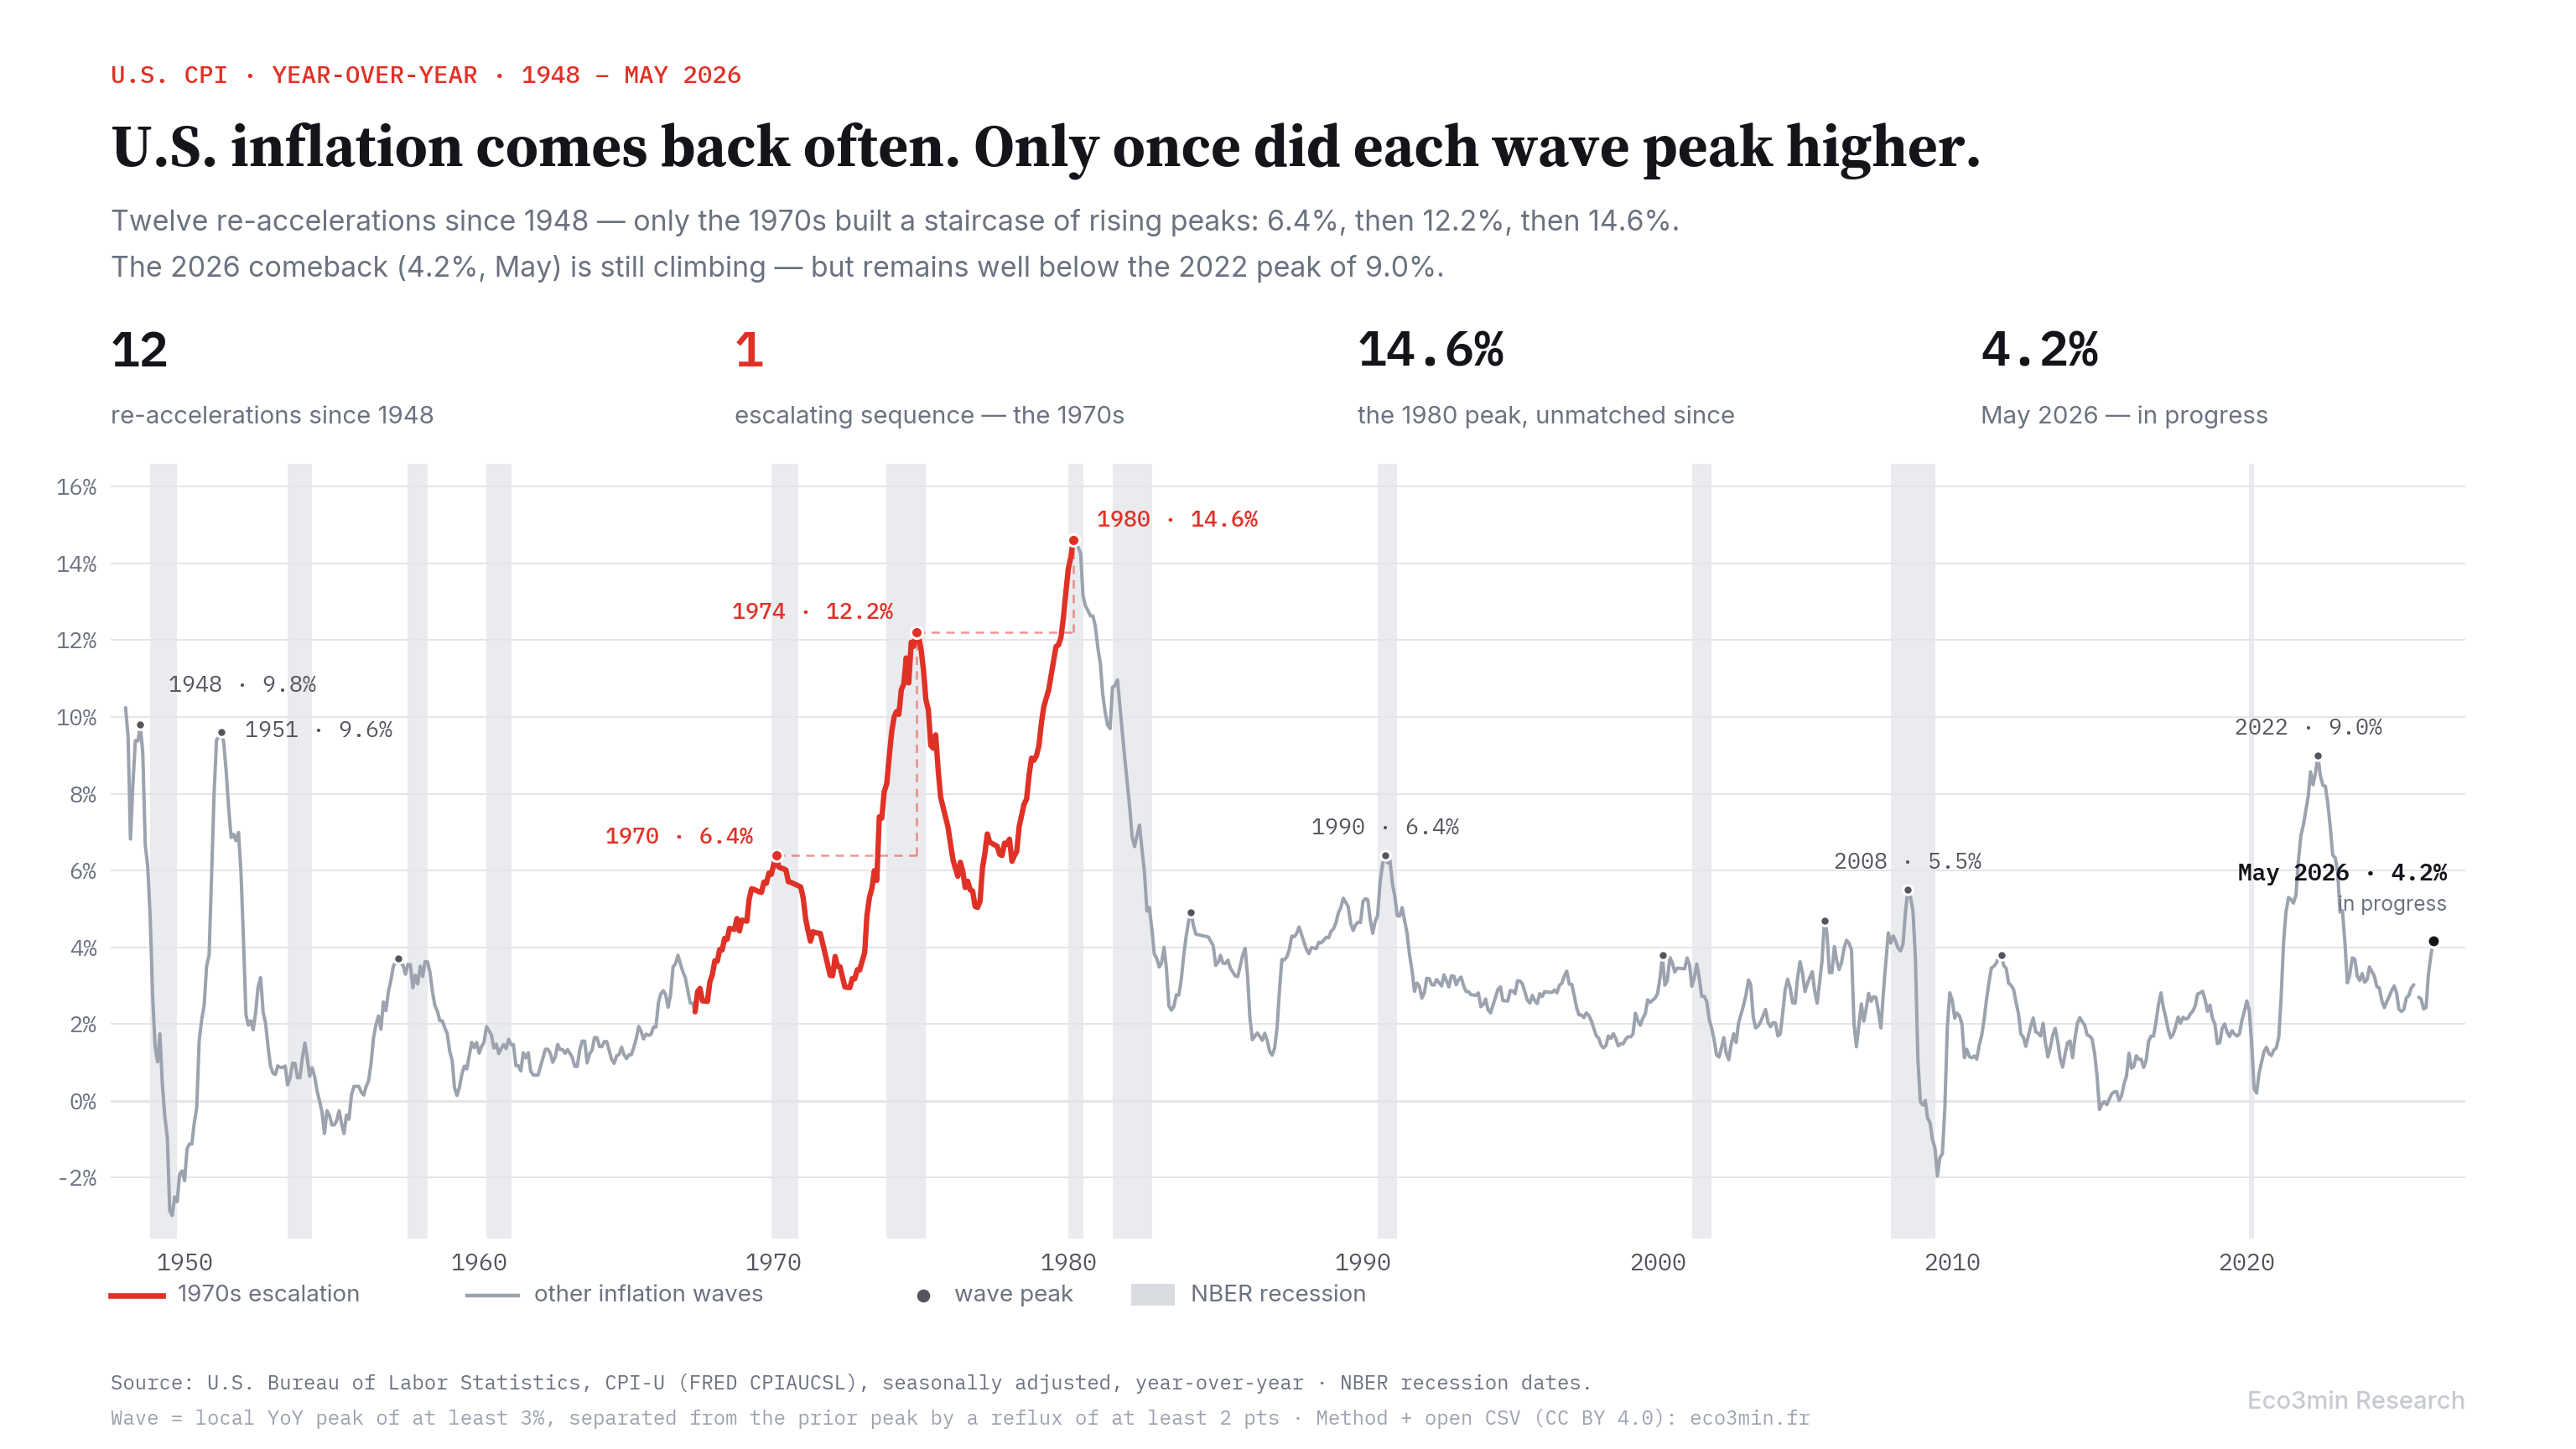
Twelve re-accelerations since 1948
A “wave” here is a local peak in year-over-year CPI of at least 3%, separated from the prior peak by a reflux of at least 2 percentage points (definition and robustness checks below). Each row is a peak; the last column compares it to the peak immediately before it.
| Peak | YoY CPI | vs. previous peak | |
|---|---|---|---|
| Jul 1948 | 9.8% | — | |
| Apr 1951 | 9.6% | lower | |
| Apr 1957 | 3.7% | lower | |
| Feb 1970 | 6.4% | higher | |
| Nov 1974 | 12.2% | higher | |
| Mar 1980 | 14.6% | higher | |
| Mar 1984 | 4.9% | lower | |
| Oct 1990 | 6.4% | higher | |
| Mar 2000 | 3.8% | lower | |
| Sep 2005 | 4.7% | higher | |
| Jul 2008 | 5.5% | higher | |
| Sep 2011 | 3.8% | lower | |
| Jun 2022 | 9.0% | higher | |
| 2026 → | 4.2%* | in progress |
*May 2026, year-over-year, and rising. The 2026 wave is not yet a completed peak. Red rows mark the only run of three successive higher peaks. (Oct 2025 is absent from the source series and is excluded.)
Check any month since 1948
The chart below draws the same series as the open dataset. Hover for the exact year-over-year print of any month, or jump straight to each wave.
The chart everyone is sharing
One image has dominated the 2026 inflation debate: today’s CPI laid over the 1970s, lined up so the two curves rhyme, with a dotted projection pointing toward a second peak around 2027. The implication is that a bigger second wave is coming. Larry Summers has refreshed the comparison; Jim Bianco argues a 3% inflation floor is now embedded; and Lacy Hunt, framing the oil shock as the kind of cost-push event that drove the 1970s recessions, put its CPI impact at 240–300 basis points at the May 2026 Strategic Investment Conference. That decade’s Fed even has a name among economists — “stop-go,” for tightening when inflation rose and easing the moment growth weakened. The fear is coherent, and the backdrop rhymes: an energy shock (the Strait of Hormuz), a fresh acceleration, and a central bank that had already begun easing.
It also rests on a chart that several analysts have called unsound. ING’s James Smith labelled the overlay a “chart crime,” the trick being to lag U.S. inflation by 571 months and align it on the past to manufacture a match. The visual is doing the arguing. What it never shows is the actual base rate: across the full post-war record, how often does a second wave arrive — and how often is it bigger?
Coming back is normal. Coming back bigger is rare.
Re-acceleration itself is unremarkable. Since 1948, year-over-year CPI has formed twelve distinct upward waves after meaningful refluxes — roughly one every six or seven years. Reference release: the BLS consumer price index databases. Inflation receding and then returning is the ordinary texture of the series, not an anomaly. A related angle is available in how US headline inflation outran core in 2026.
Whether it returns bigger is a different question, and the honest answer has two layers. Seven of the twelve waves did exceed the peak immediately before them — but in most of those cases the preceding peak was a small one (the 2005 wave at 4.7% topped the 2000 wave at 3.8%, for instance). What is genuinely rare is sustained escalation: a run of successive waves each higher than the last, pushing the price level into a new range. That has happened exactly once — the three-step climb of 1970 → 1974 → 1980, from 6.4% to 12.2% to 14.6%. No other run reached three: the closest was two consecutive higher peaks — 2005 (4.7%) then 2008 (5.5%), off a 3.8% base — before the 2011 wave broke the sequence. And no wave in the more than four decades since 1980 has exceeded that 14.6% high; the closest was 9.0% in 2022. The single-escalation finding holds whether the reflux threshold is set at 2.0 or 2.5 percentage points; the wave count itself shifts by one. On the same theme: The mapping of US downturns.
Widening the lens does not weaken this; it sharpens it. The two most violent inflations in the entire CPI record fall before this window — 23.7% in June 1920 and 20.2% in March 1947, both higher than anything the 1970s reached — yet each was a lone spike that collapsed almost at once into deflation (prices fell 15.8% in the year after the 1920 peak), not a staircase. That is why the record here starts in 1948: the gold-standard and wartime-price-control conditions behind those two peaks belong to a different monetary regime from the modern, post-1951 Federal Reserve framework, and charting them together would compare unlike things. Even measured against those two larger pre-war peaks, sustained escalation across successive waves remains a single event in the U.S. record. In the same vein: our reference page on how inflation forms and transmits across the economy.
Why the 1970s is not simply a reassurance
A record is not a forecast, and three qualifications cut against reading this as an all-clear. First, the sample is small: a dozen waves across eight decades is enough to describe a pattern, not to pin a probability — “rare” is not “impossible,” and the one escalation was severe. Second, the 1970s escalation was not random. It coincided with a specific configuration — the Federal Reserve eased policy before inflation had fully receded, household inflation expectations de-anchored, and supply shocks arrived in succession. The Cleveland Fed has published evidence that the dispersion of consumer inflation expectations in early 2025 already exceeded the 1970s peak, which is precisely the channel through which a second wave compounds. Third, this dataset measures realized CPI; it cannot capture the pressures that may still be building beneath a 4.2% print — the gap between commodity prices and headline CPI that the commodity signal in headline inflation tracks directly.
So the data does not say a second escalation cannot happen. It says escalation is the exception, and that the exception came with identifiable preconditions rather than from the mere fact of a first wave.
Where 2026 sits
The current episode is a genuine re-acceleration, still in its early phase. Year-over-year CPI fell all the way to 2.3% by April 2025 — a full reset of the post-COVID cycle — before the Iran energy shock pushed it back to 4.2% by May 2026, a rise of nearly two percentage points off the trough. At that level it remains far below the 9.0% peak of 2022, and it has not yet formed a completed peak.
The record cannot say which way it resolves, but it does identify what separated the one escalation from the comebacks that faded: policy loosened into a still-elevated price level, expectations came unanchored, and shocks compounded. Whether 2026 comes to resemble that configuration or the contained rebounds of 1990 and 2008 is the open question — and it is one the next several CPI releases, not a 571-month overlay, will answer. Which of the two it comes to resemble is, at bottom, a question of regime — the very object of the regime lens Eco3min applies to macro-financial cycles.
What counts as a wave, and how to falsify this
Whether a given pickup “counts” as a wave, or whether a sequence “escalates,” is a classification choice, so the criterion is explicit. A wave is a local peak in year-over-year CPI of at least 3%, separated from the previous peak by a trough at least 2 percentage points lower (the reflux), with peaks within 2 points of one another treated as a single wave. An escalation is three or more consecutive waves each peaking above the one before. On these rules the post-war record contains twelve re-accelerations and one escalation. Loosen or tighten the reflux threshold between 2.0 and 2.5 points and the single-escalation finding holds; the count shifts by one wave (twelve at 2.0, eleven at 2.5, as a minor 2000 peak falls below the cut). If a future revision to the historical CPI, or a different but equally explicit rule, overturns the result, this page is revised accordingly; the open dataset below lets anyone test that directly. (The oil-shock channel behind several of these waves is mapped separately in the compilation of postwar oil shocks.)
Data and method
The series is CPI-U (all urban consumers), seasonally adjusted — BLS series CPIAUCSL via FRED, monthly, with values through May 2026 (released in June 2026). The charted window begins in 1948 for the regime reason set out above; the two larger pre-1948 peaks are discussed in the text rather than charted; the opening months of 1948 (10.2% in January) are the descending tail of the 1947 wave, which is why the first marked peak — July 1948, 9.8% — sits below the chart’s starting level. Year-over-year change is computed on a date basis (each month against the same month a year earlier), so it is unaffected by a missing month. Waves are identified with a turning-point filter that records alternating peaks and troughs only when the series swings by at least the reflux threshold, which suppresses spurious peaks from month-to-month noise; peaks below 3% are not counted as inflation waves. Recession shading follows NBER business-cycle dates. One source caveat: the October 2025 observation is currently absent from the published CPIAUCSL series and is excluded from the calculations rather than interpolated. On the same theme: our tally of Fed pauses and aftermaths.
Frequently asked questions
How many times has U.S. inflation re-accelerated since 1948?
Twelve distinct times, on a definition of a year-over-year CPI peak of at least 3% separated from the prior peak by a reflux of at least 2 percentage points. That is roughly one re-acceleration every six to seven years, making the return of inflation a recurring feature of the post-war series rather than a rare event.
Has a second wave of U.S. inflation ever peaked higher than the first?
Seven of the twelve waves topped the peak immediately before them, but that earlier peak was usually a minor one. Sustained escalation — three successive waves each higher than the last — has happened only once, in the 1970s: 6.4% in 1970, 12.2% in 1974, and 14.6% in 1980. No wave in the more than four decades since has exceeded that 14.6% high.
Is the 2026 inflation pickup repeating the 1970s?
It is too early to say, and the historical record cannot answer in advance. As of May 2026, year-over-year CPI is 4.2% and rising, up from a 2.3% trough in April 2025, but still below the 9.0% peak of 2022. The 1970s escalation came with specific conditions — policy easing into still-elevated inflation, de-anchored expectations, and successive supply shocks — and whether 2026 matches that configuration is what the coming CPI releases will determine.
What counts as an inflation “wave” in this dataset?
A local peak in year-over-year CPI of at least 3%, separated from the previous peak by a trough at least 2 percentage points lower. Peaks within 2 points of each other are treated as a single wave. The single-escalation finding is unchanged whether the threshold is set at 2.0 or 2.5 percentage points; the count itself shifts by one wave (twelve at 2.0, eleven at 2.5).
Where can I download the data?
The full monthly CPI dataset (1913–May 2026) and the wave registry are available above as open CSV files under a CC BY 4.0 licence, free to reuse with attribution to Eco3min.
Disclaimer — Financial information. The analyses and content published on eco3min.fr are provided for informational and educational purposes only. They do not constitute investment advice or a solicitation to buy or sell financial instruments. Past performance and past patterns are not indicative of future results. Every investment decision involves risk and is the sole responsibility of the reader.
Last updated — 6 October 2026
Disclaimer – Financial and Legal Information: The analyses, commentary, and content published on eco3min.fr are provided for informational and educational purposes only. They do not constitute investment advice or a solicitation to buy or sell financial instruments. Past performance is not indicative of future results. All investment decisions involve risk and are the sole responsibility of the reader. Data, charts and calculated series are provided as is and may contain errors or lag behind their source: check any figure against the primary source cited before relying on it. Content describing laws, regulations or contracts reflects the law as of its publication date and does not constitute legal or tax advice; applying it to a specific situation requires a qualified legal or tax professional.