
The macro regime on a given date
Enter a date. The tool returns the US macro regime for that month as computed by the Eco3min classification engine from three measured signals, together with the market readings of that month. It classifies nothing before January 1978, and says so rather than returning a verdict it could not defend.
Eco3min tool · regime classification
The macro regime on a given date
One date, the macro-financial state of that month. The engine classifies from January 1978 to the present; outside that window it refuses rather than extrapolates.
Coverage: January 1978 → last published month. Monthly readings. No structural layer is ever produced by a date entry.
What the engine computes, and what it refuses to
The classification runs on three layers, separated by a test anyone can apply: does the engine produce a signal for this object, yes or no? This tool exposes only the layers where the answer is yes.
- Layer 1 — cyclical. The growth × inflation cell, from the three-month moving average of the Chicago Fed National Activity Index and the Dallas Fed’s 12-month trimmed mean PCE. This is the headline verdict.
- Layer 2 — overlay. The financial-conditions qualifier from the Chicago Fed’s National Financial Conditions Index: accommodating, neutral, restrictive or acute stress. It does not change the growth × inflation cell, it contextualises it.
- Layer 3 — reading frames. Secular stagnation, financial repression, fiscal dominance, dollar shortage. The classification engine produces no signal for these: they are long-horizon interpretive grids, not computed states. They never appear in a dated result. No date entry can trigger them.
That boundary is the point of the tool rather than a methodological footnote. It is what stops a lookup from dressing judgement as measurement, and it is why some results here are deliberately thinner than they could be.
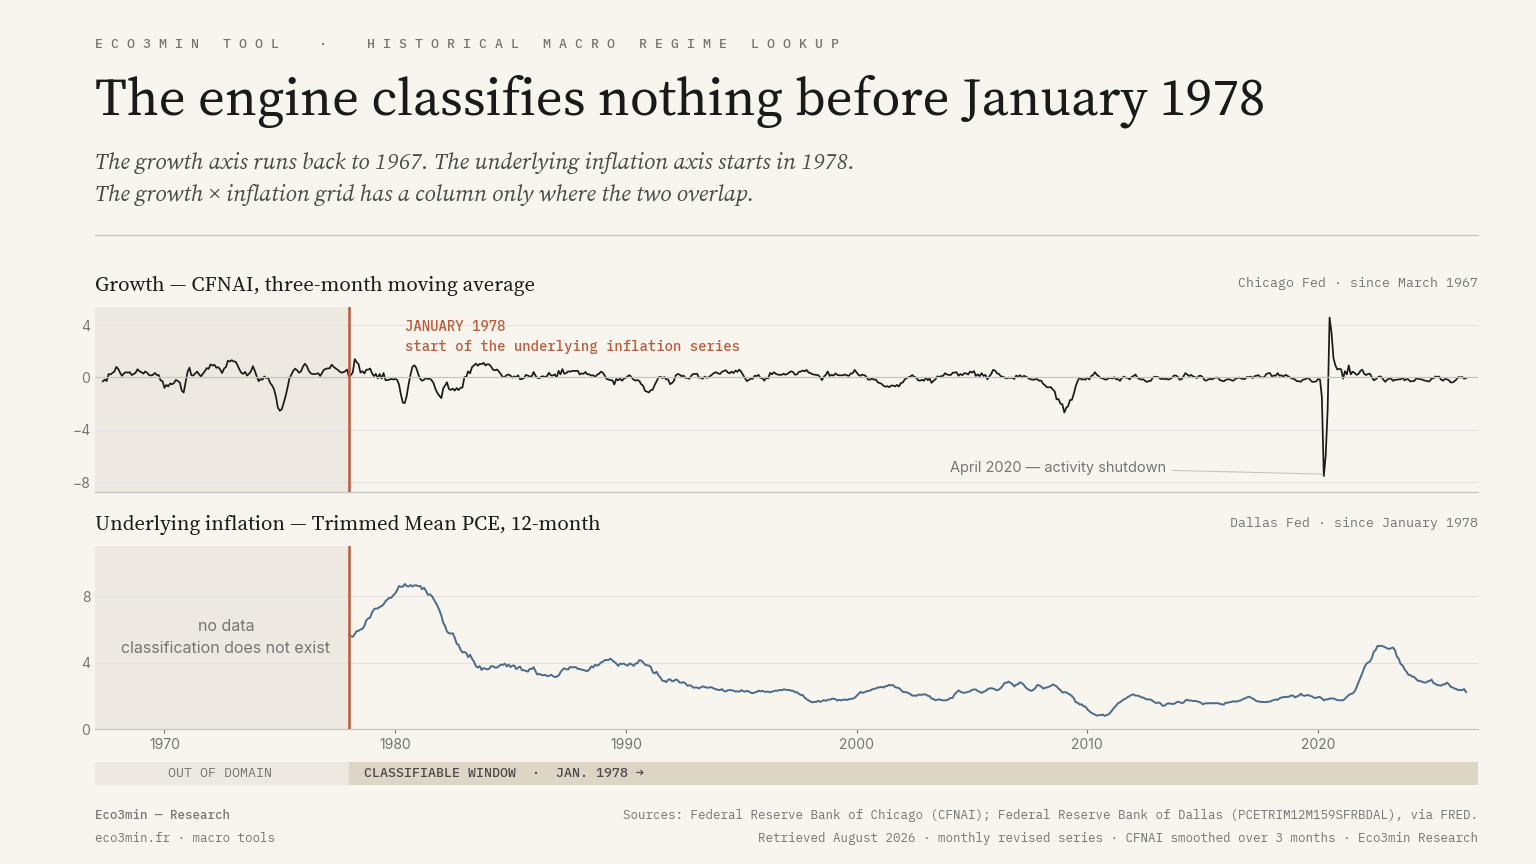
The January 1978 floor
The inflation axis runs on the Dallas Fed’s trimmed mean PCE, a core measure that discards the tails of the price-change distribution rather than a fixed list of categories. The 12-month series begins in January 1978. Without it the growth × inflation grid has no column — not a degraded regime, no regime at all.
Back-classifying earlier decades by historical reading, flagged with a distinct proof status, was considered and rejected. A status marker does not survive transport: once a screenshot circulates, or a language model quotes the result, what remains is an engine verdict on a date the engine does not cover. Earlier episodes are handled editorially instead, where the judgement is owned rather than badged.
A second boundary runs inside the covered domain. The thresholds were calibrated on 2003-2026. Applied to 1978-2002 they still run and still produce a reproducible verdict, but they discriminate less: underlying inflation sitting durably above the threshold sorts whole stretches of years into the same column by construction. The tool states this in a banner set at the same weight as the regime name, for any date before 2003.
Monthly, and openly so
All three axes are monthly. The financial conditions index publishes weekly and is averaged to the month; the activity index and the trimmed mean are monthly by construction. A date entry is therefore resolved to its calendar month, and the tool shows the conversion happening: the date you typed stays visible next to the month that was used.
Interpolating to a daily value would manufacture precision the data does not contain. The choice runs the other way — show the month, own it.
Revised data, not vintage data
The tool describes a month as today’s revised series describe it, which is not what was readable at the time. The Chicago Fed activity index is revised substantially, and a growth state computed now for a month in 2008 can differ from the one an analyst would have read in early 2009 from the releases then available. The data vintage is displayed with every result. Reconstructing real-time vintages would require pulling archived releases for every input series — a defensible project, but a different one, and it is not what this page claims to do.
Series and method
Everything the engine reads is public. Growth comes from the Chicago Fed National Activity Index (FRED code CFNAI, monthly since March 1967), taken as a three-month moving average. Underlying inflation comes from the Dallas Fed trimmed mean PCE, 12-month rate (PCETRIM12M159SFRBDAL, monthly since January 1978). Financial conditions come from the Chicago Fed National Financial Conditions Index (NFCI, weekly since January 1971). The market block reads CPI-U (CPIAUCNS), the effective federal funds rate (FEDFUNDS), the 10-year Treasury constant maturity yield (GS10), and the S&P 500 monthly series maintained by Robert Shiller at Yale.
The classification logic, the thresholds and the state grid are documented in full on the methodology page. The same engine produces the live reading on the current regime dashboard, which is what makes a date lookup and a live reading comparable rather than two separate exercises.
The two anchors
Alongside the regime, two conversions make an old month legible. The first restates $100 of that month in today’s dollars using the consumer price index — a purchasing-power equivalence, not a return. The second gives the multiple of the S&P 500 price index between that month and the latest available month, excluding reinvested dividends, fees and taxes. Both are historical observations. Neither implies anything about what comes next.
Related
- Current macro regime — the live dashboard for this month, with the fourteen tracked indicators.
- Classification methodology — the three axes, the seven grid states and the thresholds.
- Macro regime comparator — for putting two regimes side by side rather than one date.
- How regime shifts happen — why a turn is usually identified late.
Each regime has a full Atlas page: inflationary, disinflationary, dollar shortage, fiscal dominance, secular stagnation, financial repression.
Frequently asked questions
Why does the tool refuse dates before 1978?
Because the underlying inflation series feeding the engine’s inflation axis — the Dallas Fed trimmed mean PCE — begins in January 1978. Without it the growth × inflation grid cannot be computed. Returning a regime name anyway would present historical judgement as measurement.
Why is the result monthly when I entered a day?
All three engine axes are monthly. Interpolating a daily value would create precision the data does not contain. The date entered stays visible next to the month used, so the conversion is explicit.
What does the financial conditions qualifier mean?
It describes the funding environment of that month, measured by the Chicago Fed National Financial Conditions Index: accommodating, neutral, restrictive or acute stress. It does not change the growth × inflation cell, it contextualises it — the same cell is not lived the same way depending on whether credit is abundant or scarce.
Are these the numbers that were known at the time?
No. These are the revised series available today, and the data vintage is displayed with every result. Several inputs, the Chicago Fed activity index in particular, are revised after first publication.
Can the tool return a structural regime such as secular stagnation?
No. Structural layers have no live signal, so no date can trigger them. They exist as long-horizon reading frames in the Atlas, where the interpretive status is stated rather than implied by a lookup.
Last updated — 20 August 2026
Disclaimer – Financial Information: The analyses, commentary, and content published on eco3min.fr are provided for informational and educational purposes only. They do not constitute investment advice or a solicitation to buy or sell financial instruments. Past performance is not indicative of future results. All investment decisions involve risk and are the sole responsibility of the reader.