
Interest Payments vs Defense Spending: Every Quarter the US Crossed the Line Since 1947
Eco3min Research · Federal Finances
For 76 years US debt interest ran below the defense budget. Since 2024 it has run above — and stayed.
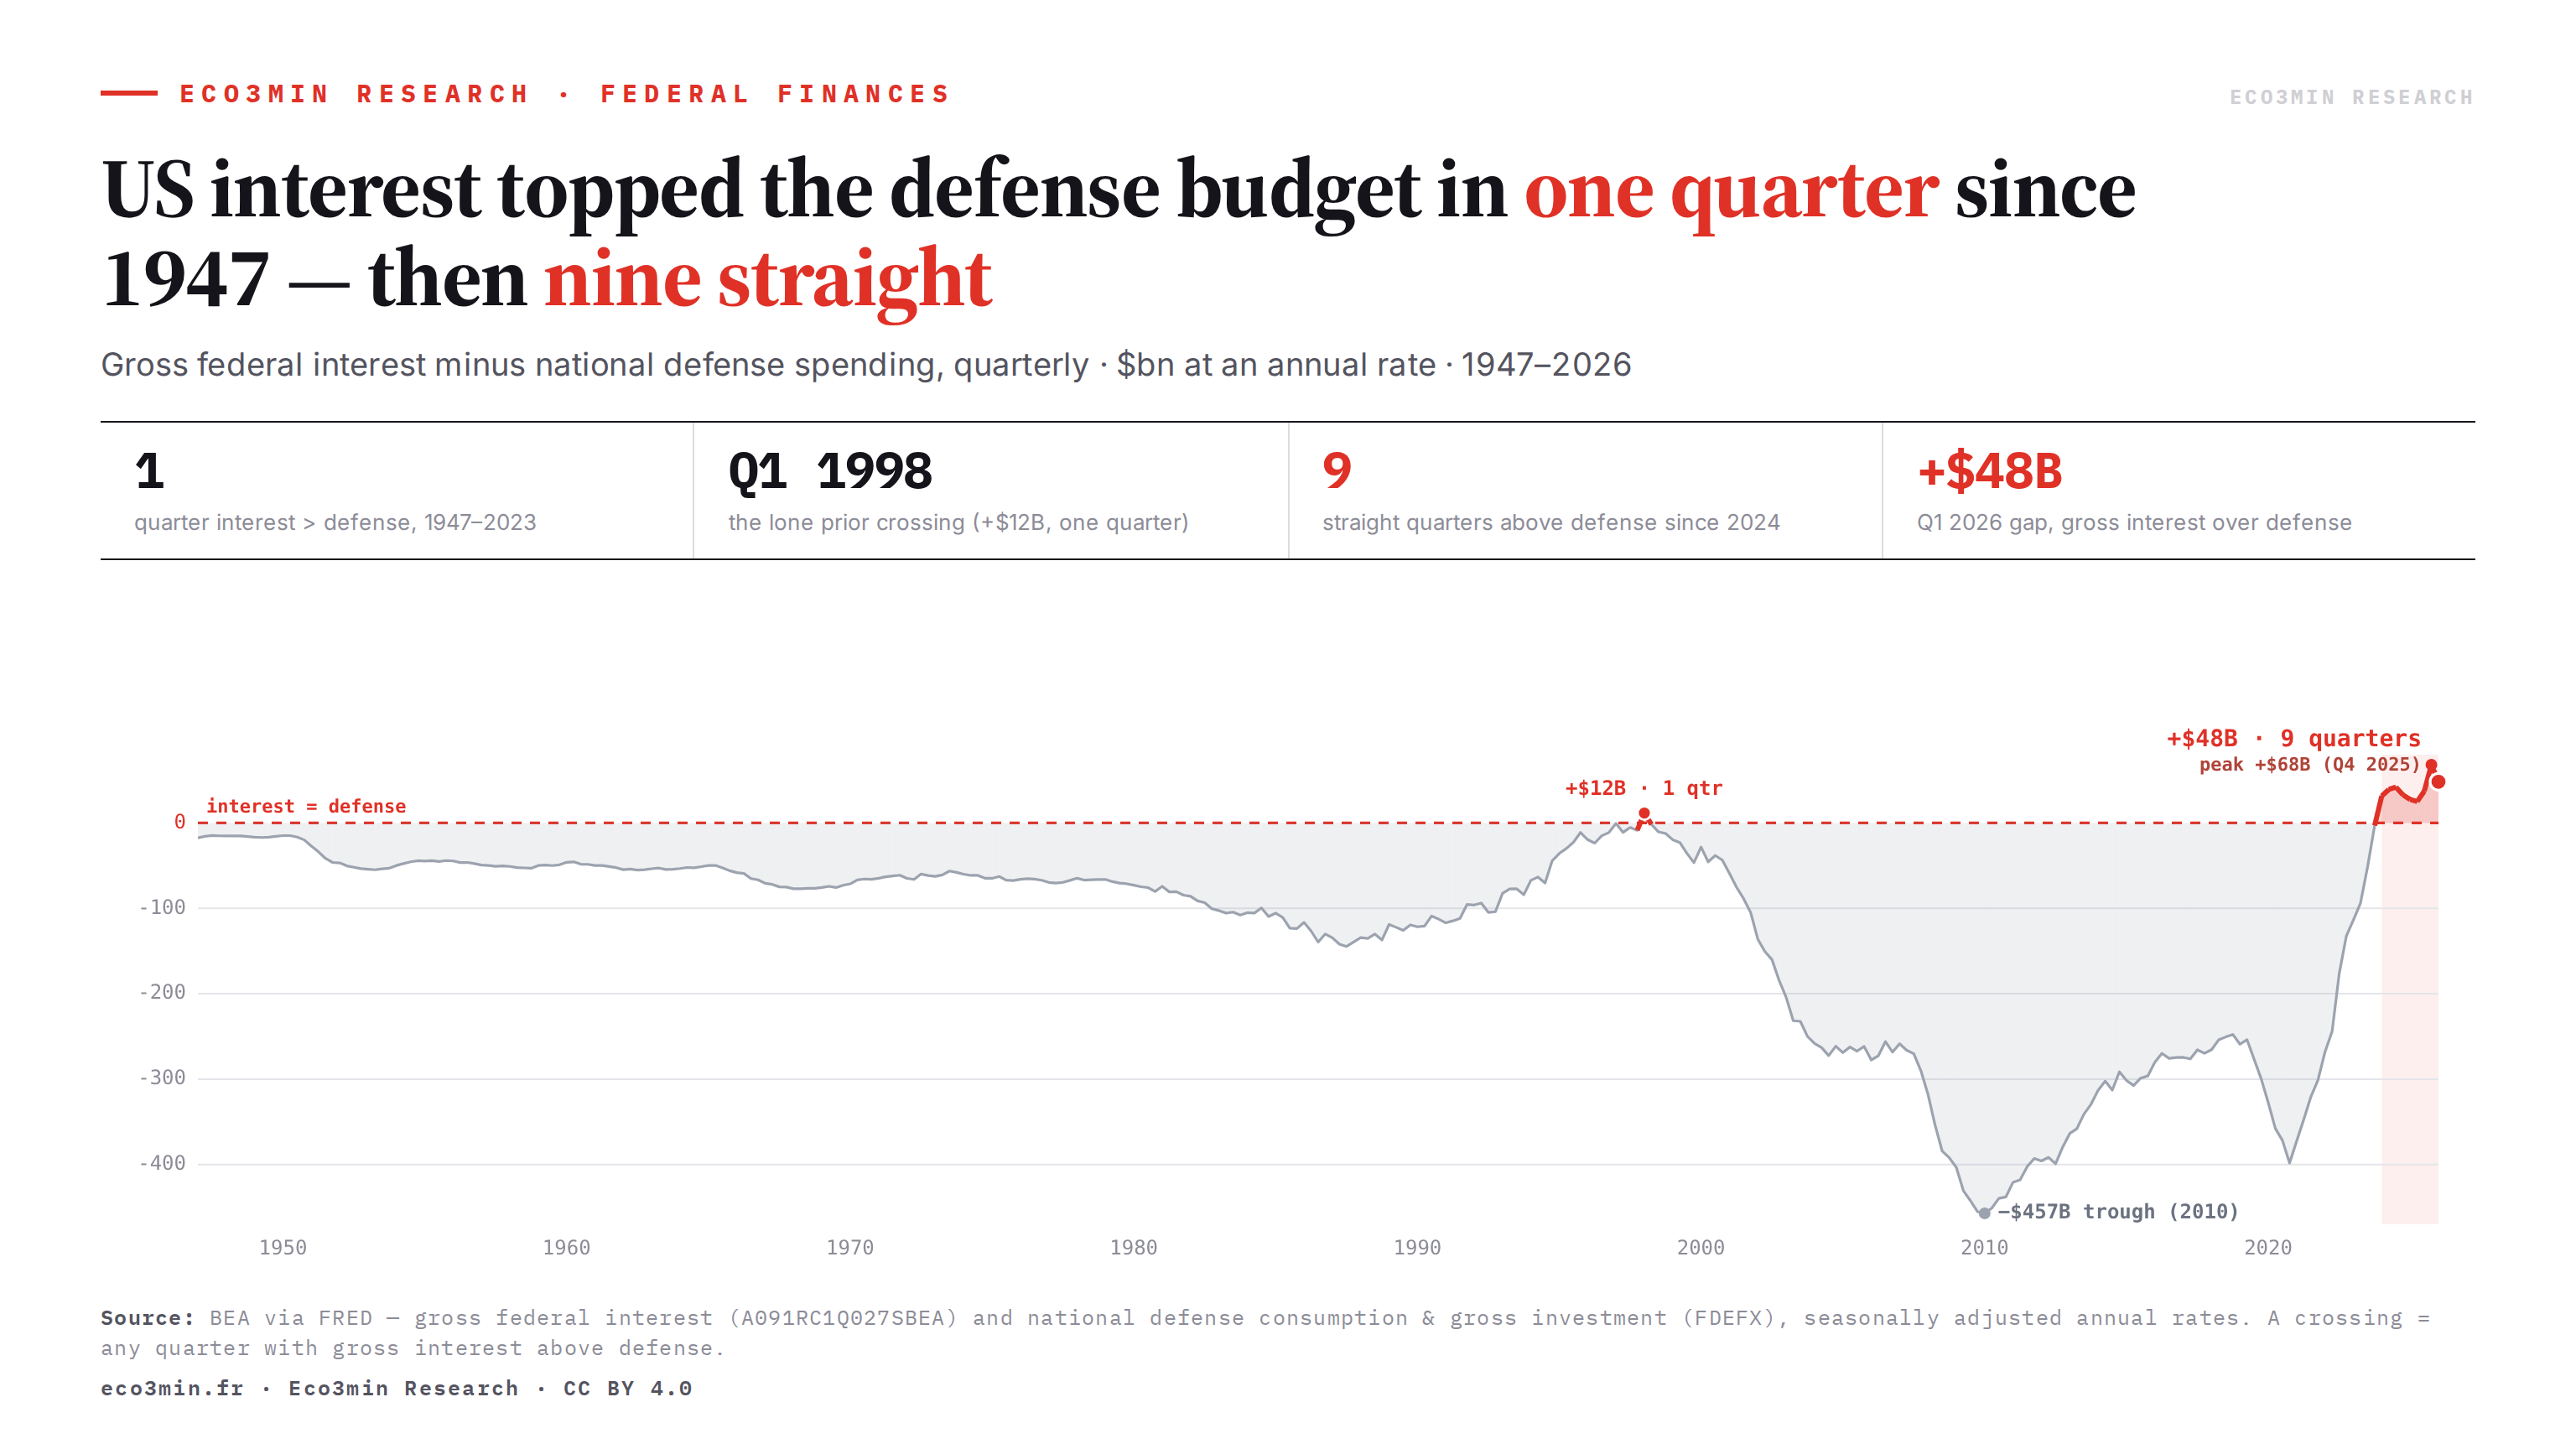
US gross federal interest payments now exceed national defense spending. The Congressional Budget Office reported the crossing in 2024, and it has held since. What the headline leaves out is how rare it is: in the national-accounts series back to 1947, gross interest has topped defense in exactly one prior quarter.
That quarter was the first of 1998, when interest edged $11.7 billion above defense for three months and then fell back. The 2024 crossing did not fall back. Interest has stayed above defense for nine consecutive quarters through the first quarter of 2026, with the gap ranging from $25 billion to $68 billion (all figures at annual rates). This page compiles every quarter since 1947 in which US gross interest exceeded defense, the size of each crossing, and what the comparison does and does not show.
From 1947 to 2023, US gross federal interest exceeded defense spending in a single quarter — Q1 1998, by $11.7 billion, for three months. Since 2024 it has stayed above defense for nine straight quarters, the gap reaching $48 billion by Q1 2026. The crossing also holds on the CBO’s stricter net-interest measure. It is a dollar crossing, not a record share of GDP.
01A level crossing the CBO already flagged
The dominant framing of this comparison is well established, and it comes from official sources. In its mid-2024 outlook the Congressional Budget Office stated that, beginning in 2025, interest costs exceed outlays for defense and for nondefense programs. The complete history is documented in our US federal interest payments dataset. The House Budget Committee titled a May 2024 release on the same point. That US interest now outranks defense is not in dispute. An interest line that outgrows a programme line changes what the budget buys, not only what it costs, which is the question raised by the composition of public expenditure.
What the indicator measures matters for reading it. The series here is gross federal interest from the national income accounts (BEA, via FRED series A091RC1Q027SBEA), measured at an annual rate, set against national defense consumption and gross investment from the same accounts (FRED series FDEFX). “Gross” is the load-bearing word: it counts interest paid to the public and interest credited to federal trust funds alike. The choice of measure changes the dollar magnitudes but, as Section 05 shows, not the conclusion.
Both series are drawn from the national income accounts, so they are directly comparable quarter to quarter. Budget (cash) figures from the Treasury and CBO are constructed differently and run $200–300 billion apart from the national-accounts numbers. Mixing the two frames is the most common way this comparison goes wrong; this page keeps to the national accounts throughout and reports the budget figures separately where they are needed.
02Every quarter US interest topped defense since 1947
The repeated version of this fact is simply “interest now exceeds defense.” The quarterly record is more precise. Across the 317 quarters from 1947 through the first quarter of 2026, gross interest exceeded defense in ten — one before 2024, and nine since. The other 307 quarters had defense above interest, often by a wide margin.
Explore the gap below. The chart plots gross interest minus defense; below the zero line, defense is larger (the rule for most of the post-war period); above it, interest is larger. The line spends decades deep in negative territory, reaching about −$457 billion in 2010, then closes the gap and crosses zero.
The table lists every quarter in which gross interest exceeded defense, with both underlying levels and the gap. Defense pulled back ahead in the quarter after the 1998 touch; it has not since the first quarter of 2024.
| Quarter | Gross interest | Defense | Gap (int − def) | Episode |
|---|---|---|---|---|
| Q1 1998 | $368.3B | $356.6B | +$11.7B | Lone prior crossing |
| Q1 2024 | $1,071.2B | $1,039.6B | +$31.6B | Sustained run begins |
| Q2 2024 | $1,103.6B | $1,064.3B | +$39.3B | Sustained run |
| Q3 2024 | $1,146.2B | $1,104.2B | +$42.0B | Sustained run |
| Q4 2024 | $1,155.6B | $1,122.7B | +$32.9B | Sustained run |
| Q1 2025 | $1,144.2B | $1,116.6B | +$27.6B | Sustained run |
| Q2 2025 | $1,160.9B | $1,135.8B | +$25.1B | Sustained run |
| Q3 2025 | $1,199.2B | $1,161.9B | +$37.3B | Sustained run |
| Q4 2025 | $1,227.5B | $1,159.2B | +$68.3B | Sustained run — widest gap |
| Q1 2026 | $1,218.9B | $1,170.6B | +$48.3B | Sustained run — latest |
Gross federal interest (FRED A091RC1Q027SBEA) and national defense consumption and gross investment (FRED FDEFX), seasonally adjusted annual rates. A crossing is any quarter in which gross interest exceeds defense. The other 307 quarters since 1947 had defense above interest. Source: BEA via FRED; Eco3min calculations.
- Gross interest exceeded defense in 10 of 317 quarters since 1947 — one before 2024, nine since.
- The lone earlier crossing, in Q1 1998, lasted a single quarter and measured +$11.7B; defense was back ahead three months later.
- Over the 2024–2026 run the gap has ranged from +$25B (Q2 2025) to +$68B (Q4 2025), standing at +$48B in Q1 2026.
03Sustained, not a blip
1998 was a single quarter: gross interest reached $368.3 billion against defense of $356.6 billion, then defense moved back ahead the following quarter and stayed there for a quarter of a century. The 2024 crossing is different in kind. Interest crossed in the first quarter of 2024 at $1,071 billion versus $1,040 billion and has held above defense for nine quarters. The gap has not moved in a straight line — it narrowed to $25 billion in mid-2025 before jumping to its widest, $68 billion, in the fourth quarter of 2025, and stood at $48 billion in early 2026 — but no quarter has fallen back below the line.
The distinguishing feature is persistence. A one-quarter boundary touch in 1998 is not the same event as more than two years above the line with no quarter back below it. On the national accounts, the post-war norm — defense above interest — has been interrupted exactly twice, and only the second interruption has lasted. A norm that holds for seven decades and then gives way is the textbook shape of a structural break, the very notion at the centre of the structural-break reading of macro-financial regimes.
04Why interest overtook defense
The crossing is not a defense story. National defense spending kept rising in dollar terms throughout; it did not fall. It is an interest story, and a mechanical one. From the first quarter of 2020 to the first quarter of 2026, gross federal interest rose 2.2 times while national defense rose 1.3 times (national accounts, annual rate; Eco3min calculations on BEA data).
Two forces drive the interest leg. The Federal Reserve raised its policy rate from near zero to 5.25–5.50% across 2022 and 2023 (Federal Reserve data), and that repricing applied to a federal debt stock far larger than in any prior tightening cycle. The effect builds with a lag, because Treasury debt does not reprice all at once: much of it was issued at the very low yields of the 2010s and is only now maturing and refinancing at current rates.
The average interest rate on the federal debt keeps climbing even after the Fed has paused, as older low-coupon securities are replaced by new ones at 4%-plus. Documentation: the Federal Reserve’s record of FOMC rate decisions. Defense, by contrast, grows roughly with appropriations and inflation and has no comparable compounding mechanism. That asymmetry — an interest bill that reprices a multi-trillion-dollar stock versus a defense budget set year by year — is what carried interest past defense and keeps it there.
05Gross or net, accounts or budget: the crossing holds either way
A fair objection is that this uses gross interest, which includes payments the government effectively makes to itself — interest credited to Social Security and other federal trust funds — that some analysts argue is not a real burden. On that view the right benchmark is net interest, the measure the CBO uses in its budget projections. The crossing survives the switch. On a budget basis, net interest also exceeded defense outlays in both fiscal 2024 and fiscal 2025: net interest of $881 billion then $970 billion, against CBO defense outlays of $855 billion then $859 billion (CBO and Third Way data). The conclusion holds on the stricter measure; only the dollar figures and the exact historical record change with it. The wider context: our breakdown of debt sustainability, shadow banking and systemic fragilities.
First, this is a level crossing, not a record share of the economy. Gross interest is 3.8% of GDP, below its 5.0% peak in early 1991; on the narrower net measure, the CBO reports interest at its highest share of GDP since at least 1940. “Highest ever” is true on one measure and false on another, so the durable claim is the dollar crossing, not a GDP record. Second, the “one prior quarter since 1947” record is specific to the national-accounts series used here; a budget-basis history would draw the line in different places. The robust, measure-independent statement is narrow and exact: by every common measure US interest now exceeds defense, and on the national accounts it has done so in only one other quarter in 79 years. A related strand of the same fiscal story is the fading US investment-income surplus.
06Methodology & data
The interest series is gross federal interest payments from the national income accounts (BEA, via FRED series A091RC1Q027SBEA), at a seasonally adjusted annual rate. Defense is national defense consumption expenditures and gross investment from the same accounts (FRED series FDEFX). A crossing is any quarter in which gross interest exceeds defense. GDP shares use nominal GDP (FRED series GDP). Budget figures cited for the net-interest comparison are on a fiscal-year basis from the CBO and are not mixed with the quarterly national-accounts figures. All calculations here are by Eco3min from the public series. A complementary angle: large deficits run outside recession.
| Series | Source | Coverage | Latest |
|---|---|---|---|
| Gross federal interest | FRED · A091RC1Q027SBEA | 1947–2026 | $1,218.9B |
| National defense (C+I) | FRED · FDEFX | 1947–2026 | $1,170.6B |
| Nominal GDP | FRED · GDP | 1947–2026 | $31,819B |
| Net interest (budget) | CBO · annual | FY1962–2025 | $970B (FY25) |
import pandas as pd

# Gross federal interest and national defense, straight from FRED — no API key
base = "https://fred.stlouisfed.org/graph/fredgraph.csv?id="
itr = pd.read_csv(base + "A091RC1Q027SBEA", parse_dates=["observation_date"])
dfn = pd.read_csv(base + "FDEFX", parse_dates=["observation_date"])

df = itr.merge(dfn, on="observation_date")
df.columns = ["date", "interest", "defense"]
df["gap"] = df["interest"] - df["defense"]

# Every quarter interest exceeded defense
print(df[df["gap"] > 0][["date", "interest", "defense", "gap"]])07Data & reproducibility
The quarterly series used in the chart and table — gross interest, defense, and the gap — is available in open format, updated when the underlying national-accounts data are revised.
License: Creative Commons Attribution 4.0 (CC BY 4.0). Free for research, academic and journalistic use with attribution.
08Questions & answers
Does the US spend more on interest than on defense?
When was the only other time interest exceeded defense?
Is US interest spending at a record share of GDP?
Does the crossing hold if you use net interest instead of gross?
Why did interest overtake defense?
What is the difference between gross and net interest?
09Sources & limitations
- PrimaryBEA via FRED — Federal government current expenditures: interest payments (A091RC1Q027SBEA), 1947–present.
- PrimaryBEA via FRED — National defense consumption expenditures and gross investment (FDEFX), 1947–present.
- OfficialCongressional Budget Office — The Budget and Economic Outlook (2024, 2025): interest exceeding defense; net interest as a share of GDP.
- OfficialUS House Budget Committee — release on interest costs surpassing national defense, May 2024.
- ContextThird Way — net interest and defense outlays, FY2024–FY2025.
- Gross versus net interest differ. This page uses gross interest from the national accounts and reports the net, budget-basis comparison alongside it; the conclusion holds on both.
- National-accounts and budget figures are not interchangeable. They run $200–300 billion apart; the quarterly record and the fiscal-year figures are kept separate throughout.
- This is a level crossing, not a record share of GDP. Gross interest is 3.8% of GDP, below its 5.0% peak in 1991.
- The “one prior quarter since 1947” record is specific to this series. A budget-basis history would place the historical crossings differently.
Last updated — 15 September 2026
Disclaimer – Financial Information: The analyses, commentary, and content published on eco3min.fr are provided for informational and educational purposes only. They do not constitute investment advice or a solicitation to buy or sell financial instruments. Past performance is not indicative of future results. All investment decisions involve risk and are the sole responsibility of the reader.