The 2020 Covid Shock: the switch into a disinflationary slowdown
How, in the spring of 2020, the United States switched into a disinflationary slowdown: reading the crisis through the Eco3min indicators.
A late-cycle US economy, markets at record highs, and a shock originating outside the financial system. Over a few weeks in February and March 2020, the Covid-19 pandemic brought entire swaths of activity to an abrupt halt. The recession that followed was, in its instantaneous scale, without precedent in the postwar series. Yet the cyclical destination was the same as in 2008 — a disinflationary slowdown — and the financial stress, for its part, never came close to that of the previous crisis.
In the spring of 2020, a health shock switched the United States into a disinflationary slowdown: growth collapsed, core inflation intact. The response, of unprecedented speed, contained the financial stress — the financial conditions index peaked at +0.30, far from the +3.07 of 2008.
Timeline of the switch
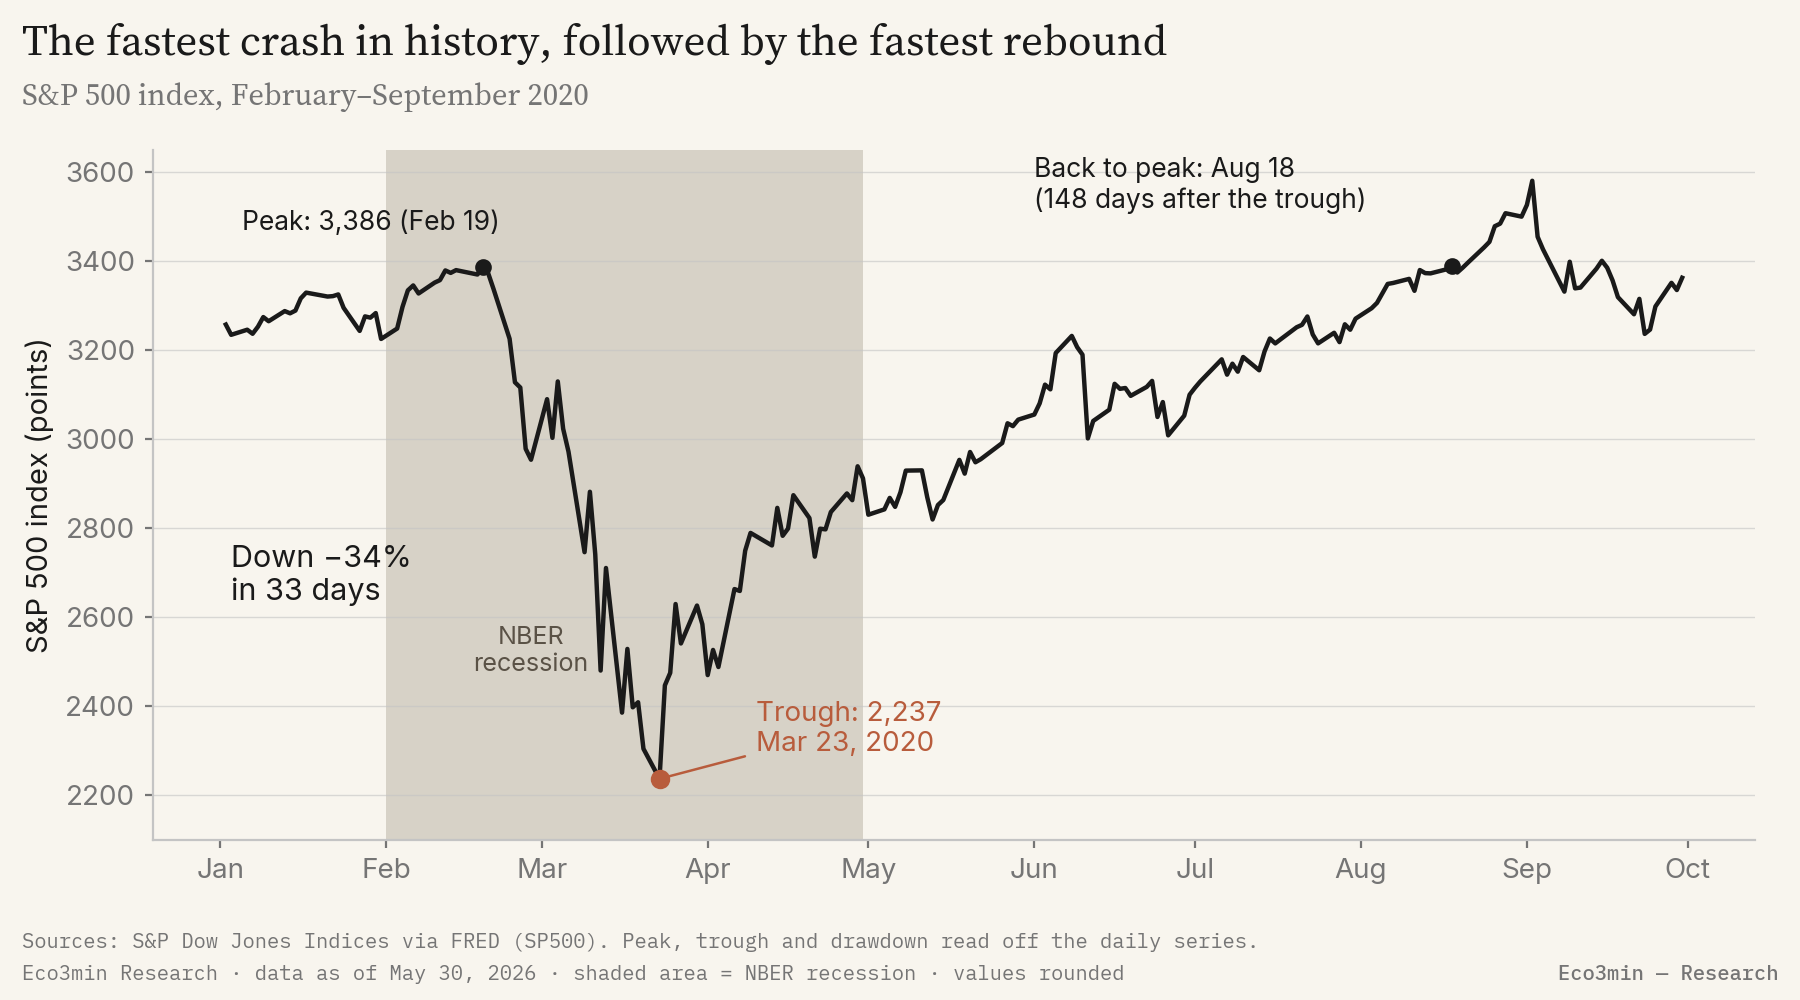
Six weeks separate the market peak from its low.
- January 30, 2020 — the World Health Organization declares a public health emergency of international concern; markets remain near their records.
- February 19, 2020 — the S&P 500 prints its peak at 3,386 points. The shock is not yet in prices.
- March 9–12, 2020 — equity markets collapse, oil plunges, volatility spikes; dollar funding markets tighten.
- March 15–16, 2020 — the Federal Reserve cuts its policy rate to 0–0.25% and restarts asset purchases; swap lines with the major central banks are reopened (March 19–20).
- March 23, 2020 — S&P 500 trough at 2,237 points; the Fed announces asset purchases with no stated ceiling. The rebound begins the same day.
- March 27, 2020 — enactment of the CARES Act, a $2.2 trillion fiscal package.
The indicators before the crisis
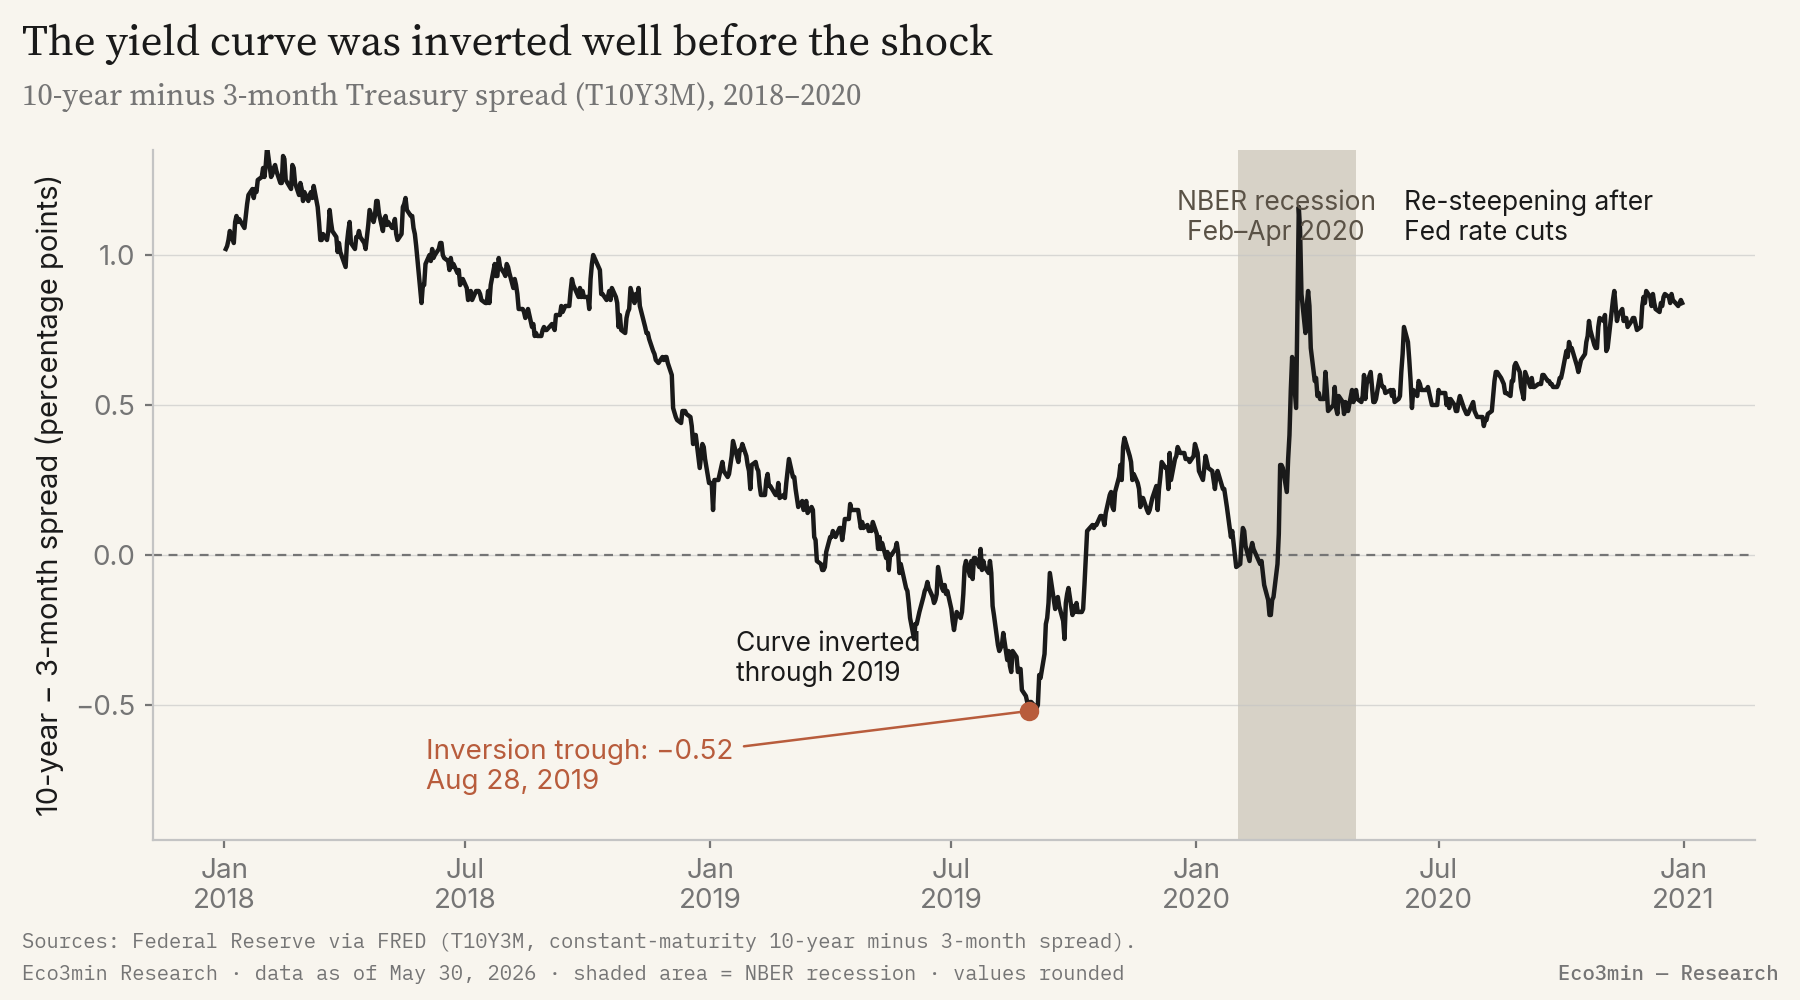
On the eve of the shock, the Eco3min series described a late-cycle economy — not a pandemic. This is the most important difference from 2008: in 2007, the indicators were signaling the crisis to come; in 2020, they described an end-of-expansion fragility, with nothing able to signal the trigger, exogenous by nature.
Inverted across much of 2019, down to −0.52 on August 28, 2019 (Federal Reserve, T10Y3M) — the classic late-cycle signal.
Yield curveSlightly negative in early 2020 (−0.14 in January), reflecting growth already below trend (Chicago Fed).
National activity indexHighly accommodative at −0.30 in late February 2020: no prior funding stress (Chicago Fed).
Financial conditionsStable around 1.9% year over year entering the crisis, below the 2% target (Dallas Fed).
Core inflationThe dominant signal was that of an expansion reaching maturity. The yield curve had inverted as early as spring 2019 and remained so intermittently into early 2020: over the twelve months preceding March 2020, the spread between the 10-year and the 3-month spent close to half of its trading days in negative territory. This inversion measured a late-cycle tension — a tight labor market, a long expansion, trade frictions — not the arrival of a pandemic. None of the series the Eco3min engine monitors could anticipate an administrative halt to activity: the 2020 trigger was entirely external to the economic and financial system these indicators describe. In 2007, by contrast, jobless claims were already rising, housing was retreating, and financial conditions were tightening ahead of the recession: the 2008 sequence was legible in the series, the 2020 one was not. The inversion had in fact partly unwound in autumn 2019, as the Federal Reserve cut rates pre-emptively — a mid-cycle easing, unrelated to the shock to come.
The regime switch
The transmission channel was unprecedented in its nature. The shock did not start in credit or housing, but in an administrative halt to activity: lockdowns, closures, a simultaneous collapse of supply and demand. Within a few weeks, the Chicago Fed activity index (CFNAI-MA3) falls to −7.53 in April 2020, its lowest point since the series began in 1967. Weekly initial jobless claims (ICSA) jump from 208,000 in early March to a peak of 6.14 million on April 4, 2020, and the unemployment rate reaches 14.8% in April. The Sahm-type recession rule built into the engine switches the growth axis firmly into negative territory. Gross domestic product contracts by about a third at an annualized rate in the second quarter of 2020, and nearly 22 million payroll jobs disappear in the months of March and April alone (Bureau of Labor Statistics).
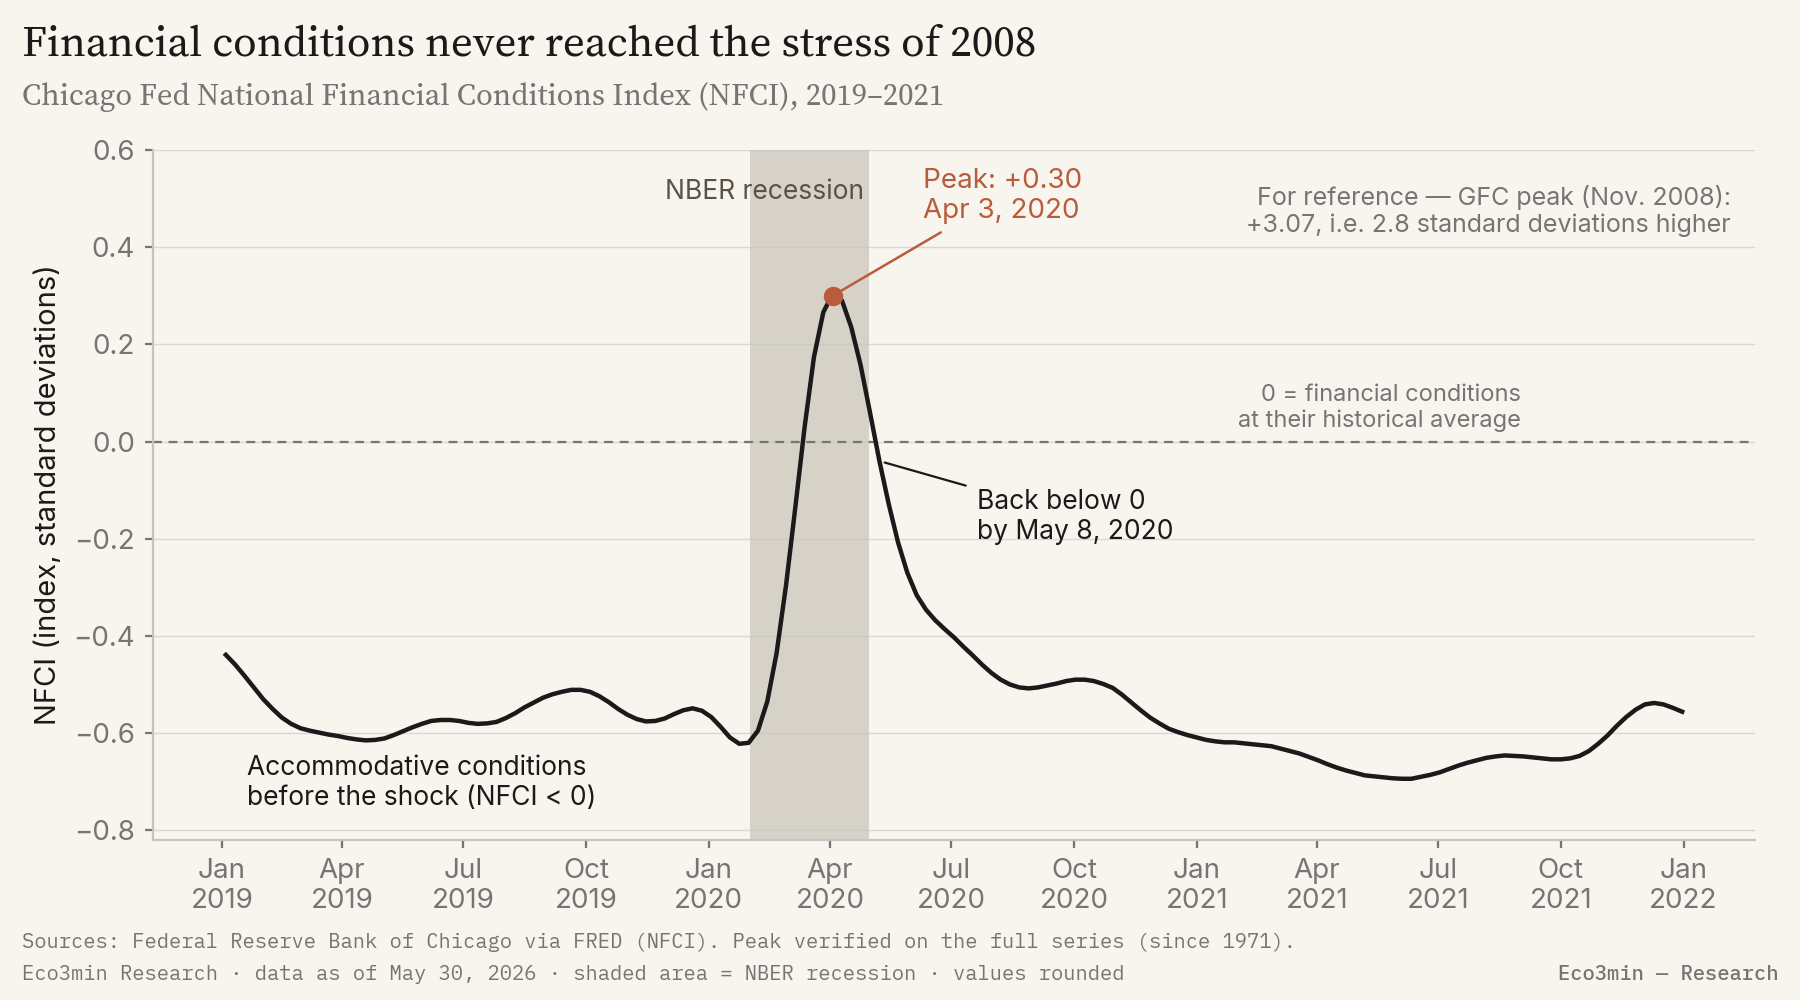
Over the second quarter of 2020, the Eco3min classifier returns the Slowdown state (negative growth G−, neutral inflation I=). The three US inputs of the engine converge: activity collapses, as just seen; core inflation as measured by the Dallas Fed Trimmed Mean PCE holds at 1.73% year over year at the April trough, with no deflationary switch; and the Chicago Fed National Financial Conditions Index (NFCI) touches +0.30 on April 3 before receding. This reading is literal: the period is after 2003 and the three inputs are available, which places the result inside the engine’s documented computation window.
The neutrality of the inflation axis may surprise, given so brutal a collapse in demand. It rests on two simultaneous mechanisms: supply contracted at the same time as demand, under the effect of closures and supply-chain disruptions; and fiscal support — direct payments to households, expanded unemployment insurance — sustained nominal incomes. Core inflation slowed without ever switching into deflation, which distinguishes 2020 from the durable deflationary spiral of 1929.
The stress overlay, by contrast, stays neutral over the regime horizon — and this is the distinctive trait of 2020. At the April 3 peak, the NFCI reaches +0.30, the precise threshold the Eco3min engine uses to flag a dollar funding tension; but it does not hold there, slipping back below zero by May 8, 2020, five weeks later. The threshold was touched at the height of the shock, never durably established: the Dollar Shortage overlay was grazed, not triggered. In autumn 2008, the same index had peaked at +3.07 and stayed in stress territory for months. The 2020 episode did involve a real funding tension — the broad dollar (DTWEXBGS) appreciates 7.2% between February 24 and March 23, and the Federal Reserve reopens its swap lines on March 19 and 20 — but that tension dissipated before crystallizing into a durable dollar-shortage regime. The NFCI, the engine’s primary signal, touched the threshold without confirming it: the speed of the response extinguished it.
The cyclical destination of this crisis is thus the disinflationary meta-regime of the Eco3min Atlas (the disinflationary regime). This page describes the sequence of the switch; the Atlas page describes the destination state.
The central bank response
The monetary response stood out for its speed even more than its size. The federal funds rate was brought down from 1.50–1.75% to 0–0.25% in two decisions, on March 3 and March 15, 2020 — 150 basis points in twelve days, where the 2007–2008 easing had been spread over more than a year. On March 23, the Federal Reserve announces asset purchases with no stated ceiling and extends its programs to corporate credit. The Fed’s balance sheet (WALCL) goes from about $4.3 trillion in mid-March to $7.1 trillion by late June 2020, an expansion of some $2.8 trillion in three months.
Beyond rates and asset purchases, it was the lender-of-last-resort role in dollar funding markets that extinguished the March tension. The reopening of swap lines with the other major central banks, then the setup of a repo facility for foreign authorities, stabilized access to dollars on an international scale. This intervention explains why the funding tension, real in mid-March, did not take hold.
The scale of the support exceeded that of 2008. The expansion of the Fed’s balance sheet over the months of 2020 alone was of an order of magnitude comparable to the entire set of asset-purchase programs deployed between 2008 and 2014, but concentrated over a few months instead of several years; a series of emergency facilities covering commercial paper, money market funds, corporate bonds, and lending to local governments was activated within weeks. It is this combination of speed, size, and coordination with the Treasury that kept the March dislocation from extending.
Assets and markets
The equity path captures the singularity of the episode. The S&P 500 loses 33.9% between its February 19 peak (3,386 points) and its March 23, 2020 trough (2,237 points), the fastest decline of that magnitude in its history. But the rebound was just as fast: the index regains its record level on August 18, 2020, 148 days after the trough. In bond markets, the 10-year yield collapses toward its historical lows; in FX, the dollar sees a brief appreciation at the height of the dash for liquidity, before receding once the swap lines are restored.
Other markets saw dislocations as sharp as they were brief. In mid-March, the dash for liquidity reached even US Treasuries, normally the customary safe haven: their prices buckled for a few days, which led the Federal Reserve to announce massive purchases of government securities. In credit, high-yield bond spreads widened abruptly in March, before tightening once the Fed engaged on corporate credit. In commodities, the front-month WTI crude futures contract briefly fell into negative territory on April 20, 2020, under the effect of saturated storage capacity (NYMEX futures).
One contrast is worth underlining. Market panic, as measured by equity implied volatility (the VIX), briefly exceeded its autumn 2008 peak in March 2020. Financial conditions in the broad sense, however, stayed well below the stress of 2008, as the NFCI shows. The two measures do not capture the same thing: one, the short-term emotion of the equity market; the other, the overall state of credit, funding, and balance sheets — and it is this second dimension that determines the regime.
The trajectories and levels described here are retrospective, for historical analysis. They constitute neither a projection nor an investment recommendation, and past performance does not prejudge future performance.
What was different this time
As in the 2008 financial crisis, 2020 shows a marked recession, sharply rising unemployment, a brutal drop in equities, a flight to quality and to the dollar, and a massive Federal Reserve intervention combining zero rates and asset purchases. The cyclical destination is in fact identical: a slowdown of disinflationary meta-regime, negative growth and preserved core inflation. On the Eco3min grid, 2008 and 2020 land in the same place.
Three structural factors nonetheless distinguish 2020 from 2008.
- An exogenous trigger, not an endogenous one. In 2008, the shock arises from the heart of the financial system — mortgage credit and its securitization. In 2020, it comes from outside: an administrative halt to activity. The late-cycle indicators of 2019 described a mature expansion; none could, by construction, signal a pandemic.
- The speed of the response. The Fed brought its rate to zero in twelve days and expanded its balance sheet by some $2.8 trillion in three months; the CARES Act injected $2.2 trillion of fiscal support by late March. In 2008, the same type of response had unfolded over several quarters.
- A solvent starting point. In 2020, the banking system approached the shock recapitalized after a decade of post-2008 regulation. The tension was about liquidity, not the solvency of the financial system itself — whereas in 2008, banking insolvency was at the center of the crisis.
What invalidated the analogy is measurable. Despite an activity contraction more brutal than in 2008, the Chicago Fed financial conditions index peaked at +0.30 then slipped back below zero within five weeks, where it had reached +3.07 and persisted for months in 2008. The acute stress overlay observed in autumn 2008 never materialized in 2020, and the equity recovery — trough to peak in 148 days — was the fastest in history.
A qualification is needed so as not to over-read the parallel. The meta-regime destination — a disinflationary slowdown — is common to 2008, 2020, and the 2000-02 dot-com crash, another disinflationary episode of the Crisis Hub. What separates these crises is not their cyclical destination, but the intensity and duration of the accompanying financial stress: it is this dimension, not the regime label, that varied most in 2020.
The 2020 recession was more brutal than that of 2008, but the financial stress far milder: the Chicago Fed financial conditions index peaked at +0.30, against +3.07 in autumn 2008.
Where this crisis leads
The 2020 switch leads to the disinflationary regime of the Eco3min Atlas. The crisis page describes the sequence and speed of the transition; the Atlas page describes the destination state and its durable features.
Negative growth, preserved core inflation: the slowdown state where the US economy lands in spring 2020, a measured reading of the engine over a period after 2003.
Atlas — disinflationary regimeSources
- National Bureau of Economic Research (NBER), business-cycle dating (peak February 2020, trough April 2020).
- Federal Reserve, FOMC statements and March 2020 announcements (policy rate, asset purchases, swap lines).
- Federal Reserve Bank of Chicago, National Financial Conditions Index (NFCI) and Chicago Fed National Activity Index (CFNAI-MA3).
- Federal Reserve Bank of Dallas, Trimmed Mean PCE Inflation Rate.
- Eco3min data: 10-year − 3-month Treasury spread (T10Y3M), NFCI, CFNAI-MA3, Trimmed Mean PCE, federal funds rate (DFF), Fed balance sheet (WALCL), initial jobless claims (ICSA), unemployment rate (UNRATE), broad dollar (DTWEXBGS), S&P 500.
Last updated — 31 May 2026
Disclaimer – Financial Information: The analyses, commentary, and content published on eco3min.fr are provided for informational and educational purposes only. They do not constitute investment advice or a solicitation to buy or sell financial instruments. Past performance is not indicative of future results. All investment decisions involve risk and are the sole responsibility of the reader.