The Russia/LTCM crisis of 1998
How, in the summer of 1998, Russia’s default and the implosion of LTCM tipped markets into a dollar shortage: reading the crisis through the Eco3min indicators.
A crisis born in Moscow, carried by a New York fund, and one the U.S. financial conditions index almost ignored: 1998 compresses into a few weeks everything that separates a market panic from a turn in the cycle. The sequence can be read indicator by indicator, provided you watch the right ones.
The U.S. economy is running at full capacity when, on 17 August 1998, Russia defaults. The global flight to quality implodes LTCM, a very highly leveraged fund whose failure threatens the core of the financial system. The Federal Reserve orchestrates a private rescue and cuts rates three times. The destination is not a change in the U.S. cycle, but a layer-2 overlay: a dollar shortage coming from abroad.
Timeline of the shift
Five milestones sum up the passage from a distant emerging-market shock to a U.S. monetary-policy response.
- Summer 1997 — the Asian crisis triggers a flight to the dollar; the greenback appreciates against a broad basket of currencies.
- 17 August 1998 — Russia defaults on its domestic debt (GKO bonds), devalues the rouble and declares a moratorium on part of its external debt.
- 23 September 1998 — the Federal Reserve Bank of New York orchestrates a private rescue of LTCM: fourteen institutions inject roughly $3.6 billion, with no public money.
- 29 September 1998 — the first of three policy-rate cuts, which bring it from 5.50% to 4.75% by 17 November, including an inter-meeting cut on 15 October.
- 5 October 1998 — the 10-year Treasury yield reaches its trough, at 4.16%, the low point of the flight to quality.
A shock from abroad, in a solid U.S. economy
The 1998 crisis was not born in the United States. By mid-1998 the U.S. expansion was entering its eighth year: unemployment was at its lowest since the late 1960s, inflation remained contained, and equity indices were trading near record highs. Nothing in the domestic cycle pointed to a rupture.
The epicentre was elsewhere. Since the summer of 1997, a wave of crises had been striking emerging economies: chain devaluations across South-East Asia, capital flight, emergency bank recapitalisations. International investors retreated towards the dollar and assets judged safe. This preference for dollar liquidity was the backdrop to the coming shock: a funding pressure building at the periphery of the system, far from U.S. screens.
On 17 August 1998, Russia defaulted on its domestic debt, devalued the rouble and declared a moratorium on part of its external debt. This mechanism implies an abrupt repricing of emerging sovereign risk: a nuclear-armed state had just stopped honouring its commitments, something few participants had placed in their scenarios.
What makes this crisis distinctive
The usual reading files 1998 among the great financial panics, on a par with domestic crashes. The data suggest a more precise framing: 1998 was a global, leveraged and concentrated crisis that the aggregate of U.S. financial conditions barely registered.
Three traits set it apart. Global, because the trigger is an emerging sovereign default that spreads through capital flows. Leveraged, because transmission to the core of the system runs through a single fund, LTCM, whose positions rested on considerable borrowing. Concentrated, because the stress lodges in specific markets (credit spreads, swap spreads, off-the-run Treasuries) rather than across U.S. funding conditions as a whole.
This precision is more than a matter of vocabulary. It explains why one and the same episode can look cataclysmic from the trading desks and almost invisible in an aggregate financial-conditions index, as what follows shows.
The indicators before the crisis: the dollar had been climbing for a year
The first signal is not American: it is the dollar itself. Eco3min’s “Dollar Shortage” overlay monitors a cluster of dollar-funding strains, the first leg of which is the greenback’s appreciation against a broad basket of currencies. On that front, the pressure was readable well before the Russian default.
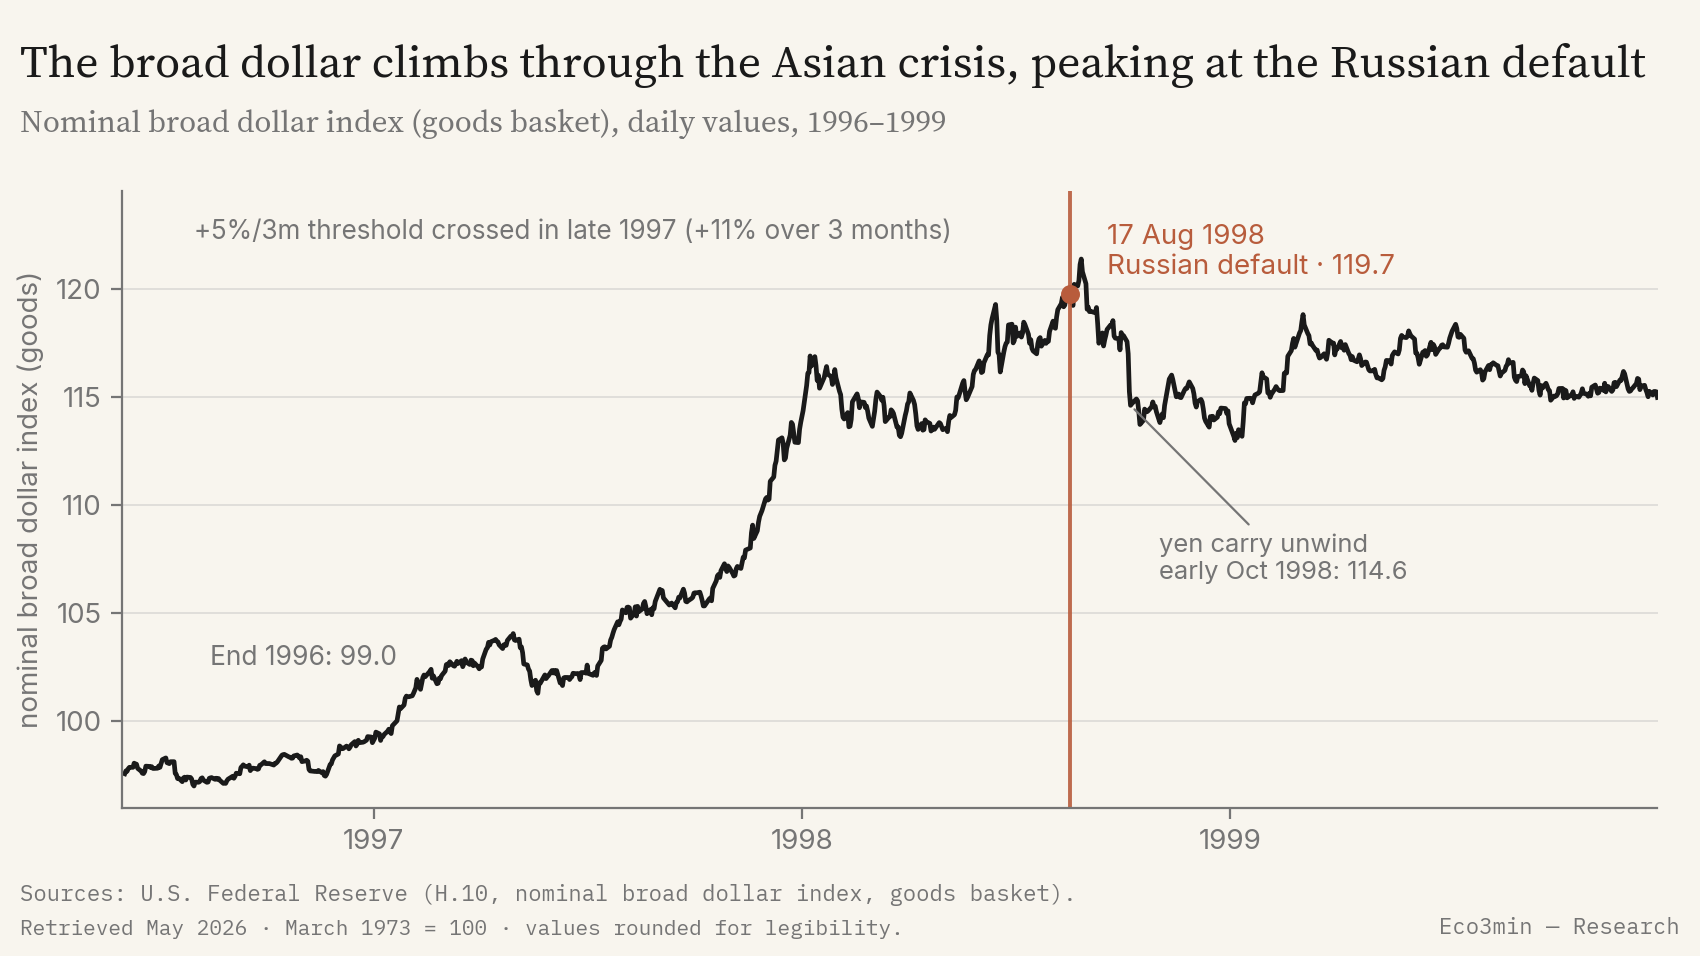
According to Federal Reserve data (H.10 release, nominal broad dollar index, “goods” basket), the index moves from about 99 points at the end of 1996 to 119.7 points on the date of the Russian default, 17 August 1998, a rise of roughly 21% over the Asian-crisis period. The fastest move concentrates in late 1997: close to 11% in three months between October 1997 and January 1998, which crosses the overlay’s reference threshold (a 5% appreciation over three months). The dollar-shortage signal was therefore lit several months before the acute phase.
One point matters for what follows: past the August peak, the broad dollar retreats. By early October 1998 it is back around 114.6 points, as the unwinding of yen carry positions sends the Japanese currency sharply higher. Funding pressure and the currency move are not the same thing: one precedes, the other reverses in the panic.
The overlay rests on a cluster of three measured signals. In 1998, two of them are only partly reconstructable, which sets the status of the reading (see the next section).
Rapid appreciation against a broad currency basket (threshold: +5% over 3 months). Signal lit from late 1997. Reference series begins after 2006; here, a “goods basket” substitute, available since 1995.
View the datasetAggregate index from the Federal Reserve Bank of Chicago (overlay threshold: a crossing of +0.30). The only signal directly available in 1998, and it never crosses that threshold.
View the datasetWidening of risky credit premia (threshold: +150 basis points over 4 weeks). This leg is not reconstructable for 1998: the history before 2023 is missing from the Eco3min store.
View the datasetThe shift: from the Russian default to the implosion of LTCM
The Russian default acts as a spark. Investors sell everything risky and rush into the safest securities, U.S. government bonds first among them. This flight to quality reads directly in the 10-year Treasury yield.
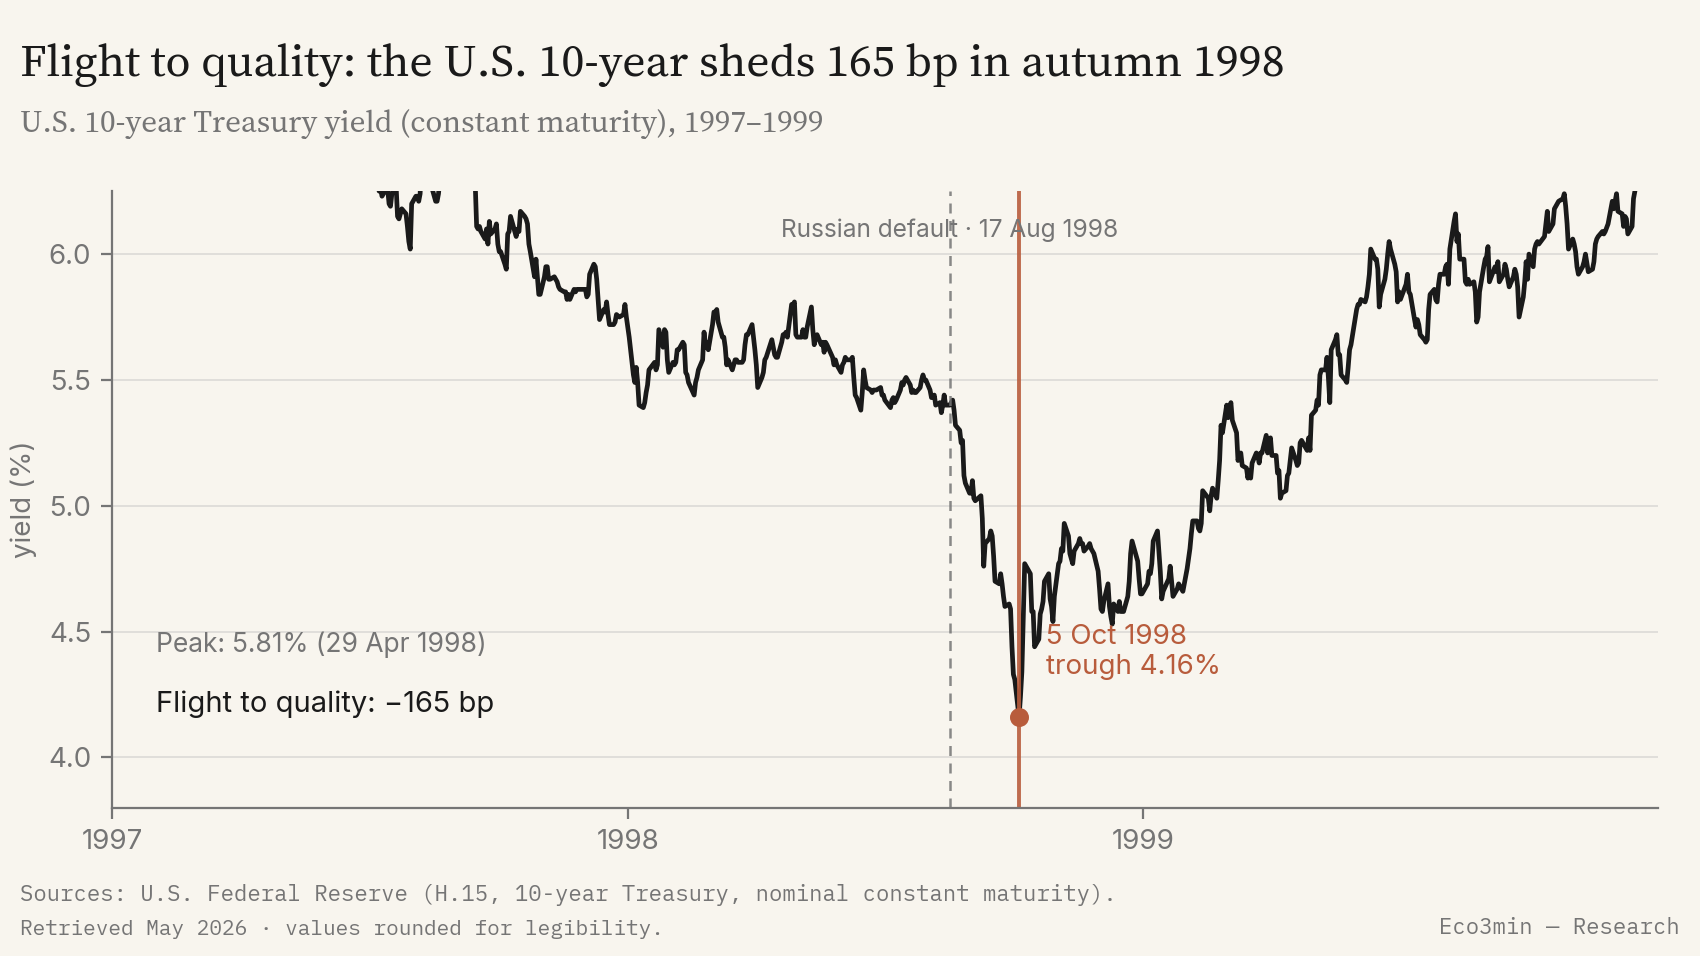
According to Federal Reserve data (H.15 release, 10-year Treasury at constant maturity), the yield moves from a high of 5.81% on 29 April 1998 to a trough of 4.16% on 5 October, a fall of 165 basis points. The 2-year follows the same path, from 5.71% on 27 April to 3.86% on 16 October, 185 basis points lower. This mechanism implies that price gaps between securities deform violently: precisely the terrain on which LTCM had built its positions.
The fund was betting on the convergence of valuation gaps, for instance between bonds that are close but imperfectly substitutable. When the panic makes those gaps diverge instead of tightening, losses pile up on credit-funded positions. Credit premia confirm the stress: the gap between Baa- and Aaa-rated corporate bonds, near 0.60 point in the summer (Federal Reserve, H.15, Moody’s yields), widens to about 1.0 point by the end of 1998. Divergence, not convergence, was what showed up.
For 1998, the “Dollar Shortage” reading is reconstructed and sits outside the classification model’s backtest window (after 2003). Of the overlay’s three signals, two are only partly available: the dollar runs through a substitute index (“goods” basket, before 2006) and the high-yield-spread leg is not reconstructable. The only directly measurable signal, the Federal Reserve Bank of Chicago’s financial-conditions index (NFCI), tops out at +0.02 in October 1998, well below the +0.30 trigger threshold. The period’s series therefore place a configuration of the Dollar Shortage type by its mechanism (flight to quality, funding squeeze, leveraged unwind), without a measured verdict from the model being claimable.
The destination of this crisis is thus the Dollar Shortage overlay of the Eco3min Atlas (the dollar-shortage regime). This page describes the sequence of the shift; the Atlas page describes the destination state.
The Federal Reserve’s response: three cuts and an orchestrated rescue
Faced with the risk that LTCM’s failure would spread, the Federal Reserve acted on two registers. On 23 September 1998, the Federal Reserve Bank of New York convened a consortium of fourteen financial institutions that injected about $3.6 billion to recapitalise the fund and wind it down in an orderly way. The operation was orchestrated by the Fed but mobilised no public money: it was a private rescue under supervision.
On the monetary register, the Federal Open Market Committee (FOMC) lowered its policy rate three times: from 5.50% to 5.25% on 29 September, then to 5.00% on 15 October at an unscheduled meeting, and finally to 4.75% on 17 November 1998. That is 75 basis points in seven weeks. The inter-meeting cut of 15 October, off the calendar, is a strong signal from a central bank seeking to halt a drying-up of liquidity.
The retrospective consensus dwells above all on moral hazard: by organising the rescue and easing, the Fed is said to have fed the risk-taking that would fuel the technology bubble. That reading is defensible, but it bears on the consequences, not on the diagnosis of the moment: in the autumn of 1998 the question put to the authorities was the chain failure of counterparties exposed to a single fund, not the valuation of equities.
Assets and markets: a stress the U.S. aggregate barely registered
This is where 1998 confounds. If one expects an aggregate of U.S. financial conditions to flare up during a crisis of this notoriety, the Federal Reserve Bank of Chicago’s index tells a different story.

According to Federal Reserve Bank of Chicago data, the NFCI peaks at +0.02 in the week of 16 October 1998, its highest level since 1991. A positive index signals conditions tighter than average, but this level stays at the edge of neutral: it is far from the +0.30 threshold that would activate the Dollar Shortage overlay, and further still from the +3.06 peak reached in late November 2008. Measured by this aggregate, the most resounding crisis of the decade only brought U.S. financial conditions back near their long-run average.
One possible reading refines the picture. Adjusted for the position in the cycle (the ANFCI index), the tightening reaches +0.34, which indicates conditions tighter than the macroeconomic environment of the moment implied. But the overlay’s threshold bears on the raw index, which itself stays at neutral. This weak signal, a real stress that does not cross the reference aggregate, is precisely what sets 1998 apart from a domestic crash.
The trajectories and levels described here are retrospective, for the purpose of historical analysis. They constitute neither a projection nor an investment recommendation, and past performance does not prejudge future performance.
On the equity side, the pullback was nonetheless marked: the S&P 500 shed on the order of 19% between its mid-July high and its late-August 1998 trough (on a closing-price basis), before a sharp rebound once the LTCM rescue and the rate cuts were under way. The gap between the violence felt in asset markets and the mildness of the financial-conditions aggregate sums up the concentrated character of the episode.
Why LTCM nearly took down the system
Understanding 1998 means understanding LTCM. The fund, founded in 1994 and advised by reputed traders as well as two future Nobel laureates in economics, practised relative-value arbitrage: spotting two instruments whose prices were meant to converge, buying the cheaper, selling the other, and pocketing the convergence. Each position earned little; profitability came from volume and leverage.
The scale of that leverage is the key element. According to the report of the President’s Working Group on Financial Markets (April 1999), LTCM carried a balance sheet on the order of $125 billion against equity of about $4.8 billion, a leverage close to 25 to 1, and a notional derivatives book in excess of $1 trillion. Such a structure is profitable as long as prices behave normally; it becomes lethal the moment volatility explodes and supposedly stable correlations break.
That is exactly what the Russian default produces. LTCM’s models assumed that different markets would not all collapse at the same time. The flight to quality does precisely that: everything risky falls together, everywhere, while safe-haven securities rise. Losses accumulate, margin calls land, and the fund has to sell into a market that no longer wants to buy, which widens still further the gaps it was betting would close.
The systemic danger lay not in the size of LTCM’s capital, which was modest, but in the web of its counterparties. The fund dealt with the world’s main investment banks, often on over-the-counter derivatives positions. A disorderly liquidation would have inflicted simultaneous losses on those institutions and frozen entire markets: the risk was not the failure of one fund, but the transmission of that failure to the balance sheets of the intermediaries at the core of the system. It is this contagion mechanism that justified, in the eyes of the New York Fed, a coordinated intervention.
A weak signal, rarely highlighted, illuminates the nature of the stress: swap spreads and the premium between “on-the-run” Treasuries (the most recent, most liquid) and “off-the-run” ones widened sharply in the autumn of 1998. These liquidity strains, internal to the plumbing of markets, do not show up in a mainstream index but mark where the system truly gave way. They are a reminder that the 1998 crisis was first a funding and liquidity crisis, specific to leveraged players, before being a crisis of the real economy, which it never reached.
From this standpoint, the comparison with the 2008 financial crisis has its limits. In 2008, the shock started at the core of the system (U.S. mortgage credit and bank balance sheets) and the financial-conditions aggregate soared to +3.06. In 1998, the shock came from abroad, ran through a single leveraged player, and the U.S. aggregate stayed at neutral. The same regime family (a layer-2 dollar shortage), but intensity and point of origin on an altogether different scale.
What was different this time
The natural comparable for 1998 is the 1997 Asian crisis, which belongs to the same layer-2 overlay. The resemblances are many: an emerging-market origin, a flight to quality and to the dollar, an appreciation of the broad dollar and a global funding stress, with no shift in the U.S. cycle in either case.
Three structural factors nonetheless set 1998 apart from the 1997 Asian crisis.
- The transmission channel. In 1998, contagion runs through a highly leveraged Western intermediary (LTCM) that carries it to the core of the developed world, whereas 1997 remains more broadly a matter of emerging currencies and banks.
- The nature of the shock. A hard sovereign default coupled with a moratorium (Russia) in 1998, versus breaks of currency pegs (Asia) in 1997.
- The response. Direct action by the Federal Reserve in 1998 (three rate cuts and an orchestrated rescue), where the International Monetary Fund was in the front line for Asia.
What invalidated the pure analogy is measurable: in 1998 the contagion reached the U.S. financial system (LTCM threatened the balance sheets of the large banks) and forced a U.S. monetary-policy response, which the 1997 Asian crisis had not. The contrast holds in two figures: 165 basis points of flight to quality on the 10-year and three rate cuts in 1998, against no Fed cut motivated by Asia in 1997. The page devoted to the 1997 Asian crisis covers that first episode in detail.
The lesson of 1998 goes beyond the anecdote of the rescued fund. It is a reminder that a dollar shortage can strike the core of the financial system without ever crossing the domestic aggregates, because leverage and interconnection turn a distant shock into a systemic threat. It is also why funding and liquidity indicators, more than the headline indices, are the first places such a crisis gives itself away.
At the LTCM peak of October 1998, the U.S. financial conditions index tops out at +0.02: the crisis was global and leveraged, not American.
Where this crisis leads
In the Eco3min grid, 1998 does not change the state of the U.S. cycle, which stays in its ordinary corridor; what is superimposed is a layer-2 overlay, the Dollar Shortage. The Atlas page describes its destination state, where this page describes the sequence of the shift.
A dollar shortage: flight to quality, the dollar sought as a haven, funding strains in the reserve currency. A short, reversible overlay, here in reconstructed status (signal cluster only partly available for 1998).
Atlas — Dollar ShortageSources
- U.S. Federal Reserve: H.10 release (nominal broad dollar index) and H.15 release (Treasury constant maturity, policy rate, Moody’s Aaa and Baa yields).
- Federal Reserve Bank of Chicago: National Financial Conditions Index (NFCI and ANFCI).
- President’s Working Group on Financial Markets, Hedge Funds, Leverage, and the Lessons of Long-Term Capital Management (April 1999).
- Federal Open Market Committee (FOMC) of the Federal Reserve: rate decisions of autumn 1998.
- Eco3min data: broad dollar, financial conditions (NFCI), 10-year and 2-year Treasury, policy rate, credit spreads.
Last updated — 31 May 2026
Disclaimer – Financial Information: The analyses, commentary, and content published on eco3min.fr are provided for informational and educational purposes only. They do not constitute investment advice or a solicitation to buy or sell financial instruments. Past performance is not indicative of future results. All investment decisions involve risk and are the sole responsibility of the reader.