The Volcker Shock, 1979-1982: forced disinflation
How, between 1979 and 1982, the United States exited the inflationary regime toward the disinflationary column: a reading of the Volcker shock through the Eco3min indicators.
To break a double-digit inflation that had taken hold, Paul Volcker’s Federal Reserve changed its operating target in October 1979 and let the policy rate climb to 19%. The slowdown that followed was not endured: it was the chosen instrument of disinflation.
Between 1979 and 1982, the Federal Reserve drove the effective federal funds rate to 19.1% on a monthly-average basis (Federal Reserve, H.15) to break a double-digit inflation whose CPI peaked at 14.8% in March 1980 (Bureau of Labor Statistics). At the cost of two recessions and unemployment at 10.8%, inflation receded below 3% by 1983: the economy left the inflationary column for the disinflationary one. Unlike 2008, the central bank did not respond to the slowdown, it engineered it.
What happened: an engineered disinflation
Most crises in the hub are shocks that a central bank tries to cushion. The Volcker shock is the reverse: here the recession is the tool, not the accident.
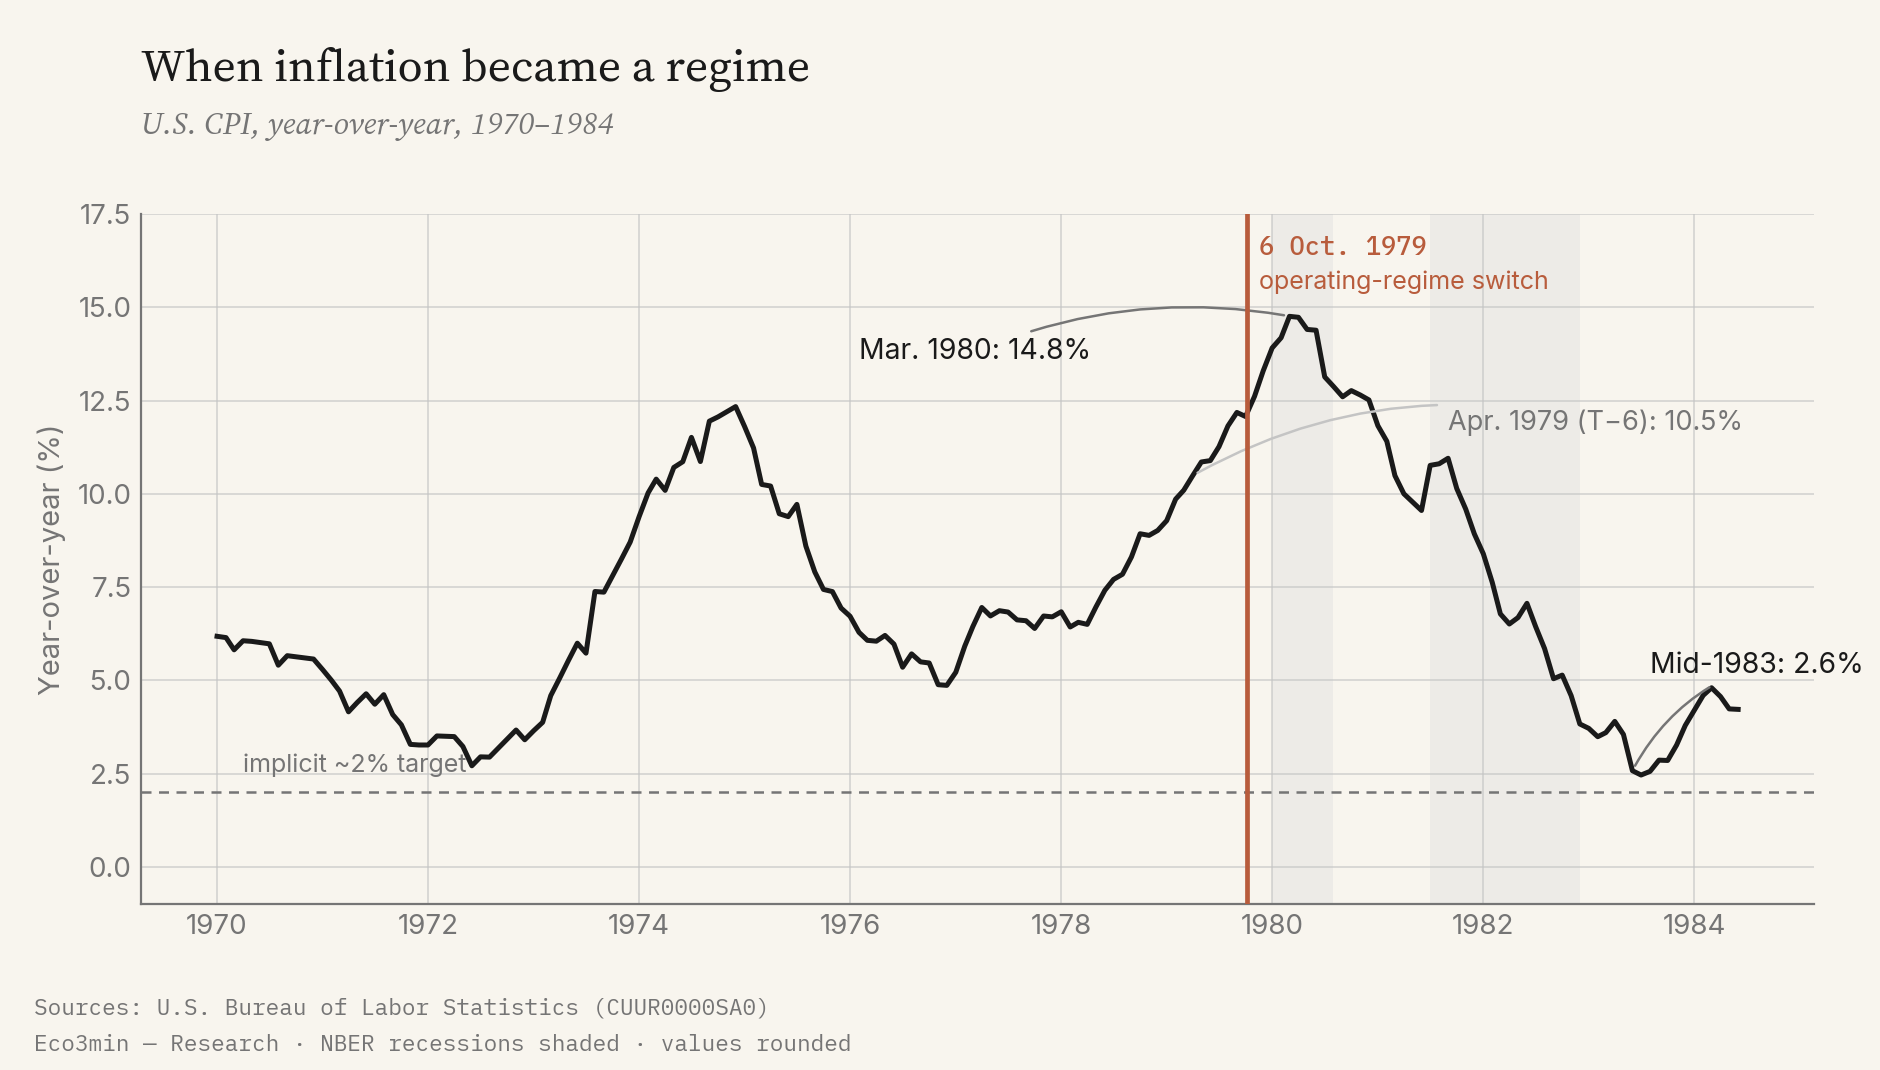
By the late 1970s, U.S. inflation was no longer a passing episode. The CPI rose by more than 10% year-over-year from the spring of 1979 and kept accelerating (Bureau of Labor Statistics, series CUUR0000SA0). It was the second double-digit wave in five years, after 1974: the sign that a mechanism had set in, where expected price increases fed realised ones.
The second oil shock, tied to the 1979 Iranian revolution, added pressure on energy and on headline prices. But reducing the inflation of the late 1970s to a supply shock would be an incomplete reading: the price rise then touched a broad range of goods and services and had become embedded in wages and contracts. It is precisely this anchoring, not the price of oil alone, that made disinflation slow to obtain.
Appointed to head the Federal Reserve on 6 August 1979, Paul Volcker made his decisive move on 6 October 1979: the Fed stopped steering the federal funds rate directly and instead targeted the quantity of bank reserves, letting the rate find the level that the fight against inflation imposed. This change in operating framework pushed the effective rate up to 19.1% on a monthly-average basis in June 1981, with a daily peak of 22.4% on 22 July 1981 (Federal Reserve, H.15).
The sequence cost two recessions, dated by the NBER from January to July 1980 and then from July 1981 to November 1982, and lifted the unemployment rate from 5.6% in the spring of 1979 to 10.8% in November 1982 (Bureau of Labor Statistics). But the objective was met: inflation, at 14.8% at its March 1980 peak, fell back below 3% by mid-1983. Read through the Eco3min grid, the economy shifts from the inflationary column toward the disinflationary one.
The signals before the shift
Six months before the change of course, the indicators did not describe a passing overshoot but an entrenched price regime.
In April 1979, about six months before the October turn, annual inflation already stood at 10.5%, and the month of the shift would see it at 12.1% (Bureau of Labor Statistics). The chart below shows the difference between a shock and a regime: after the 1974 peak, inflation never durably returned toward 2%, and a second climb carried it above 14% in 1980.
Three signals converged as the turn approached, and each maps to a series tracked on the site.
What the series were saying
Three independent observations pointed, in late 1979, toward a durable inflationary regime rather than a transient peak.
Double-digit inflation
The CPI exceeded 10% year-over-year from the spring of 1979 and accelerated toward 12% by the autumn. This was no longer a one-off overshoot but the second double-digit episode in five years.
the consumer price seriesA lagging policy rate
At 11.4% in September 1979, the effective federal funds rate remained below inflation: the real rate was negative and monetary policy stayed, in real terms, accommodative.
the federal funds rateUnanchored expectations
The repetition of inflation waves anchored the belief that prices would keep rising. That expectation, embedded in wages and contracts, is what made disinflation slow and costly to achieve.
the disinflationary regime gridThe trigger: 6 October 1979
The turn was not one more rate hike, but a change in the thing the Fed steered.
Until 1979, the Fed set a federal funds rate target and adjusted it cautiously. On 6 October 1979, at an exceptional meeting, it adopted a bank-reserves target: it would now control the quantity of central-bank money and let the rate adjust freely. The consequence for the cost of money was immediate.
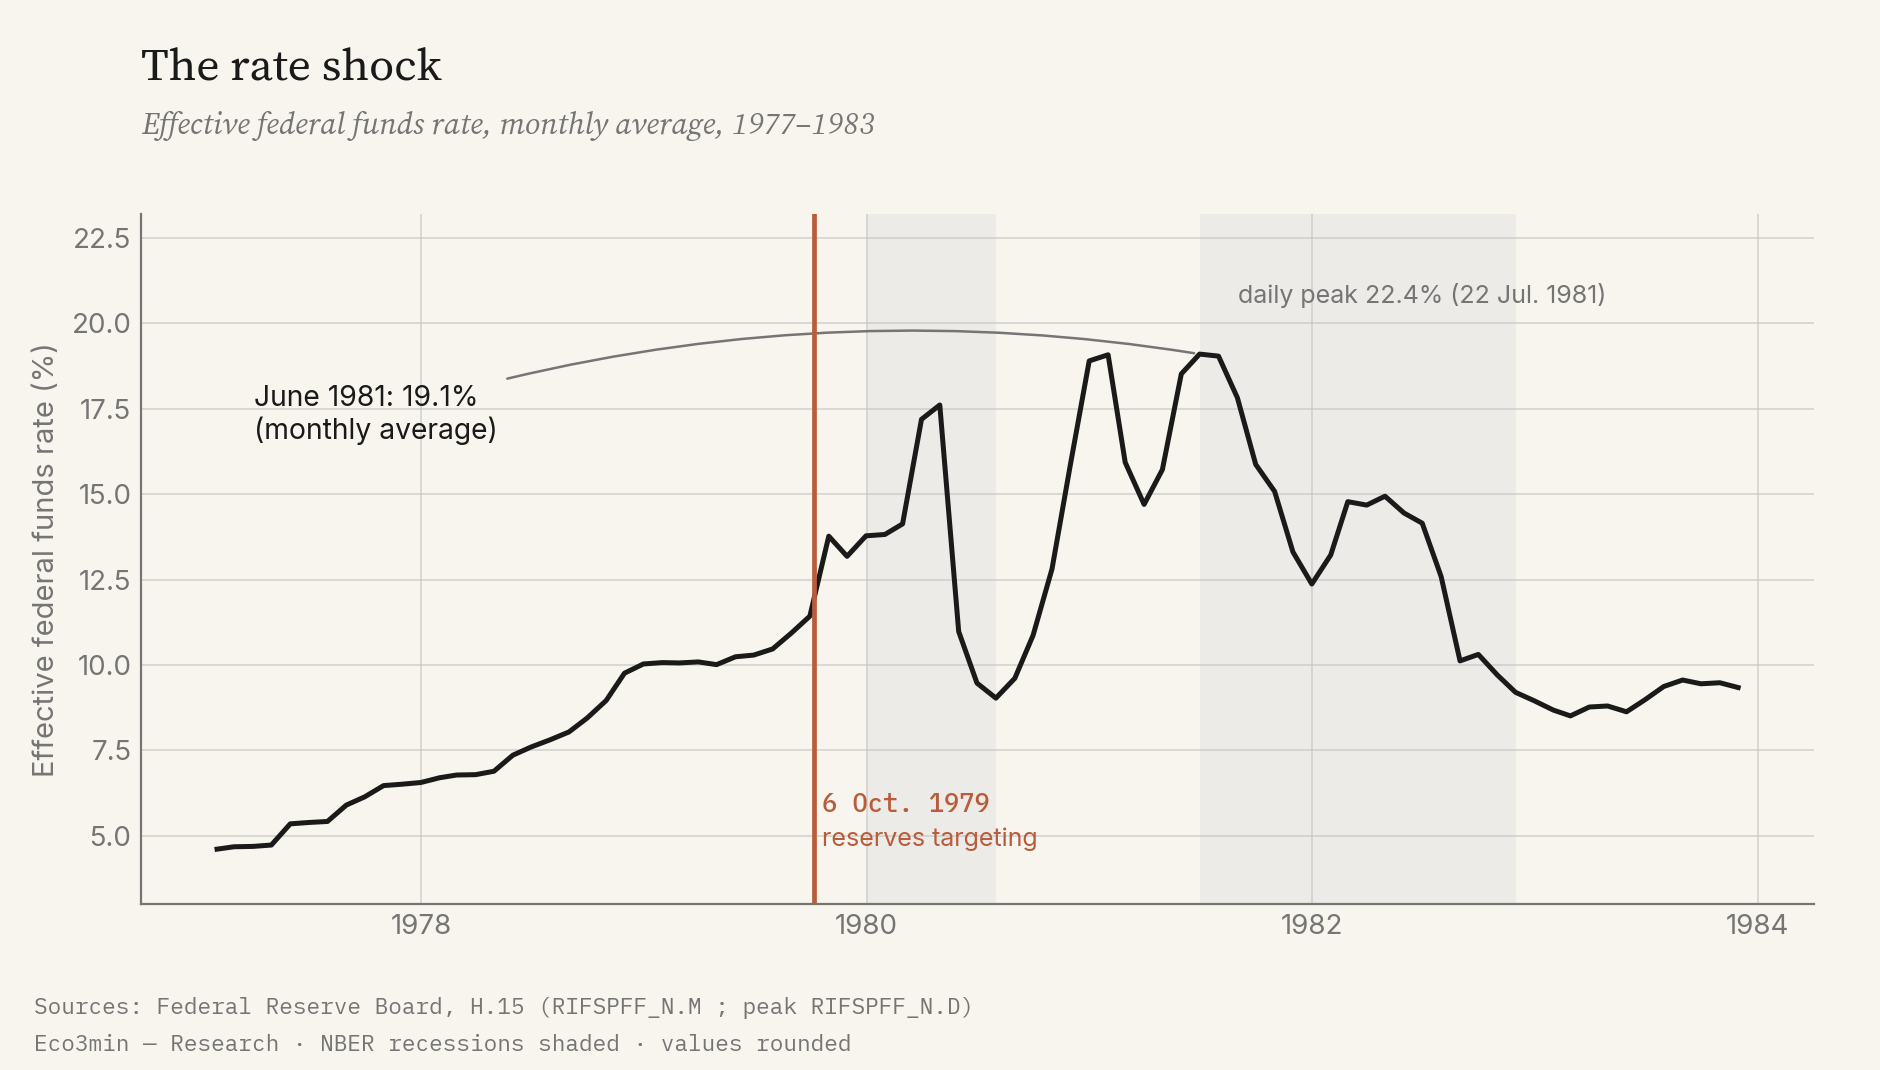
From 13.8% in October 1979, the effective rate rose to 19.1% on a monthly-average basis in June 1981, touching 22.4% on some days (Federal Reserve, H.15). The mechanism at work is the classic channel of monetary transmission: a high policy rate raises the cost of credit, compresses demand for housing, durable goods and investment, and then, with a lag, price increases. The singularity of 1979 is not the channel, it is the scale of the tightening and the explicit acceptance of its recessionary effects.
The sequence, 1979–1982
A first recession, a pause, then a harder second tightening: disinflation is won in two stages.
The first effect was rapid. In the spring of 1980, the economy entered recession (NBER, January to July 1980), amplified by a temporary credit-control programme. Faced with the contraction, the policy rate fell back sharply in the summer of 1980, to around 9%: the previous chart shows that trough. This is the most delicate phase of the episode, the one where policy seemed to hesitate.
The late-1980 recovery immediately revived inflation, and the Fed re-tightened without restraint. The policy rate climbed back toward 19%, triggering a second, deeper recession from July 1981 to November 1982 (NBER). This is the one that did most of the disinflationary work: demand gave way, the labour market loosened, and unemployment reached 10.8% in November 1982 (Bureau of Labor Statistics). Maintaining rates this high, despite sustained political opposition and a visible social cost, is the trait that sets this episode apart from earlier, aborted tightenings.
The lags explain the cost. Between a change in the policy rate and its full effect on prices, the delay is typically twelve to eighteen months. Because expectations were anchored, rates had to be held very high for long enough to turn them around, which measures the real price of disinflation: the depth and duration of the second recession.
Markets and assets
The bond market took the rate shock first, then began to ease once credibility set in.
The asset paths described below are presented for the purpose of historical analysis. They report what was observed between 1979 and 1985, and do not constitute advice, a recommendation, or a projection onto current or future situations.
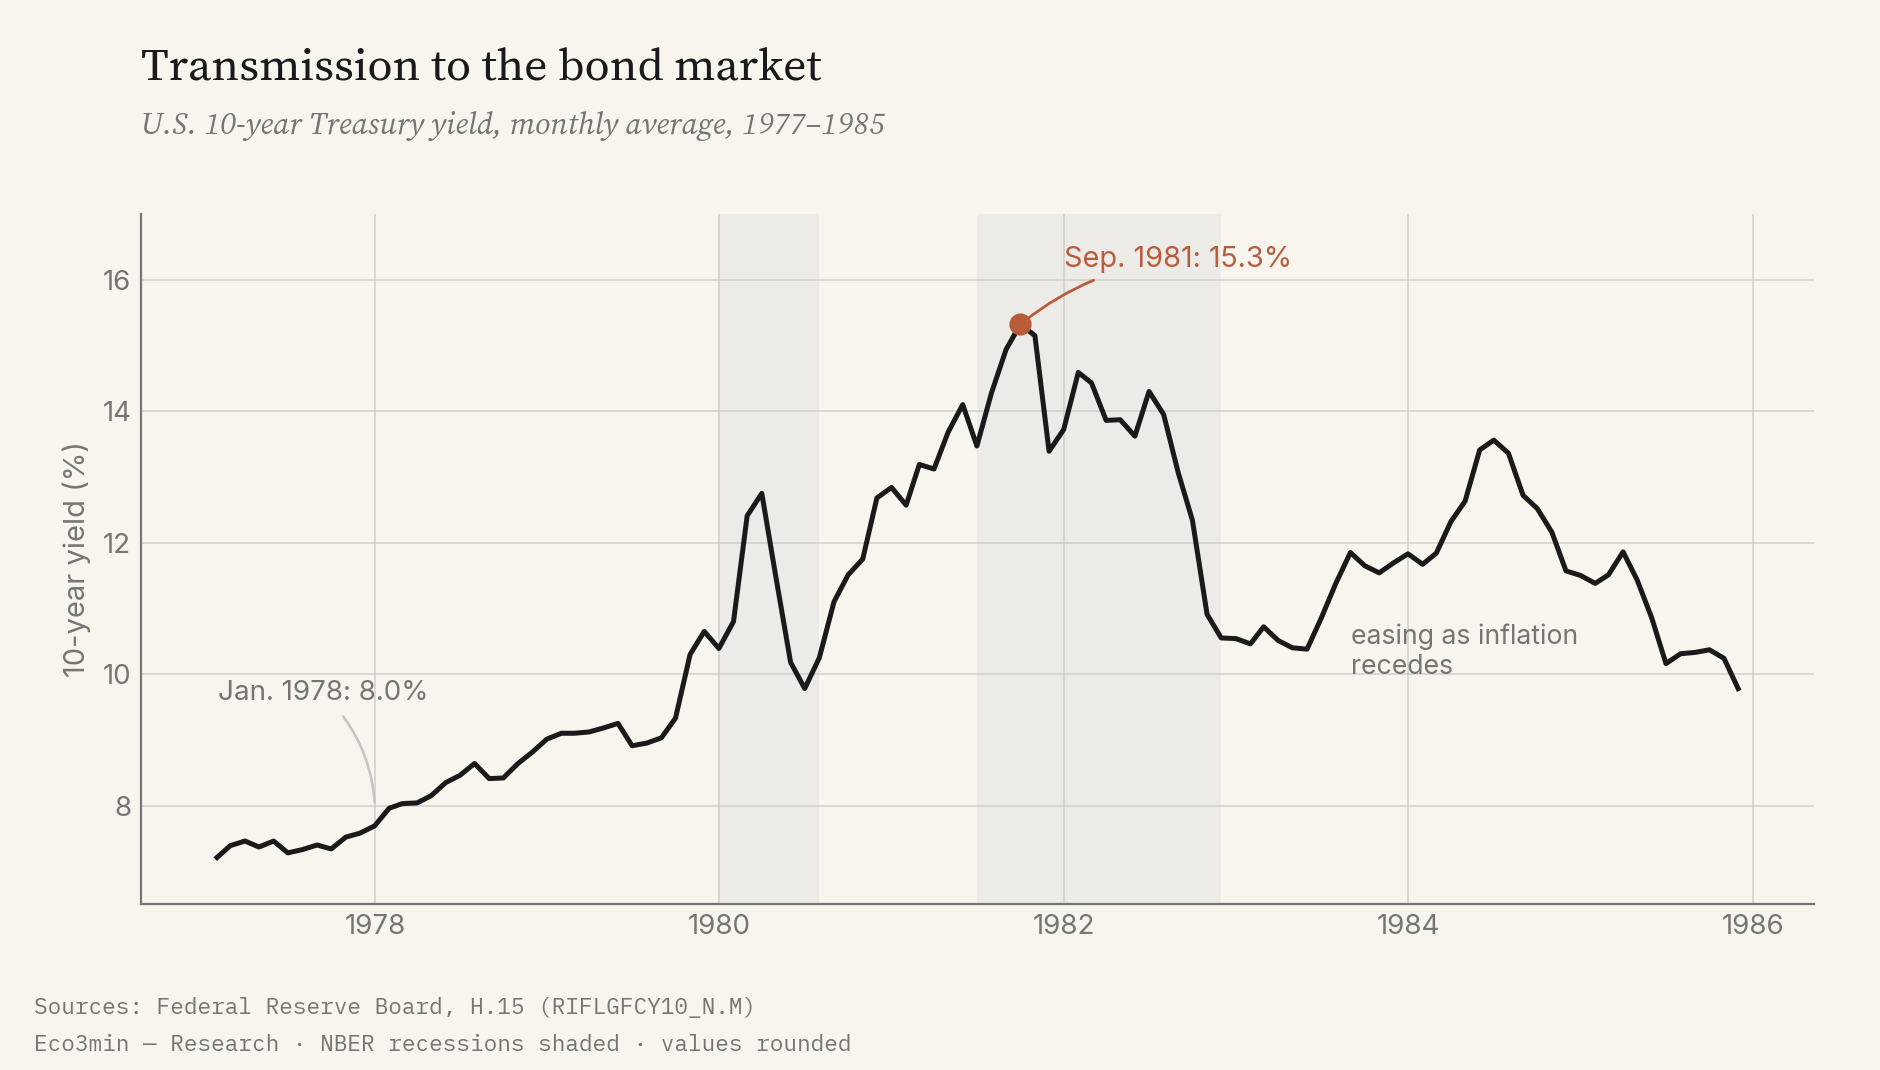
The 10-year Treasury yield rose from 8.0% in January 1978 to a monthly peak of 15.3% in September 1981, with a daily peak of 15.84% on 30 September (Federal Reserve, H.15). For a holder, such a rise in yield means a fall in the price of long-dated bonds already in the portfolio: the tightening hits the bond market first and hardest.
The turn came next. As inflation receded and the Fed’s resolve became credible, yields began a durable decline, visible from 1982. On the equity side, the broad U.S. index reached its low in August 1982 (S&P Composite, Robert J. Shiller data), before the recovery that accompanied the exit from recession. The episode’s key figures come down to four markers.
One less-discussed signal accompanied the shock: the swing in real rates. Long negative before 1979, when inflation exceeded the policy rate, real short rates turned strongly positive once inflation receded. This real-yield differential weighed on domestic credit and supported the dollar, which strengthened markedly in the early 1980s by attracting foreign capital.
Volcker and 2008: two disinflations, two roles
Same regime destination, opposite mechanism: the most illuminating contrast the hub has to offer.
In the Eco3min grid, the Volcker shock and the 2008 financial crisis share a single destination, the disinflationary meta-regime: in both cases, price dynamics weaken. But the central bank’s role is diametrically opposed, which the opposition below sums up.
Disinflation endured
The collapse in credit drives demand down; disinflation is a side effect of the contraction. The Fed fights the slowdown, cuts rates urgently and acts as lender of last resort.
Disinflation engineered
The Fed deliberately aims at the slowdown to break expectations. It raises rates to 19% and accepts the recession as the price to pay. Disinflation is the objective, not the consequence.
Three structural differences follow from this reversal of roles. The origin of the shock, first: financial and endogenous in 2008, decided by monetary policy in 1979. The direction of the price regime, next: the 2008 disinflation accompanies a collapse in demand, Volcker’s is the explicit objective. The cost, finally: in 2008, the contraction did the disinflationary work almost mechanically; in 1979-1982, because expectations were anchored, it took two recessions and unemployment at 10.8% to turn them around.
Where the episode leads
The episode closes the Great Inflation and opens four decades of disinflation. The reading status, however, needs to be specified.
Reading status: ◐ computable, but out of backtest. The three inputs of the Eco3min classification engine exist for this period — growth via the CFNAI (from 1967), underlying inflation via the Dallas Fed’s Trimmed Mean PCE (from 1977), financial conditions via the Chicago Fed’s NFCI (from 1971). But the engine’s documented validation window stops at 2003-2026. One therefore cannot write that the classifier “outputs” a given regime over 1979-1982: no backtest pass covers those years.
One point about measurement clarifies this. The engine’s inflation axis tracks underlying inflation: the Trimmed Mean PCE strips out the most volatile components, including energy. The second oil shock of 1979 inflated headline inflation, but underlying inflation too was lodged at a high level. The disinflation obtained after 1981 is therefore not a mere ebb in the price of energy, it is a turn in the price regime itself.
What the series allow one to say, more cautiously: the episode leaves the inflationary column for the disinflationary one as inflation tips toward a decreasing state (I−), the CPI moving from 14.8% in 1980 to less than 3% in 1983. This is a reading through period series, not an engine verdict. That destination is the disinflationary meta-regime of the Eco3min grid, which gathers the Expansionary disinflation, Disinflationary contraction and Slowdown states.
Set back into the full cycle, the Volcker shock is the mirror of the 1973 oil shock: 1973 carried the economy into stagflation, Volcker carried it out. Together, the two markers bracket the Great Inflation of the 1970s — its opening and its closing. The disinflation obtained in 1982 opens the long phase of falling prices and rates that would mark the following decades.
This disinflationary backdrop, spread over nearly four decades, is the setting in which the classification engine operates over its documented window of 2003-2026: an environment where inflation, contained, takes the lead role only in episodes. The Volcker shock marks its origin, upstream of that window.
In the Volcker shock, the recession is not the accidental price of disinflation: it is its deliberate instrument.
Sources and references
Quantitative data: federal funds rate, 10-year yield and bank prime rate from the Federal Reserve’s H.15 release (Federal Reserve Board, Selected Interest Rates); consumer price index and unemployment rate from the U.S. Bureau of Labor Statistics; equity dynamics from the S&P Composite index (Robert J. Shiller data). Recession dating: National Bureau of Economic Research (NBER). The regime framework (growth, underlying-inflation and financial-conditions axes; inflationary and disinflationary columns) follows Eco3min’s classification methodology, whose documented backtest window covers 2003-2026.
Last updated — 31 May 2026
Disclaimer – Financial Information: The analyses, commentary, and content published on eco3min.fr are provided for informational and educational purposes only. They do not constitute investment advice or a solicitation to buy or sell financial instruments. Past performance is not indicative of future results. All investment decisions involve risk and are the sole responsibility of the reader.