
Next US CPI release: date, time (ET), latest print and the base effect (with PCE)
The US CPI comes out once a month at 8:30 AM Eastern Time, from the Bureau of Labor Statistics. The number that moves markets is a 12-month change: it settles twelve months at once, not just the month being published.
This page keeps the date and time of the next release, the latest BLS print, the full schedule, the PCE, and what the month dropping out of the window implies for the next 12-month rate.
The Bureau of Labor Statistics releases the CPI twelve times a year at 8:30 AM ET, between the 10th and the 15th of the month, for the previous month.
- The countdown below gives the next release date and the month covered; the latest print follows every BLS release through the BLS API, so nothing on this page is typed by hand.
- Each release carries two headline numbers that do not measure the same thing: the seasonally adjusted monthly change and the unadjusted 12-month change; in August 2026, +0.4% on the month and 3.4% over the year (BLS, September 11, 2026).
- The next 12-month rate depends as much on the month dropping out of the window as on the new print: the calculator on this page runs that base effect for whatever monthly change you assume.
US inflation — CPI
Next US CPI release
Wednesday, October 14, 2026
Release Wednesday, October 14 at 8:30 AM ET
September 2026
Source: U.S. Bureau of Labor Statistics, bls.gov — official 2026 schedule accessed July 4, 2026. Released at 8:30 AM Eastern Time.
Latest published figure
Consumer prices, August 2026, released September 11, 2026
Source: U.S. Bureau of Labor Statistics, series CUUR0000SA0, CUSR0000SA0, CUUR0000SA0L1E and CUSR0000SA0L1E, read from the BLS API on September 21, 2026 at 21:54 Paris time. 12-month change on the unadjusted index, monthly change on the seasonally adjusted index, as in the release.
When the CPI comes out, and which two numbers it carries
The Bureau of Labor Statistics publishes the Consumer Price Index at 8:30 AM Eastern Time sharp, on a weekday between the 10th and the 15th of the month following the reference month. Eastern Time is the native clock of the release; the countdown above keeps it, and the weeks when the US and European clock changes fall out of step only matter to readers converting from London or Paris. The period each US statistic actually covers never coincides with its release date: the CPI of a given month arrives two weeks into the next.
The release leads with two numbers, and they do not measure the same thing. The monthly change is seasonally adjusted: it is the figure the BLS quotes first. The 12-month change is computed on the unadjusted index. For August 2026, the BLS reported +0.4% on the month and 3.4% over twelve months for all items, +0.3% and 2.4% for all items less food and energy, the core index. That pair is what the panel above reproduces.
The 12-month rate does not measure the month: it settles twelve months at once.
The 2026 CPI release schedule
The BLS sets its dates a year ahead and moves them only for exceptional events; the October-November 2025 federal shutdown was one, and the October 2025 index was never published. The 2027 schedule had not appeared as of September 18, 2026. The table draws on the single source that also feeds the US macro calendar of Fed, CPI, jobs and GDP dates: the next row is highlighted, past rows greyed out.
US inflation — CPI
CPI releases (BLS)
| Release | Time (ET) | Data covered |
|---|---|---|
| Tuesday, January 13, 2026 | 8:30 AM ET | December 2025 |
| Friday, February 13, 2026 | 8:30 AM ET | January 2026 |
| Wednesday, March 11, 2026 | 8:30 AM ET | February 2026 |
| Friday, April 10, 2026 | 8:30 AM ET | March 2026 |
| Tuesday, May 12, 2026 | 8:30 AM ET | April 2026 |
| Wednesday, June 10, 2026 | 8:30 AM ET | May 2026 |
| Tuesday, July 14, 2026 | 8:30 AM ET | June 2026 |
| Wednesday, August 12, 2026 | 8:30 AM ET | July 2026 |
| Friday, September 11, 2026 | 8:30 AM ET | August 2026 |
| Wednesday, October 14, 2026 | 8:30 AM ET | September 2026 |
| Tuesday, November 10, 2026 | 8:30 AM ET | October 2026 |
| Thursday, December 10, 2026 | 8:30 AM ET | November 2026 |
Source: U.S. Bureau of Labor Statistics, bls.gov — official 2026 schedule accessed July 4, 2026. Released at 8:30 AM Eastern Time.
What the next print is worth: the base effect
A 12-month change is, to a close approximation, the sum of twelve monthly changes. When the BLS publishes a new month, the same month of the previous year drops out of the window. If the incoming month is weaker than the outgoing one, the 12-month rate falls even on a positive monthly print; if it is stronger, the rate rises. This mechanism, the base effect, accounts for much of the movement in the annual rate that commentary attributes to the latest number alone.
The calculator below takes the monthly change you assume for the next release, applies it to the seasonally adjusted index of the latest published month, and derives the 12-month change that would follow, for the headline index and for core. It also shows the twelve monthly changes of the current window, with the one that drops out at the next release. The computation runs on seasonally adjusted series: the official 12-month rate, computed on the unadjusted index, can differ by a tenth of a point.
Over the twelve-month window ending in August 2026, the BLS published only 10 monthly changes for the headline index, with no October 2025 index; they average +0.31% a month, against +0.22% for core. March 2026, at +0.9% on gasoline, leaves the window with the April 2027 release: it is the heaviest month in this series.
Reading a rising 12-month rate as proof that inflation is accelerating this month. The annual figure rises whenever the published month exceeds the month leaving the window, whatever the recent momentum; conversely it can fall on a high monthly print if the outgoing month was higher still. Current momentum is read in the seasonally adjusted monthly change and its three-month average, not in the 12-month rate.
How to read the print: headline, core, and what the Fed watches
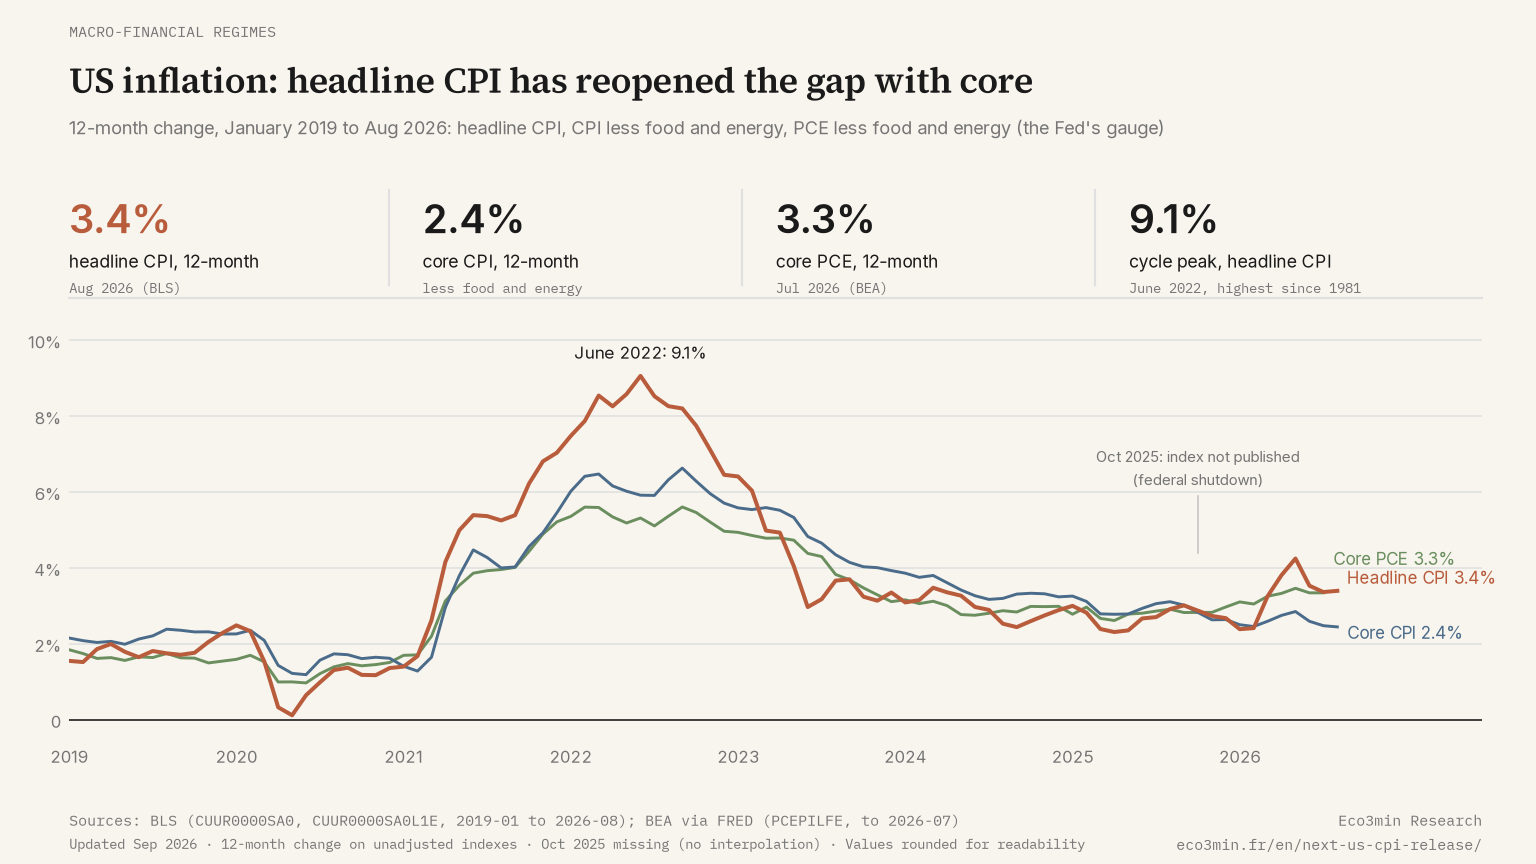
The headline index includes food and energy; the core index excludes them, because their prices respond to supply shocks that monetary policy does not steer. The gap between the two says where current inflation comes from. In August 2026, headline ran at 3.4% over the year and core at 2.4%: a one-point gap, in a release where energy rose 16.3% over twelve months. The three episodes of sustained divergence between core and headline CPI since 1957 show that this gap almost always closes through headline, rarely through core.
The cycle peak remains June 2022: 9.1% over the year for the headline index, the highest since 1981. The return towards 3% took two years, and 2026 reopened the headline-core gap through gasoline, up 21.2% in March 2026 alone according to the BLS. Which of the two measures to follow has no single answer: core for the trend, headline for household purchasing power, whose basket does contain gasoline. The complete CPI history since 1913 places both in a longer perspective.
The Fed does not state its objective on the CPI. The 2% target the Fed has set itself refers to the PCE price index, and its quarterly projections distinguish headline PCE from core PCE. The CPI remains the first number available, three to four weeks ahead: that is why it moves markets, and why the PCE, when it comes, rarely surprises. A less discussed signal separates the two indexes: the weight of shelter, about a third of the CPI against less than a fifth of the PCE, which makes the CPI slower to reflect a turn in rents in either direction.
The mechanisms are laid out in the complete guide to inflation mechanisms, measurement and effects, and the method of the index itself, basket, weights and limits, in how the BLS actually calculates the CPI.
The PCE: the Fed’s gauge, published later
The Bureau of Economic Analysis publishes the PCE price index in the Personal Income and Outlays report, also at 8:30 AM ET. Since autumn 2026 that report is no longer tied to the GDP release: the BEA set the August report for October 6, 2026, September for November 4, 2026 and October for December 2, 2026, with the November report still to be announced as of September 18, 2026. The countdown follows those dates.
US PCE inflation
Next PCE inflation release
Tuesday, October 6, 2026
Release Tuesday, October 6 at 8:30 AM ET
August 2026
Source: U.S. Bureau of Economic Analysis, bea.gov — official schedule accessed September 18, 2026. Released at 8:30 AM Eastern Time. The PCE price index is the Fed's preferred inflation gauge.
Latest published figure
PCE price index, July 2026, released August 26, 2026
Source: U.S. Bureau of Economic Analysis, series PCEPI and PCEPILFE via FRED, updated daily by the Eco3min data pipeline. The PCE for a given month is released three to four weeks after the CPI for the same month.
Over the long run the PCE rises more slowly than the CPI: sixty-five years of comparison between the two measures give an average gap of a few tenths of a point a year in favour of the CPI, by construction of the weights. The reasons PCE inflation differs from CPI inflation come down to three choices of method: the index formula, the scope of spending, and the treatment of health care paid by insurers and government. The underlying series are downloadable as the monthly PCE price index dataset since 1959.
US PCE inflation
Personal Income & Outlays releases (BEA)
| Release | Time (ET) | Data covered |
|---|---|---|
| Thursday, April 9, 2026 | 8:30 AM ET | February 2026 |
| Thursday, April 30, 2026 | 8:30 AM ET | March 2026 |
| Thursday, May 28, 2026 | 8:30 AM ET | April 2026 |
| Thursday, June 25, 2026 | 8:30 AM ET | May 2026 |
| Thursday, July 30, 2026 | 8:30 AM ET | June 2026 |
| Wednesday, August 26, 2026 | 8:30 AM ET | July 2026 |
| Tuesday, October 6, 2026 | 8:30 AM ET | August 2026 |
| Wednesday, November 4, 2026 | 8:30 AM ET | September 2026 |
| Wednesday, December 2, 2026 | 8:30 AM ET | October 2026 |
Early 2026 partially omitted: the BEA release schedule was disrupted by the October–November 2025 federal government shutdown; only verified dates are listed. From autumn 2026 the Personal Income & Outlays report is decoupled from the GDP release; the date of the November 2026 report has not yet been announced by the BEA.
Source: U.S. Bureau of Economic Analysis, bea.gov — official schedule accessed September 18, 2026. Released at 8:30 AM Eastern Time. The PCE price index is the Fed's preferred inflation gauge.
Frequently asked questions
What time is the US CPI released?
At 8:30 AM Eastern Time, on a weekday between the 10th and the 15th of the month, for the previous month. That is 1:30 PM in London and 2:30 PM in Paris most of the year, one hour earlier during the two to three weeks when the United States has already changed its clocks and Europe has not. The countdown on this page converts each date to Eastern Time.
Which month does each CPI release cover?
The previous one: the BLS publishes a month’s index between the 10th and the 15th of the following month. The release of October 14, 2026 therefore covers September 2026 prices. The exact date of each release comes from the annual BLS schedule, reproduced as is in the table on this page. What that schedule cannot anticipate is a lapse in appropriations: the 42-day federal shutdown of October to November 2025 left October 2025 without a CPI, one of 23 such gaps since 1976.
Why will there be no 12-month change for October 2026?
Because the BLS never published an index for October 2025: the October-November 2025 federal shutdown prevented price collection. The October 2026 12-month change has no official base, and the November 2026 one cannot be decomposed into twelve monthly changes. The calculator flags both months as unavailable rather than interpolating.
What is the difference between the CPI and the PCE price index?
The CPI is computed by the BLS from a fixed basket of urban household purchases; the PCE price index is computed by the BEA from the consumption expenditures of the national accounts, with weights that follow household substitution and a smaller housing share. The Fed states its 2% objective on the PCE, which comes out three to four weeks after the CPI for the same month.
Where is the 2027 CPI release schedule?
The BLS had not published its 2027 schedule as of September 18, 2026. As soon as it appears on bls.gov, the dates are added to the single source that feeds this page and the macro calendar; until then, the table ends with the December 10, 2026 release.
Last updated — 19 September 2026
Disclaimer – Financial Information: The analyses, commentary, and content published on eco3min.fr are provided for informational and educational purposes only. They do not constitute investment advice or a solicitation to buy or sell financial instruments. Past performance is not indicative of future results. All investment decisions involve risk and are the sole responsibility of the reader.