
US Economic Data Releases: What Period Does Each Number Cover?
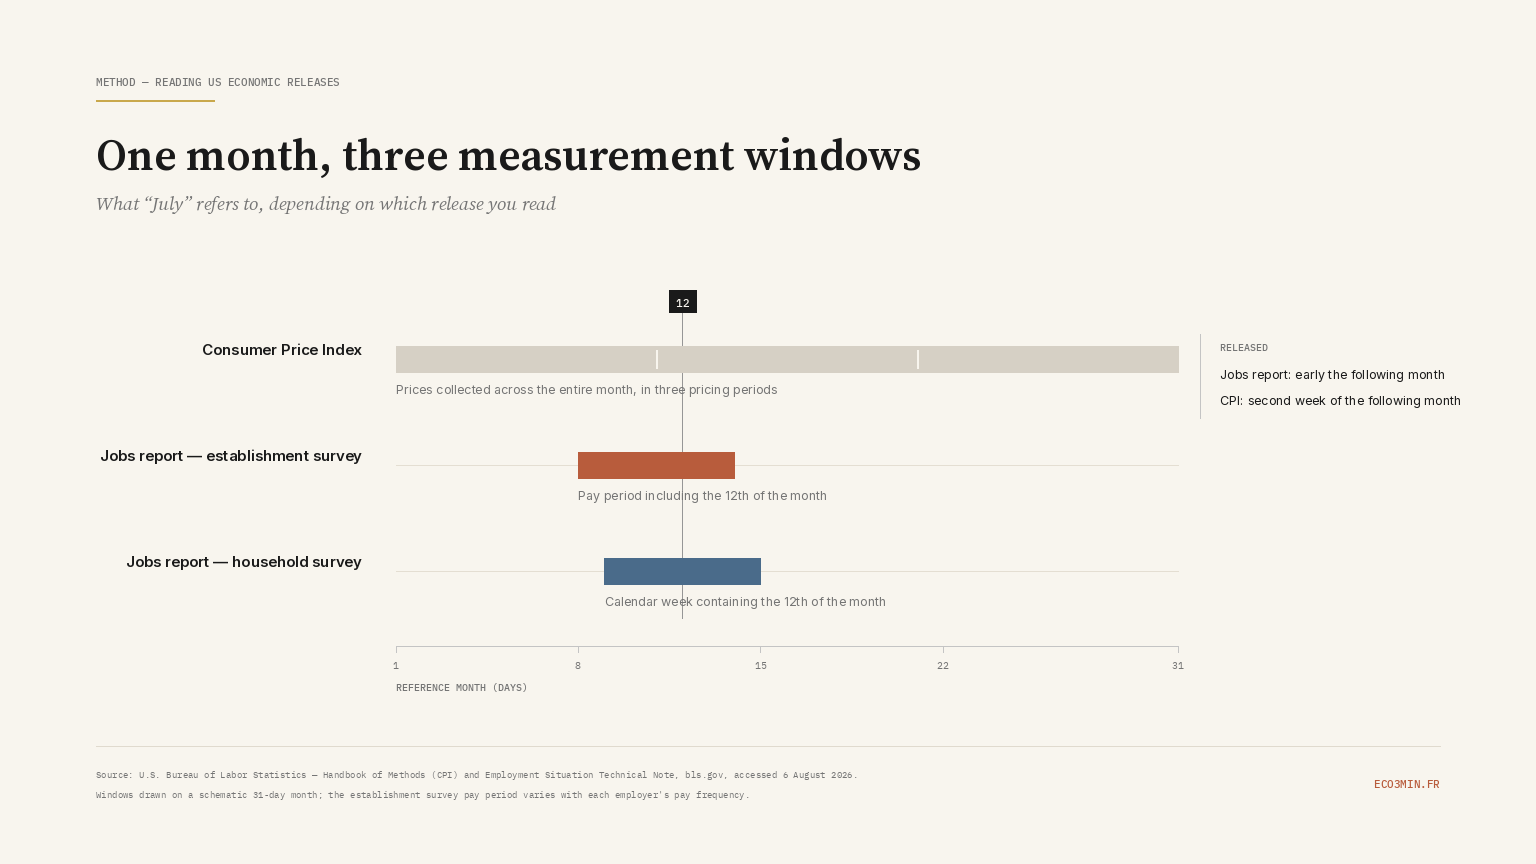
A US economic release never measures the moment it is published: it covers an earlier period, and that period is not the same from one series to the next. The CPI collects prices across the entire reference month; the jobs report only observes the week and the pay period containing the 12th of that month. Two numbers both labelled “July” therefore cover different windows, and neither is final when it first appears. This page gives the next date for each major series, then the mechanism: what each number covers, why it arrives when it does, and how long it stays provisional.
US inflation — CPI
Next US CPI release
Tuesday, November 10, 2026
Release Tuesday, November 10 at 8:30 AM ET
October 2026
Source: U.S. Bureau of Labor Statistics, bls.gov — official 2026 schedule accessed July 4, 2026. Released at 8:30 AM Eastern Time.
US jobs — NFP
Next US employment report
Friday, November 6, 2026
Release Friday, November 6 at 8:30 AM ET
October 2026
Source: U.S. Bureau of Labor Statistics, bls.gov — official 2026 schedule accessed July 4, 2026. Released at 8:30 AM Eastern Time.
US PCE inflation
Next PCE inflation release
Wednesday, November 4, 2026
Release Wednesday, November 4 at 8:30 AM ET
September 2026
Source: U.S. Bureau of Economic Analysis, bea.gov — official schedule accessed September 18, 2026. Released at 8:30 AM Eastern Time. The PCE price index is the Fed's preferred inflation gauge.
US GDP
Next US GDP estimate
Thursday, October 29, 2026
Release Thursday, October 29 at 8:30 AM ET
Q3 2026 — Advance estimate
Source: U.S. Bureau of Economic Analysis, bea.gov — official schedule accessed July 4, 2026. Released at 8:30 AM Eastern Time.
Why a number always covers a period that has already closed
An official statistic is the output of a chain: collection from a sample, checking, aggregation, seasonal adjustment, publication. As long as the reference month is running, collection is running too. The gap between the end of the period and its publication measures the length of that chain, not the slowness of the agency producing it.
The order in which series land through the month follows the same dependency logic. The jobs report opens the month, the price index typically follows in the second week, the PCE price index and GDP close it. That is not a convention: the Bureau of Economic Analysis assembles its accounts from data produced elsewhere and states, in the Personal Income and Outlays report, that its private wage and salary estimates rest on the Bureau of Labor Statistics Current Employment Statistics survey — the very survey behind the jobs report published weeks earlier. A derived series cannot precede its inputs.
One release escapes the pattern: the ISM PMI. The manufacturing report appears on the first business day of the month following its reference period — the second in January — and the services report on the third business day, because it rests on a private survey of purchasing managers rather than on administrative collection. It also comes out at 10:00 a.m. Eastern Time, where the major official series come out at 8:30 a.m.
The friction: “July” does not mean the same thing across series
The Bureau of Labor Statistics states in its Handbook of Methods that CPI prices are collected over the course of the entire month, spread across three pricing periods, and that CPI data correspond to a month rather than to a specific date. The July index is therefore a weighted average of prices observed between 1 and 31 July.
The jobs report follows the opposite rule. Its technical note sets two distinct reference periods: for the household survey, the calendar week containing the 12th of the month; for the establishment survey, the pay period including the 12th, which does not necessarily coincide with that week since it depends on each employer’s pay frequency. July payroll growth is, in practice, a mid-July snapshot.
The consequence is mechanical. A price move on the 25th of the month can enter that month’s CPI, through the last pricing period, and stays outside the scope of the matching jobs report. Setting the two numbers side by side means comparing a monthly average with a mid-month reading — a workable exercise, provided the different windows are known. GDP and the PCE price index, by contrast, do cover their full period: the quarter for one, the month for the other.
The same month, published several times
A number’s first appearance is rarely its last. In the establishment survey, estimates for the two most recent months rest on incomplete returns and are explicitly labelled preliminary; the Bureau of Labor Statistics states that an estimate is considered final only after two successive revisions. Every monthly release therefore revises the two prior months. On the French side, the same revision logic runs on a different tempo, that of the INSEE calendar and its revisable indices.
On top of that comes an annual benchmark revision: sample-based estimates are realigned on universe counts drawn from unemployment insurance administrative records, with the measured gap taken at March. In its 2026 technical note, the BLS puts the average absolute benchmark revision for total nonfarm employment at 0.2 percent over the prior ten years.
Revision noise sits alongside sampling noise. The same BLS technical note places the 90 percent confidence interval on the monthly change in nonfarm payrolls at around 122,000 jobs either side of the published estimate, and works the point through itself: on a reported gain of 50,000 jobs, the interval runs from minus 72,000 to plus 172,000 and therefore contains zero. On the price side, seasonally adjusted CPI series stay open to revision for up to five years, with seasonal factors recalculated each year over the last five years of data. On the national accounts side, each quarter of GDP goes through three successive estimates roughly a month apart. That chain only runs while the BEA is funded, and the 23 federal funding gaps since 1976, with their length and scope date each lapse in appropriations that pushed it back, October 2025 included.
What the measurement window changes when reading the data
Three reading habits follow from the above, none of them a decision rule. First, the period covered matters as much as the release date: it determines which real-world event could have entered the number at all. Second, two monthly series carrying the same label may have observed different fragments of the same month. Third, comparing a fresh number with a historical series sets a preliminary estimate against already-revised values — something the releases flag and the coverage often drops.
The exact dates and times for each series are gathered on the macro calendar, while how a policy decision unfolds is set out on the FOMC meeting calendar. The series themselves, once published and revised, sit in the macro-financial datasets, and their reading within monetary and macro regimes on the macro-financial regimes page.
Frequently asked questions
Which month does the CPI released in August cover?
July. The rule is stable: each monthly Bureau of Labor Statistics price release covers the previous calendar month and, in practice, lands in the second week of the month. The gap is not administrative slack but collection and processing time — prices for the reference month keep being collected right across that month.
Why doesn’t the jobs report cover the whole month?
Because both surveys behind it are anchored on the 12th: the calendar week containing the 12th for the household survey, the pay period including the 12th for the establishment survey. That fixed anchor gives both series the same reference point from one month to the next, at the cost of covering the full month.
How long does a number stay provisional?
It depends on the series. In the establishment survey, the two most recent monthly estimates are preliminary and become final only after two successive revisions. Quarterly GDP goes through three estimates roughly a month apart. Seasonally adjusted CPI series remain open to revision for up to five years after first publication.
Why does the PCE price index come out after the CPI for the same month?
Because it is built downstream. The Bureau of Economic Analysis assembles the Personal Income and Outlays report from data produced by other agencies — for private wages and salaries, the BLS Current Employment Statistics survey, the same one behind the jobs report published earlier in the month. A derived statistic waits on its inputs.
Does a release on the first of the month cover the month that just ended?
The ISM Manufacturing PMI works that way: it is published on the first business day of the month following its reference period — the second business day in January — with the ISM Services PMI on the third business day. It is also the release that breaks the usual clock: 10:00 a.m. Eastern Time, when the major BLS and BEA series come out at 8:30 a.m.
Are July employment and July inflation directly comparable?
They carry the same monthly label without covering the same window: one is a mid-month snapshot, the other a full-month average. The gap is a construction property of the two series, not a cyclical signal. A price shock on the 25th can enter that month’s CPI, through the last pricing period, and stays outside the scope of the matching jobs report.
Last updated — 6 October 2026
Disclaimer – Financial and Legal Information: The analyses, commentary, and content published on eco3min.fr are provided for informational and educational purposes only. They do not constitute investment advice or a solicitation to buy or sell financial instruments. Past performance is not indicative of future results. All investment decisions involve risk and are the sole responsibility of the reader. Data, charts and calculated series are provided as is and may contain errors or lag behind their source: check any figure against the primary source cited before relying on it. Content describing laws, regulations or contracts reflects the law as of its publication date and does not constitute legal or tax advice; applying it to a specific situation requires a qualified legal or tax professional.