
US refinery closures since 2020: the complete record
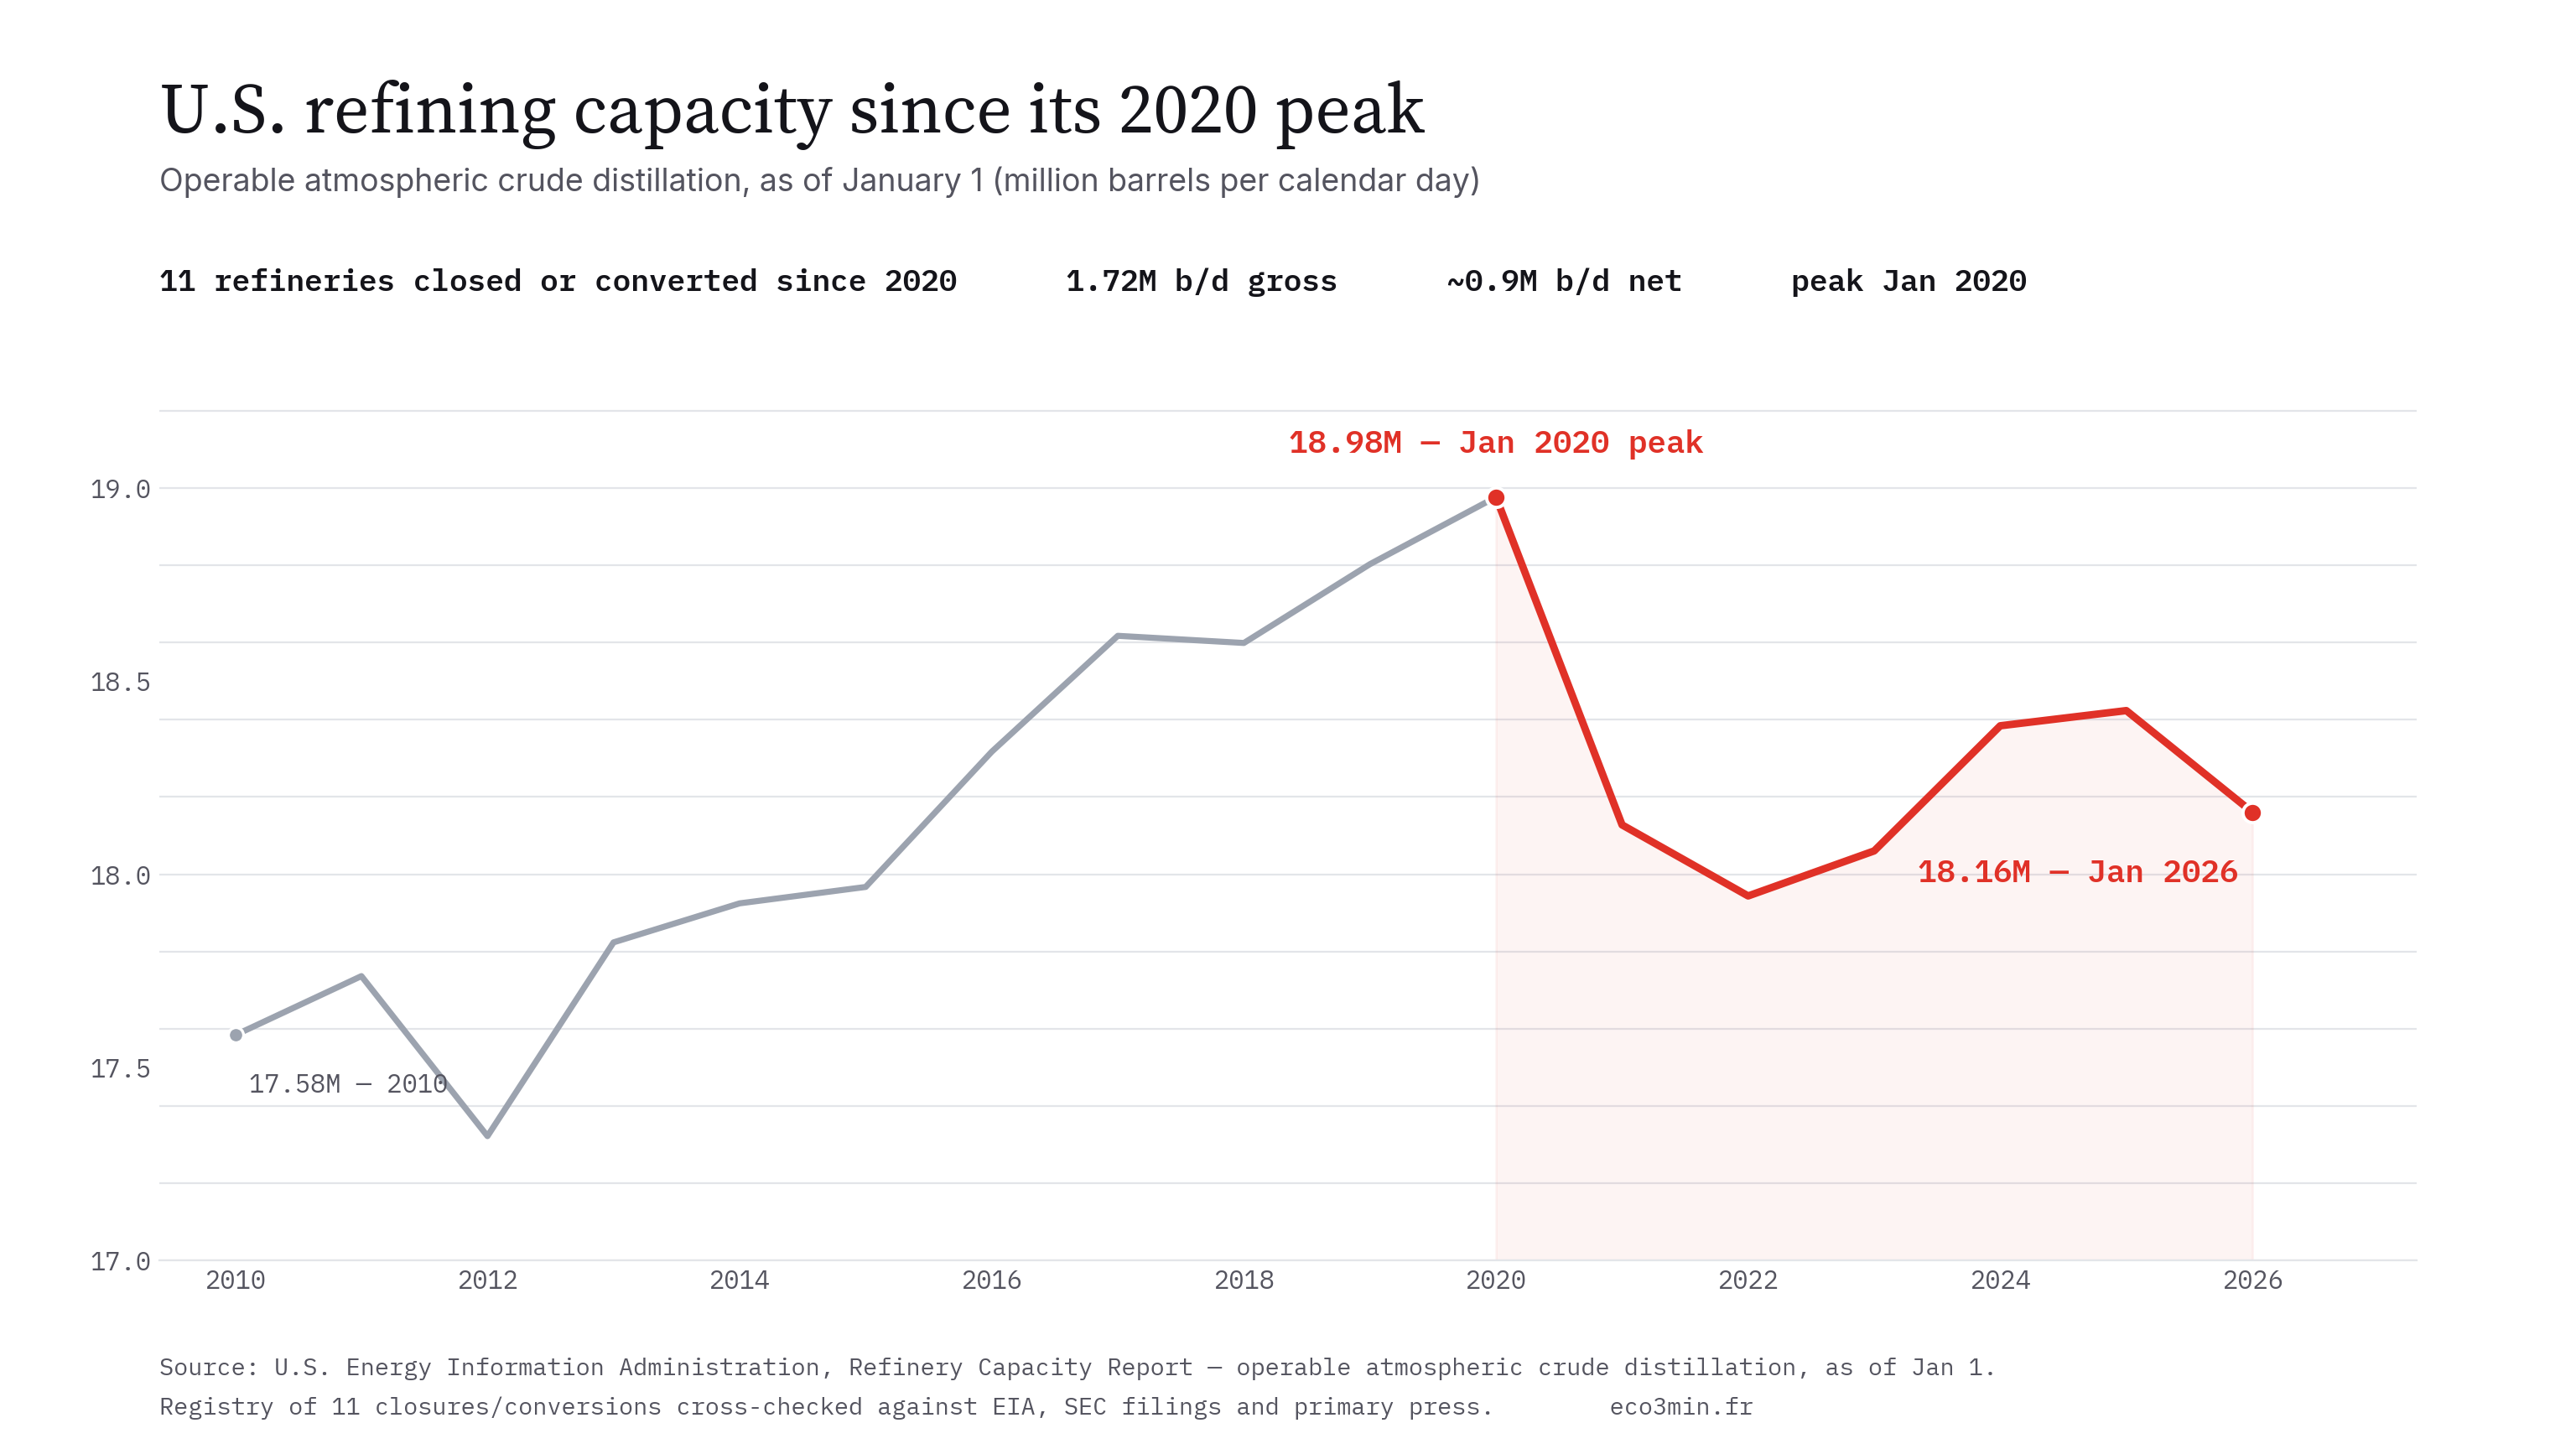
Since its 2020 peak, 11 U.S. refineries stopped refining crude — about 1.72 million b/d gross, roughly 0.9 million net after offsetting expansions.
U.S. operable atmospheric distillation capacity peaked at 18.98 million b/cd on January 1, 2020. Eleven refineries have since closed outright or converted away from crude — six hard closures (1,120,622 b/d) and five conversions to renewable fuels or terminals (603,000 b/d). Yet net capacity fell only about 4–5%, because expansions and de-bottlenecking added roughly 0.76 million b/d back over the same period.
The dominant narrative around U.S. gasoline prices holds that the country has been steadily “losing refineries.” That is true as a count — and this page compiles every one of them, with capacity, date and primary source. But the capacity arithmetic is more specific than the headline: the gross figure removed by closures is roughly double the net decline, because the two facts are usually reported separately. This record puts both in one place.
The record: every U.S. refinery closed or converted since 2020
Each row is a refinery removed from U.S. operable crude capacity since the January 2020 peak, with its published capacity, the year the change took effect, and whether it was a hard closure or a conversion (to renewable fuels or a terminal). Bars are scaled to the largest entry.
| Refinery | State | Capacity (b/d) | Effective | Fate |
|---|---|---|---|---|
| Philadelphia (PES)Philadelphia Energy Solutions | PA | 335,000 | 2019 | Closure |
| ConventShell | LA | 211,146 | 2020 | Closure |
| MartinezMarathon (ex-Tesoro) | CA | 161,000 | 2020 | Conversion |
| CheyenneHollyFrontier | WY | 48,000 | 2020 | Conversion |
| GallupMarathon (Western Refining) | NM | 27,000 | 2020 | Closure |
| Dickinson (Dakota Prairie)Marathon | ND | 19,000 | 2020 | Conversion |
| Alliance (Belle Chasse)Phillips 66 | LA | 255,000 | 2021 | Conversion |
| San Francisco (Rodeo + Santa Maria)Phillips 66 | CA | 120,000 | 2024 | Conversion |
| HoustonLyondellBasell | TX | 263,776 | 2025 | Closure |
| Los Angeles (Wilmington/Carson)Phillips 66 | CA | 138,700 | 2025 | Closure |
| BeniciaValero | CA | 145,000 | 2026 | Closure |
Why the net loss is smaller than the closures suggest
A page that showed only the closures would be incomplete. Capacity did not only leave — it was also added. The single largest addition was ExxonMobil’s Beaumont, Texas expansion, which brought roughly 240,000 b/d online in 2023; incremental de-bottlenecking at surviving refineries added the rest. Netting the two sides against the EIA’s annual capacity series gives the honest figure. Reading supply in barrels of capacity rather than in price is the discipline shared across physical commodity markets, from oil and gas to critical minerals.
| As of Jan 1 | Operable capacity (b/cd) | Δ y/y | vs 2020 peak | |
|---|---|---|---|---|
| 2019 | 18,802,435 | — | -0.9% | |
| 2020 | 18,976,085 | +173,650 | +0.0% | peak |
| 2021 | 18,127,700 | -848,385 | -4.5% | |
| 2022 | 17,943,810 | -183,890 | -5.4% | trough |
| 2023 | 18,060,369 | +116,559 | -4.8% | |
| 2024 | 18,384,228 | +323,859 | -3.1% | |
| 2025 | 18,423,493 | +39,265 | -2.9% | |
| 2026 | 18,160,493 | -263,000 | -4.3% |
From the 18,976,085 b/cd peak, capacity stood at 18,160,493 as of January 1, 2026 — a net decline of 815,592 b/cd (−4.3%). Valero’s Benicia refinery (145,000 b/d) was still counted on January 1, 2026 but ceased refining in early 2026; on a mid-2026 run-rate the decline is closer to 960,000 b/cd (−5.1%). Set against roughly 1.58 million b/d of gross removals already reflected by January 2026, that implies about 763,000 b/d of offsetting expansions and de-bottlenecking. Gross removals are near 9% of the peak; the net decline is near 5%.
Explore the capacity series
Three waves
The COVID demand shock ended the modern peak. Philadelphia Energy Solutions (335,000 b/d) had already stopped after a June 2019 fire but was still carried as idle in the January 2020 report; the EIA removed it in 2021. Shell’s Convent, Louisiana (211,146 b/d) and Marathon’s Gallup, New Mexico (27,000 b/d) closed outright in 2020, and Phillips 66’s Alliance in Belle Chasse, Louisiana (255,000 b/d) shut after Hurricane Ida in late 2021 and was converted to a terminal.
Several sites left crude for renewable diesel rather than closing entirely: Marathon’s Martinez, California (161,000 b/d) and Dickinson, North Dakota (19,000 b/d), HollyFrontier’s Cheyenne, Wyoming (48,000 b/d), and Phillips 66’s San Francisco system — Rodeo plus the Santa Maria feeder (120,000 b/d combined) — whose crude units were retired in stages through early 2024.
The most recent wave is concentrated on the West Coast and Gulf. LyondellBasell shut its Houston, Texas refinery (263,776 b/d) in March 2025; Phillips 66 closed its Los Angeles refinery (138,700 b/d) in October 2025; and Valero ceased operations at Benicia, California (145,000 b/d) in early 2026. Four of the eleven sites are in California, totalling 564,700 b/d.
What the record does — and does not — show
The count is unambiguous: eleven refineries left U.S. crude processing since the 2020 peak. What it does not establish is a proportional supply shortfall. Net operable capacity fell far less than the gross closures, surviving refineries run at high utilisation and greater complexity, and the United States has remained a net exporter of refined products throughout the period. The long-run pattern the EIA has documented for decades — fewer, larger, more complex refineries — continued rather than broke. A legitimate reading of the same data is that capacity concentrated, not simply disappeared. Where closures matter most is regional: the Phillips 66 Los Angeles closure alone removed about 5% of West Coast (PADD 5) capacity, and California accounts for the largest state share of the total removed. Compare with the refined-barrel margin replayed across forty years.
These are markers a reader can track, not recommendations. If California loses further in-state capacity, historical episodes suggest the state’s isolated, specification-specific fuel market tends to show wider regional price dispersion than the national average — a statistical observation, not a forecast. Conversely, if de-bottlenecking and any new units offset removals, net national capacity can hold roughly flat even as the refinery count falls, as it did between 2022 and 2025. The next annual EIA Refinery Capacity Report (typically released mid-year, reflecting January 1 status) is the reference point that will record the Benicia closure.
Methodology & scope
What counts. A facility is included when it permanently stopped processing crude oil since the January 1, 2020 operable-capacity peak — whether by outright closure or by conversion to renewable fuels or a terminal. Temporary idling that later reversed is excluded.
Capacity basis. Figures are operable atmospheric crude distillation capacity (barrels per calendar day) from the EIA Refinery Capacity Report, except Alliance and the San Francisco (Rodeo + Santa Maria) system, which use the operator’s published net crude throughput. The difference between the two bases is small and noted per row.
The 2020 bound. The starting point is the EIA operable-capacity peak, January 1, 2020 (18,976,085 b/cd). PES is dated to its 2019 physical shutdown but was carried as idle in the January 2020 figure and removed by the EIA in the 2021 report — which is why the capacity peak is 2020 despite PES stopping in 2019.
Excluded edge cases. Limetree Bay / St. Croix, U.S. Virgin Islands (~210,000 b/d) is excluded: it had been idle since 2012, ran only briefly in early 2021, and sits outside the 50-state operable series. Calcasieu Refining (Lake Charles, LA) is excluded because it was not treated as a permanent removal in the EIA series.
Go deeper
- How refining economics turn capacity into profit: Refining margins — the hidden driver of oil profits
- Track how hard the survivors run: U.S. refinery utilization rate (dataset)
- The margin proxy behind the runs: U.S. 3-2-1 crack spread (dataset)
- The parallel story in energy inputs: European gas — no global price, a competitiveness shock
Frequently asked questions
How many U.S. refineries have closed since 2020?
Eleven refineries have left U.S. crude processing since the January 2020 operable-capacity peak: six hard closures and five conversions to renewable fuels or terminals, removing about 1.72 million b/d of gross capacity.
How much refining capacity has the U.S. actually lost?
Gross removals total about 1.72 million b/d, but expansions and de-bottlenecking added roughly 0.76 million b/d back. Net operable capacity fell from 18.98 million b/cd in January 2020 to 18.16 million by January 2026 — about 4–5%, or near 0.9 million b/d on a mid-2026 run-rate including Benicia.
Why is the starting point 2020 and not 2019?
Because U.S. operable capacity peaked on January 1, 2020 at 18.98 million b/cd, per the EIA series. Philadelphia Energy Solutions stopped after a 2019 fire but was still carried as idle in the January 2020 figure and removed by the EIA in the 2021 report.
Which states lost the most capacity?
California accounts for the largest share — 564,700 b/d across four sites (Martinez, San Francisco, Los Angeles, Benicia) — followed by Louisiana at 466,146 b/d. The single largest facility removed was Philadelphia (PES) at 335,000 b/d.
Do renewable-diesel conversions count as closures?
They are counted separately. A conversion removes the site’s crude oil processing (which is why it leaves operable capacity) but repurposes the plant rather than shutting it. Five of the eleven entries are conversions to renewable fuels or terminals; the fate column marks each one. Removing crude capacity that way also shrinks the denominator of utilization, the series the 3-2-1 crack spread is set against in refinery utilization.
Last updated — 19 September 2026
Disclaimer – Financial Information: The analyses, commentary, and content published on eco3min.fr are provided for informational and educational purposes only. They do not constitute investment advice or a solicitation to buy or sell financial instruments. Past performance is not indicative of future results. All investment decisions involve risk and are the sole responsibility of the reader.