
European Gas Crisis: Why There Is No Global Price and What It Cost Competitiveness

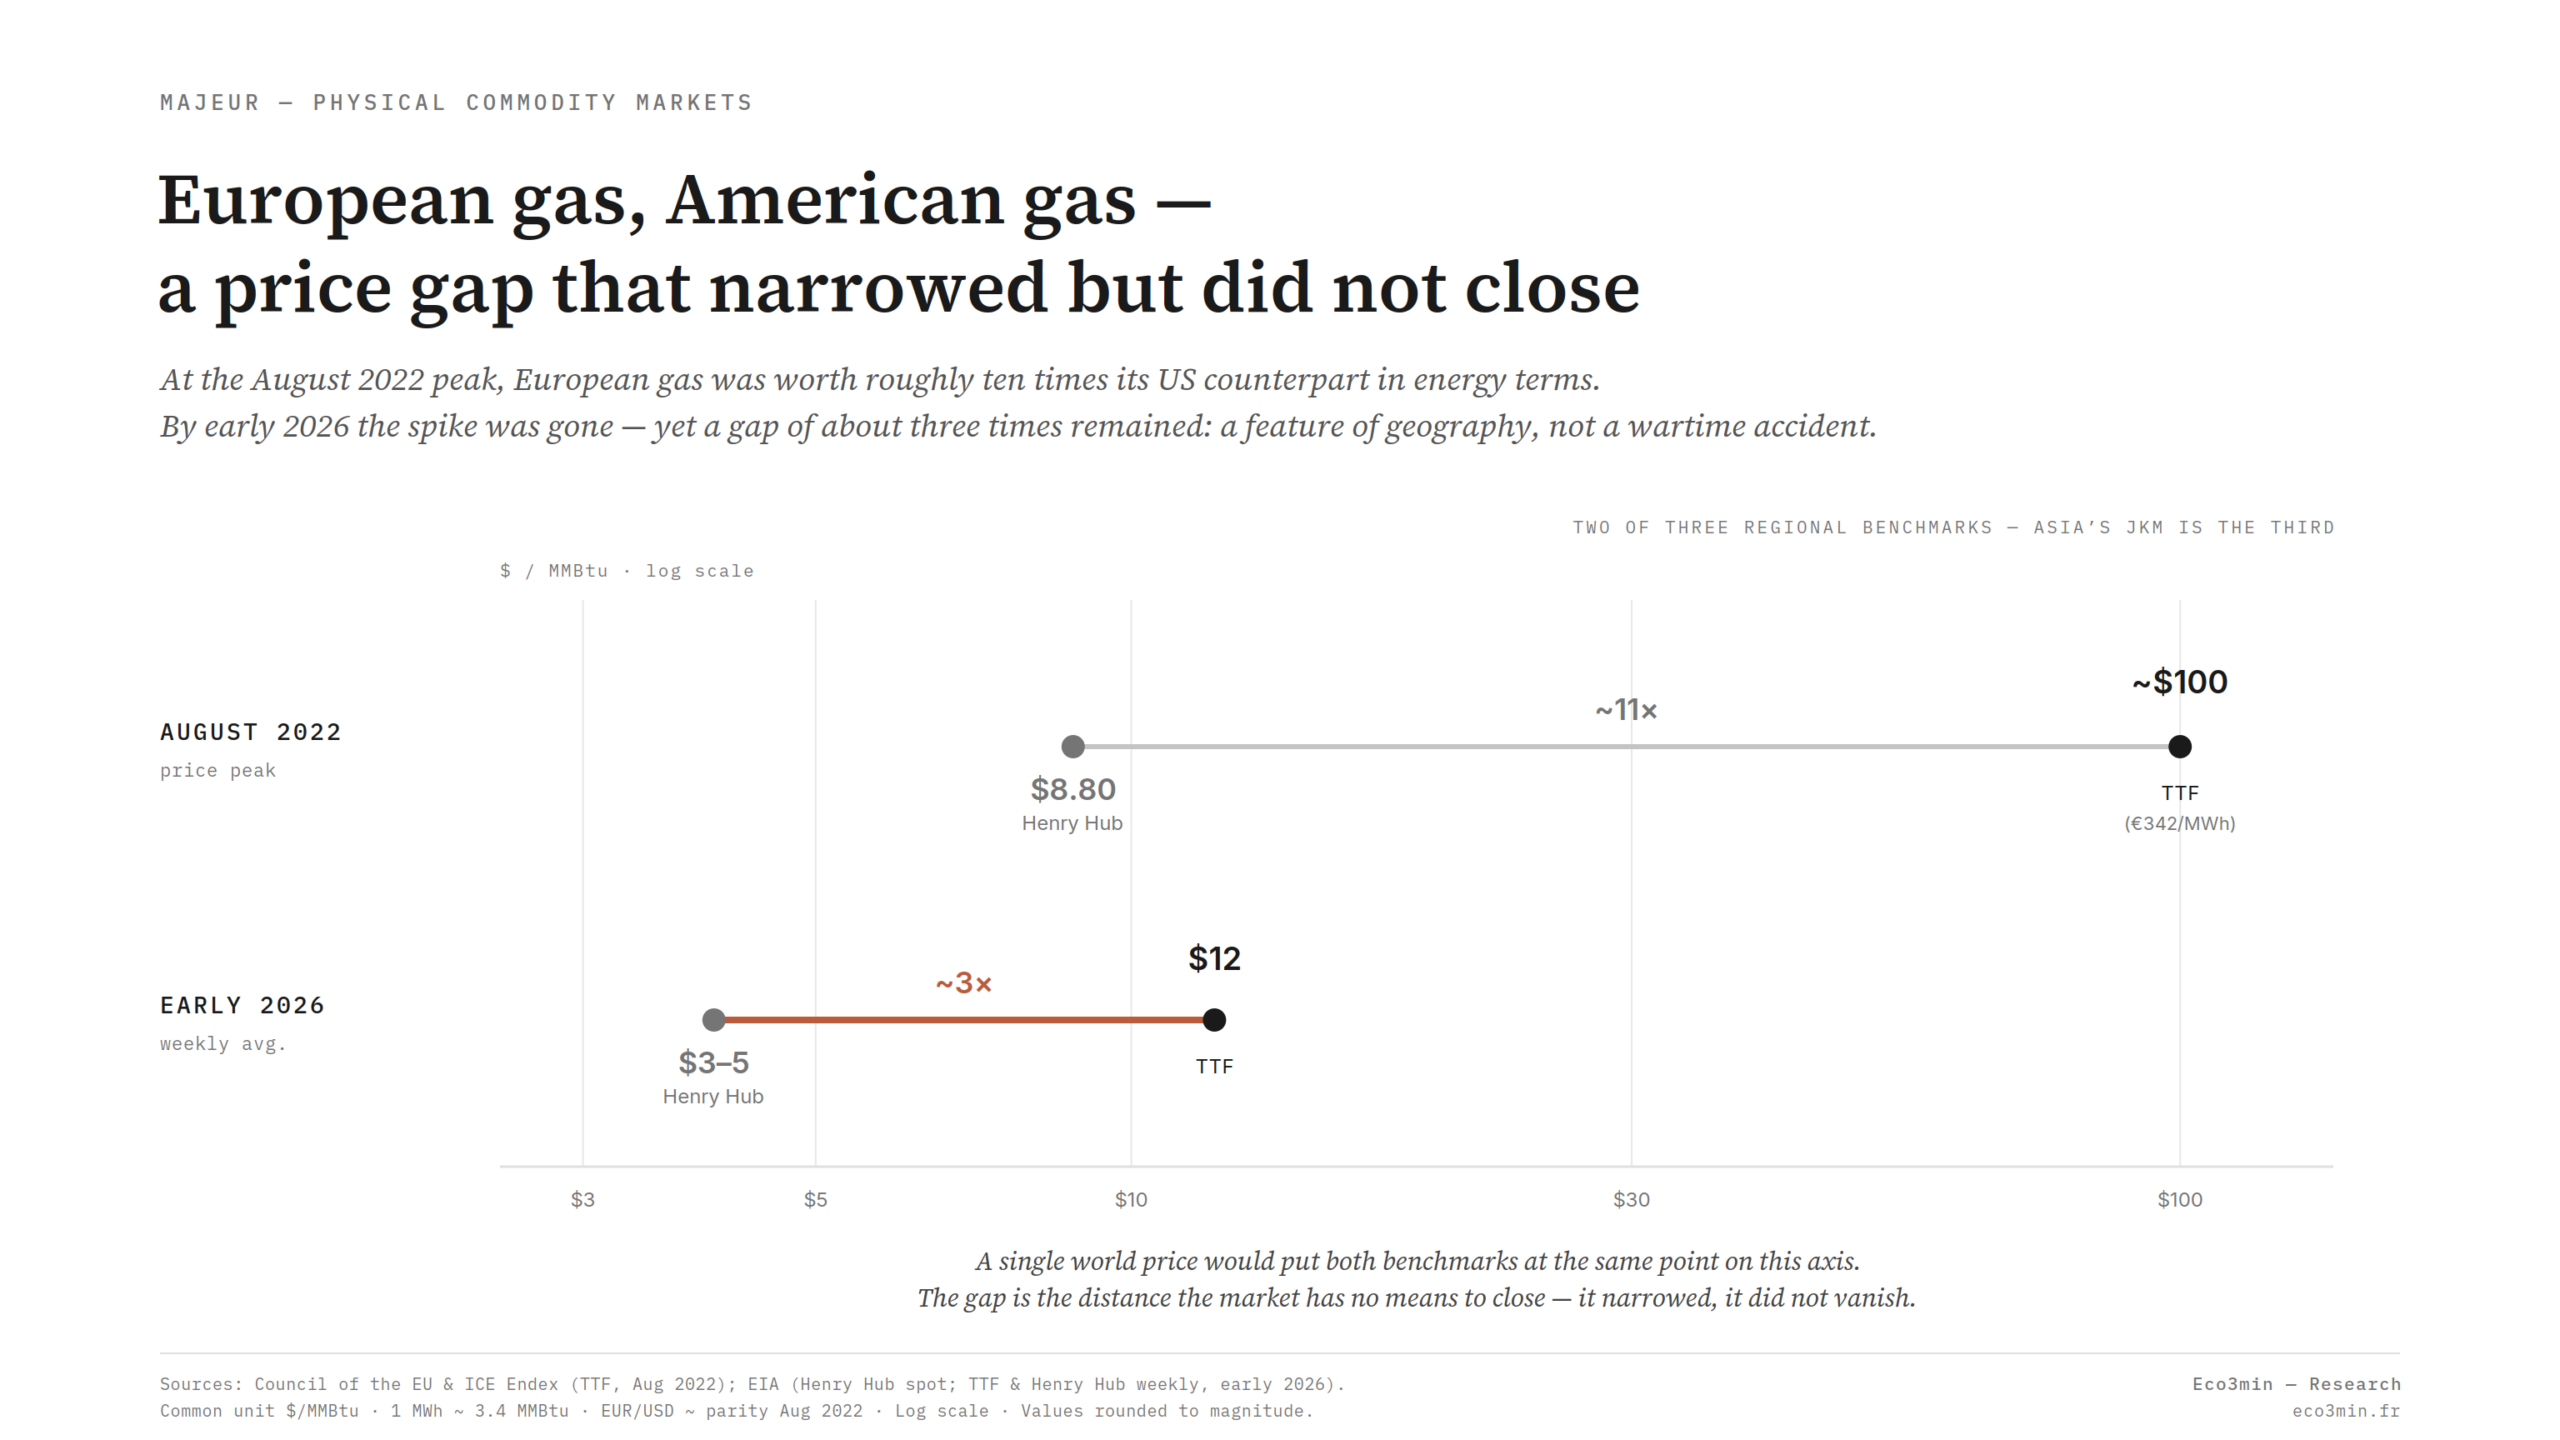
Natural gas has no world price. Three loosely linked regional markets coexist, and the gap between them now measures a competitiveness differential between industrial zones rather than a passing market quirk.
TL;DR
Because natural gas clears in three loosely linked regional markets, a supply shock a world price would spread fell almost entirely on Europe in 2022, exposing a lasting competitiveness gap.
- At the August 2022 peak the European TTF exceeded €300/MWh (versus a €5–35 prior-decade average, Council of the EU) while US Henry Hub stayed near $8.80/MMBtu, leaving European gas worth ten to twelve times American gas in energy terms (EIA).
- Russian pipeline gas had covered about 40% of EU demand before 2022 (European Commission); its halt made the US the world's largest LNG exporter in 2023 at 11.9 billion cubic feet per day (EIA), with Europe taking roughly two-thirds.
- The TTF–Henry Hub spread, widened further by the EU emissions trading system's carbon cost absent in the US, behaves not as a tradable deviation but as a persistent planning input: a feature of geography that has migrated from the trading desk to the boardroom.
The angle here is not the 2022 crisis as an event, but the structural fracture it exposed — and the lasting cost it imposed on European industry.
A market anomaly: gas without a single price
Oil obeys a simple rule: a barrel costs roughly the same everywhere, give or take freight and quality. A tanker is enough to move the cargo from one basin to another, so a durable price gap between two regions is quickly arbitraged away. That property, so ordinary it goes unnoticed, underpins the intuition of a single world price for energy. Natural gas does not comply. At the very same moment, the same cubic meter can cost three to four times more on one continent than another, and the gap can persist for months.
The cause is physical. At ordinary temperature and pressure, gas occupies a vast volume for little energy. Shipping it across oceans means cooling it to around −160°C to liquefy it, loading it onto specialized carriers, then regasifying it on arrival. This liquefied natural gas chain is expensive, draws on scarce terminals and a limited number of vessels, and has nothing of the simplicity of chartering an oil tanker. As long as that chain stays constrained, each major region behaves as a largely self-contained market with its own benchmark price.
Three benchmarks dominate today. In Europe, the Dutch TTF, a virtual hub that has become the gauge of continental gas. In North America, Henry Hub, quoted in Louisiana, reflecting the abundance of the US domestic market. In Asia, JKM, the spot index for LNG cargoes delivered to Japan and South Korea. These three prices move according to supply-and-demand logics specific to each zone, connected only at the margin by tanker flows. Grasping this regionalization is the precondition for reading gas seriously: it is what makes possible the gaps that oil dissipates almost instantly. The mechanics are set out in a dedicated analysis of why gas has no world price.
This singularity is not a technical curiosity reserved for traders. It carries a first-order economic consequence: when regional prices diverge sharply, energy ceases to be a comparable input cost from one zone to another. It becomes a variable that sets producers apart. Gas then joins the family of commodities whose behavior shapes the broader complex — alongside crude oil, which does have a single world price — with one difference: gas occupies a place apart, that of a major energy resource that has stayed regional. The wider framing belongs to commodity regimes and physical constraints.
This absence of a world price is nothing new. For decades, gas traded almost exclusively by pipeline, under long-term contracts whose price was indexed to oil rather than set by a gas market of its own. The logic was defensive: lacking a liquid gas reference, indexing to crude offered a shared benchmark between seller and buyer. Only gradually, as trading hubs gained depth, did gas-specific pricing emerge — Henry Hub in the US in the 1990s, TTF in Europe in the 2000s. Gas thus acquired its own prices, but regional ones, never a single quote.
Each of the three main benchmarks follows a distinct price-formation logic, and that diversity is what sustains the gaps. Henry Hub reflects first the abundance of US domestic production: it is supply-driven, little sensitive to imports. TTF, by contrast, is an importer’s price: with Europe producing little, its benchmark is governed by the availability of external supply, storage levels and competition for cargoes. Asian JKM, finally, reflects peak demand largely met by long-term contracts, with a spot segment that flares when Asia outbids. Three logics, three prices: a single market would require them to merge, which the transport constraint forbids.
This three-pole structure carries an analytical consequence often overlooked. The price of gas in one region informs only weakly about the other two. A low Henry Hub does not signal cheap world gas; it signals American abundance. A high TTF does not reflect a planetary shortage; it reflects European strain. Reasoning about “the price of gas” as if a single magnitude existed leads to misreadings: one must always specify which market is meant, and read the gaps rather than the isolated levels.
2022: the fracture made visible
The regionalization of gas predated the war. But it stayed quiet as long as Europe held a cheap, stable supply: Russian pipeline gas, which before 2022 covered on the order of 40% of EU demand, according to European Commission estimates. The reduction and then halt of those flows from the spring of 2022 turned a background separation into a spectacular price fracture.
The numbers convey the scale of the shock. According to the Council of the European Union, the TTF benchmark exceeded €300/MWh in August 2022, an all-time record, with five consecutive sessions above €265/MWh between 22 and 26 August; ICE Endex data place the intraday peak near €342/MWh on 26 August. For scale, the Council notes that the prior decade’s average ranged between €5 and €35/MWh. At its peak, European gas traded near ten times its historical norm.
At the same moment, across the Atlantic, Henry Hub stayed on an entirely different plane. According to the US Energy Information Administration, the Henry Hub spot price peaked at about $8.80/MMBtu in August 2022, for a 2022 annual average of $6.45/MMBtu. Converted into the same energy unit, the TTF’s €342/MWh is equivalent to nearly $100/MMBtu — the euro and the dollar then trading close to parity. At the peak, European gas was worth, in energy terms, on the order of ten to twelve times American gas. A gas-consuming plant in Antwerp and its competitor in Houston no longer lived in the same energy economy.
What 2022 reveals, then, is not the cyclical fragility of one supply line, but how wide the gap between markets can grow when a supply shock hits one zone and not the others. The regional gas system, stripped of its Russian relief valve, had no fast mechanism to equalize prices: LNG does not deploy in a few weeks, terminals are not built in a quarter. So the gap rose until European demand, through rationing and demand destruction, finally adjusted. The full sequence, from supply shock to industrial rationing, is reconstructed in the anatomy of the 2022 shock.
The asymmetry of the shock is the point. The same disruption — a major supplier withdrawing — would barely register in a world-priced commodity, where global supply reshuffles to fill the hole. In gas, because each region clears on its own, the withdrawal fell almost entirely on the zone that had relied on it. Europe absorbed the full force of a supply loss that the global system could not redistribute fast enough, and the price recorded that concentration. A world market would have spread the shock; a regional one concentrated it.
One point deserves emphasis, because it is often passed over: the episode also confirmed a geographic shift in flows. According to the EIA, the United States became the world’s largest LNG exporter in 2023, ahead of Australia and Qatar, averaging 11.9 billion cubic feet per day — with Europe absorbing roughly two-thirds of those volumes. The continent replaced the Russian pipe with seaborne cargoes, paid at the world LNG price. Security of supply was rebuilt, but at the cost of permanent exposure to Asian competition for every available carrier.
The way 2022 unfolded shows how a regional market absorbs a rupture with no relief valve. Stripped of Russian gas, Europe raced to fill storage before winter, pulling in available LNG cargoes en masse and outbidding Asia for every carrier. That inelastic demand — storage had to be filled, whatever the price — drove TTF to its records. Seasonality, normally absorbed by inventories, became an acute source of strain: every cold spell bore directly on a system with no slack.
The adjustment, unable to come from supply in the short run, came from demand. Part of the most energy-intensive industry cut or halted output — demand destruction that helped cap prices as much as the extra LNG imports did. This demand-side adjustment is the flip side of a constrained regional market: when supply cannot widen fast, it is consumption that bends, and it bends first where energy weighs most in costs.
The size of the gap demands a methodological note, because the two markets are not quoted in the same unit. TTF is expressed in euros per megawatt-hour, Henry Hub in dollars per million BTU. To compare them, one must convert: a megawatt-hour equals about 3.4 million BTU, so the €342/MWh of the August 2022 peak corresponds to nearly $100/MMBtu once the euro and dollar are brought to their then-parity. It is this conversion that gives the factor of roughly ten its meaning: it is not a currency or unit effect, but a real gap in the cost of energy.
The shock was such that it pushed the European Union to debate, in late 2022, a market correction mechanism meant to cap extreme TTF peaks. The episode, whatever its outcome, signals one thing: a gas market price had become a matter of public policy, proof that the fracture had left the technical sphere for that of state decisions.
The TTF–Henry Hub spread: reading a competitiveness gap
If the three markets each keep their own price, then the decisive information is not the level of any isolated benchmark, but the gap between them. For Atlantic industry, the central gauge is the TTF–Henry Hub spread: the difference, expressed in a common energy unit, between the cost of gas for a European manufacturer and for its American counterpart.
This spread is no trader’s metric. It is the quantified translation of an economic fact: part of the production cost of entire sectors depends on which side of the Atlantic they sit. For an ammonia producer, for whom gas is both fuel and feedstock, a durable gap feeds straight through to the break-even point. The spread therefore functions as a measure of relative competitiveness, sector by sector, rather than as a financial market signal.
That a price gap condenses into a tracked indicator is not trivial. The spread works as a synthetic signal: it sums up, in one observable magnitude, the whole set of factors — transport, supply, capacity, regulation — that separate the two shores. For an industrial decision-maker, it is a more workable reference than the list of its components; for the analyst, it is an entry point into each of them. But that convenience has a downside: a single indicator invites simplification, as if it alone described an economy’s competitiveness. It does not — it illuminates one dimension, the cost of energy for the sectors exposed to it.
Reading it requires decomposing what it contains. One part reflects transport and liquefaction: American gas exported to Europe carries the cost of the LNG chain, which sets a floor below which the gap will not fall as long as shipping cargoes remains profitable. Another part reflects the supply-demand balance on each shore: abundant production in the US, import dependence in Europe. A third reflects the physical capacity available at a given moment — regasification terminals, vessels, long-term contracts already committed. It is the stacking of these components that explains why a differential that was marginal before 2021 became, after 2022, a structural variable in industrial investment decisions.
What makes this gauge unusual is that it can stay wide. In a commodity with a world price, a large gap between two regions is a temporary disequilibrium that arbitrage closes. In gas, the gap is not a disequilibrium to be corrected but a feature of a market that lacks the means to equalize. The spread can therefore persist at levels that, for oil, would be unthinkable — and industrial actors must treat it not as noise around a single price but as a durable parameter of where production is viable.
That distinction reframes how the number should be used. A volatile spread around a converging mean would be a trading signal; a persistent spread around a structural gap is a planning input. The first invites timing; the second invites location. Reading the spread correctly therefore means reading it as a feature of geography rather than a deviation to be reversed — which is exactly why it has migrated from the trading desk to the boardroom.
A comparison clarifies the gas case. In oil, the gap between regional benchmarks — the spread between US and European crude — mainly reflects logistical frictions within a market that is otherwise global and arbitraged. The gas differential is of a different nature: it separates two structurally distinct markets that nothing compels to converge as long as transport capacity stays limited. Reading the TTF–Henry Hub spread, then, is reading the cost of the fracture itself, condensed into a single number. This analysis belongs to the broader field of physical commodity markets, where a commodity’s price reads as a balance of power between zones.
A factor often omitted widens the effective gap further to Europe’s disadvantage: the cost of carbon. The European Union’s emissions trading system raises the cost of using fossil fuels, adding to the European gas price a component absent, to date, from the American market. For an energy-intensive sector, the competitiveness differential therefore does not reduce to the raw gas spread: it also incorporates this carbon-pricing gap, which widens the full cost of energy on one side of the Atlantic. The market-price fracture is thus compounded by a regulatory one.
The spread’s recent history illuminates its change of status. Before 2021, the gap between TTF and Henry Hub was modest and largely ignored by industrial decisions: European energy, fed by cheap Russian gas, stayed competitive. Strain began in late 2021, with low European storage and already-reduced Russian flows, before the 2022 explosion. What was a marginal variable became, in a few quarters, a structuring parameter of location decisions. The spread did not merely change level; it changed role.
An epistemic caveat remains: what, exactly, is being measured? The spread is an observable fact, computed from two public price series. The competitiveness differential inferred from it is, by contrast, an inference: it assumes energy weighs heavily enough in the cost structure to make the difference, which holds for energy-intensive sectors but not for the whole economy. Conflating the two would overstate the effect of gas where it is marginal. Rigor requires distinguishing the number, which is solid, from its reach, which depends on the sector in view.
LNG: a partial connector, not a unifier
How, then, do American cargoes reach Europe when prices there surge, if the markets are separate? Precisely because the separation is not total. LNG turns a regional molecule into a shippable commodity and acts as a bridge between zones. But it is a narrow bridge, and that narrowness is the key to everything. The structural reading of energy and metals markets situates this within the cluster.
The mechanism is arbitrage. When a price gap opens between two regions, an uncommitted carrier has an incentive to sail toward the one paying most. That additional flow tends to lower the price in the expensive zone and raise it in the cheap one, narrowing the gap. In theory, perfect arbitrage would close the spread. In practice, it narrows it without ever erasing it, because transport capacity is bounded: a finite number of liquefaction terminals, a limited tanker fleet, long-term contracts that lock up part of the volumes, regasification terminals saturated at peak. How that arbitrage operates — and runs into its limits — is detailed in the analysis of LNG as a partial connector.
The asymmetry of the arbitrage is worth stressing. A cargo can move toward Europe when European prices rise, but it cannot conjure new liquefaction capacity when none is available. The flexibility runs in one direction — redirecting existing supply — not in the other — creating more of it on short notice. This is why a demand surge in one basin lifts prices in both: the same finite pool of mobile cargoes is simply contested more intensely, rather than expanded.
Here lies a weak signal, rarely highlighted: the constraint that sets the width of the spread is less the price of gas than the availability of the logistics chain. When Europe and Asia compete for the same cargoes, it is the number of carriers and the capacity of terminals that arbitrate, not just the supply of molecules. Strain on maritime freight, prolonged maintenance at a terminal, a contract term coming free: each shifts the gap between markets independently of gas fundamentals. The global gas market is, on this view, in a slow transition from a system of regional pipes toward a seaborne market — without being unified yet.
The contractual structure of LNG matters as much as physical capacity. A large share of global volumes moves under long-term contracts, often fifteen or twenty years, that direct cargoes to predefined destinations regardless of momentary price gaps. These committed volumes do not take part in arbitrage: only the uncontracted fraction, the spot market, can redirect toward the highest bidder. The smaller the spot share, the less effective the arbitrage, and the more regional gaps can settle in. The system’s flexibility thus depends as much on the nature of contracts as on the number of ships.
Supply, moreover, is concentrated among a few players. Qatar, one of the world’s top exporters, and the United States, now the largest, structure most of the flows. This concentration gives LNG a dimension that exceeds the market: a major exporter’s decision to commit, or not, new liquefaction capacity sets, for years, the width of the bridge between markets. Building a liquefaction terminal takes years and tens of billions: the supply of connection does not adjust to demand the way a price adjusts to a volume.
This is why the underlying trajectory is one of slow transition, measured on a decade scale. As American and Qatari capacity ramps up and Europe densifies its regasification terminals, the bridge widens and the arbitrageable fraction of the market grows. Global gas migrates gradually from a system of regional pipes toward a more integrated seaborne market. But that movement is counted in years, not quarters, and as long as it is unfinished, the geography of prices remains.
This reading has a direct implication for industry: as long as liquefaction and transport capacity grows no faster than demand, price convergence will stay incomplete, and the Atlantic differential will persist in a milder form. The fracture is not a fixed state, but neither is it on a path to rapid disappearance. It deforms at the pace of infrastructure.
It is often said that LNG will “unify” the global gas market and erase the price gap. This reading confuses partial connection with merger. LNG draws regional markets closer through arbitrage, but limited liquefaction, shipping and regasification capacity prevents it from equalizing prices: the gap narrows without closing, and persists as long as infrastructure stays constrained.
From wholesale price to inflation: the European channel
The 2022 gas shock did not stop at the factory gate. It ran through the entire European economy via the price channel, and that is how a regional commodity ended up redefining a continent’s monetary framework. The mechanism runs through three links.
First link, direct: gas enters households’ energy bills, for heating and hot water. Second link, indirect but powerful: the price of electricity. In most European markets, the wholesale electricity price is set at the margin by the last plant called to balance the grid, often a gas-fired one. When gas surges, it drags the electricity price up with it, even for kilowatt-hours produced by other sources. Third link: the production costs of whole swathes of industry, which feed through to consumer prices with a lag.
The statistical result is unambiguous. According to Eurostat, euro-area inflation peaked at 10.6% in October 2022 — a level the ECB describes as the cycle peak. The energy component then carried an annual rate of 41.9% and contributed, on its own, 4.44 percentage points to the total, close to half of measured inflation. A regional commodity, priced on a Dutch trading hub, thus bore directly on purchasing power from Lisbon to Helsinki.
For the European Central Bank, facing an imported supply shock, the trade-off proved delicate. A shock from energy is not a demand overheating: tightening policy does not bring down the price of gas. But letting inflation run risked unanchoring expectations and feeding second-round effects through wages and margins. The euro-area monetary framework thus found itself partly determined by a variable over which it had no direct grip. The fine mechanics of that transmission, from wholesale gas to the CPI and then to ECB decisions, are addressed in the channel into European inflation. Related framing: the euro area’s energy import bill.
The electricity link deserves detail, because it explains why the shock exceeded households’ gas bills alone. In a wholesale market organized by merit order, the price of electricity for a given period is set by the cost of the last generating unit called to meet demand. When that marginal unit is a gas plant — common at peak hours — the wholesale electricity price aligns with the cost of gas, including for electricity produced by far cheaper sources. The gas price thus propagates to the entire kilowatt-hour, amplifying transmission well beyond gas’s direct share in consumption.
Propagation does not stop at energy prices. By raising production and transport costs, the shock spread with a lag to the prices of other goods and services, feeding the core component of inflation. These are the second-round effects: the initial rise, concentrated in energy, feeds into wage bargaining and margins, and ends up embedded in prices that, on the surface, have nothing to do with gas. It is this delayed diffusion that turns a sectoral shock into a durable macroeconomic problem.
For a central bank, such a shock poses an asymmetric problem. Monetary tightening acts on demand, not on the supply of gas: it cannot lower the price of energy, only compress the rest of the economy to contain second-round effects. The trade-off thus pits the risk of unanchoring expectations against the risk of worsening a slowdown already fed by expensive energy. Monetary policy finds itself required to react to a variable it does not control, with tools that act only indirectly on the problem.
This macro-micro crossing is precisely what distinguishes gas from a simple sectoral cost. The price of a molecule traveled up the chain to the policy rate, by way of the electricity market and the price index. Each link is an analytical point in its own right; together they trace the trajectory of a shock that, starting from a cut pipe, ended on the Governing Council’s desk in Frankfurt.
The industrial cost: deindustrialization in question
At the end of the chain lies the most debated question: did gas durably more expensive than in the US trigger a structural deindustrialization of Europe? The thesis is frequently asserted, more rarely documented with precision. It deserves to be posed rigorously, because it sometimes conflates two distinct phenomena.
Some production is structurally exposed to the gas price. Ammonia and nitrogen fertilizers first, for which gas is not only fuel but feedstock: their economics track the gas price almost mechanically. Base chemicals next; then the high-heat industries — steel, glass, ceramics, foundries. For these sectors, a durable price gap is not offset by productivity gains: it shifts the break-even point. The response has taken several forms — temporary shutdowns, permanent closures, investment redirected toward energy-abundant regions. The sector-by-sector detail, and the distinction between cyclical adjustment and durable relocation, is the subject of the analysis on which sectors left Europe.
Documenting this rigorously means resisting two symmetric errors. One inflates the effect, reading every plant closure as proof of terminal decline and every relocation as permanent. The other dismisses it, treating the whole episode as a temporary price spike now behind us. Neither survives contact with the sectoral detail: the truth is uneven, strong where gas is feedstock and energy is most of the cost, weak where it is a minor input. A serious account has to hold that unevenness rather than collapse it into a single verdict.
The nuance matters. Part of the shutdowns seen in 2022–2023 reflected a temporary adjustment to a price peak: output cut until TTF fell back, then restarted. Another part looks like a durable shift in the industrial center of gravity, where new investment heads to where energy is cheaper, with no plan to return. Concluding too quickly to a generalized deindustrialization overstates the effect; denying it would ignore a real price signal for the most exposed sectors. The question is not whether energy matters, but where the threshold sits — and which side of it each sector now stands on.
The distinction between gas-as-fuel and gas-as-feedstock structures exposure. For a foundry or a glassworks, gas provides heat: a high price weighs on costs but leaves, in principle, room for energy efficiency or partial substitution. For ammonia, gas is the feedstock itself, converted into hydrogen and then fixed nitrogen: there is no cheap substitute at scale, and the sector’s economics track the gas price almost without a buffer. These sectors therefore do not respond the same way to the same price gap, and aggregating them into a single “deindustrialization” diagnosis masks that heterogeneity.
The decisive criterion is not the size of the shock at a given moment, but its anticipated duration. A manufacturer halts a unit temporarily in the face of a peak it believes transient; it durably relocates an investment if it expects a persistent gap. It is the anticipation of a lasting fracture, more than the peak itself, that turns a cyclical adjustment into a relocation. The structural reading of the fracture — precisely the subject of this analysis — thus bears directly on the decisions it describes.
This differentiation also marks the line between this structural reading and supply-side diagnoses. One strand of analysis stresses that the apparent calm in prices masks underinvestment upstream, liable to generate future strain. That is a forward-looking thesis, centered on resource availability. The present argument is retrospective and structural: it concerns the price fracture already in place and its competitiveness cost. The two readings are complementary, not competing — one watches the supply risk to come, the other the geography of prices already here.
A commodity can be read by whether or not it has a single world price. Oil, simply transportable, has one: its regional gaps are logistical frictions. Gas, whose ocean transport requires liquefaction, does not: its regional gaps are structural differentials that measure a competitiveness relationship between zones. Distinguishing these two regimes — an arbitraged world price versus loosely linked regional prices — is the frame that allows gas to be interpreted without wrongly applying the intuition inherited from oil.
A structural fracture, not an accident
There remains the dominant reading, which must be named in order to be qualified. The most common narrative casts 2022 as a passing shock: a wartime crisis, exceptional, whose end is marked by the normalization of prices. With TTF levels having fallen well back from the peak, this narrative concludes the parenthesis is closed. It rests on an implicit assumption — that the fracture was a product of the war, hence temporary.
The data suggest otherwise. The fragmentation of the gas market predates the conflict: it follows from the physics of transport, not the geopolitics of 2022. The war did not create the absence of a world price; it violently revealed its cost by removing the source that kept Europe sheltered. Three structural facts confirm the phenomenon’s persistence. First, European dependence on Russian pipeline gas, which covered about 40% of demand before 2022, has fallen below 15% and been durably replaced by LNG at the world price. Second, the United States established itself as the world’s largest LNG exporter in 2023 and again in 2024, according to the EIA, and Europe remains its main outlet: the new architecture is seaborne, competitive and permanent. Third, the price gap itself has not closed. In early 2026, the EIA’s weekly figures placed TTF around $12/MMBtu, against a Henry Hub on the order of $3 to $5/MMBtu over the same period — a factor of about three, well below the 2022 peak but markedly above the era of cheap Russian gas.
The contrast with the other side of the fracture illuminates the mechanism. If Henry Hub stays durably low, it is not only because Europe is under strain: it is because the United States is in abundance. The shale gas revolution unlocked vast reserves there and made the US domestic market a structurally well-supplied system — to the point that in 2024, again according to the EIA, Henry Hub averaged $2.21/MMBtu, the lowest real price ever recorded. The gap thus reads from both sides: maintained scarcity on one shore, maintained abundance on the other. The fracture is not the anomaly of a market in crisis; it is the normal state of a market that has no world price, rendered costly for Europe by the disappearance of its cheap source.
American abundance is no geological accident but the product of an industrial transformation. Hydraulic fracturing and horizontal drilling unlocked, from the 2000s, vast reserves of unconventional gas, especially in the Appalachian basin. The United States went from anticipated importer to the world’s largest producer and exporter in about fifteen years. That shift set a low and durable floor under Henry Hub, independent of European strain: one side of the gap is a story of maintained abundance, not merely of scarcity endured on the other.
The persistence of the gap also shows in its volatility. Far from converging toward a stable value, the spread deforms with winters, terminal maintenance and arbitrage between importing basins. That very instability is a structural trait: a weakly arbitraged market does not smooth shocks the way a unified world market would. The fracture is thus not only a level of gap, it is a regime — that of a market that reacts in fits and starts because nothing compels it toward unity.
This persistence is no fatality, and that matters. Expanding American and Qatari liquefaction capacity, the construction of regasification terminals in Europe, the arrival of new tanker fleets: all of it tends to widen the bridge and so narrow the gap. But as long as transport capacity grows more slowly than global LNG demand, convergence will stay incomplete. The differential will deform rather than vanish. The medium-term horizon is not a single price, but a narrower and more volatile fracture.
The 2022 crisis did not create the gas market fracture: it made visible, and costly, a regionalization of prices that predated it and outlives it.
What remains to watch
Reading the fracture as a structural feature does not say how it will evolve; it indicates which variables govern its width. Three of them deserve particular attention, not as predictions but as reading points.
The first is global liquefaction and transport capacity. Each wave of new terminals and new carriers widens the bridge between markets and tends, mechanically, to narrow the gaps. The commissioning schedule of that capacity — in the United States, in Qatar, elsewhere — is therefore one of the most direct determinants of the spread’s trajectory. To watch that schedule is to watch the pace at which the market moves, or does not, toward integration.
The second is Asian demand. JKM and TTF compete for the same cargoes: a vigorous recovery in Asian LNG demand tightens the supply available to Europe and widens prices, while an Asian slowdown eases the competition. The balance between the two importing basins is thus a first-order factor, controlled by neither Europe nor the United States.
The third is the place of gas in the energy mix. The pace of renewables deployment, the role given to nuclear, climate policies and the cost of carbon alter structural gas demand and, in time, economies’ sensitivity to its price. These choices belong as much to politics as to the market. None of these variables lends itself to confident forecasting; together they form the grid through which to observe the deformation of the fracture in the years ahead.
When energy becomes a variable again
For half a century, much of the industrial economy treated energy as a stable input cost, almost a constant. The fracture of the gas market overturns that assumption for an entire zone. When the same cubic meter of gas is worth, in energy terms, several times more depending on the continent, energy ceases to be a common parameter and becomes a factor of differentiation among producers. For a Europe whose heavy industry was built on abundant, cheap energy, this is the end of an advantage taken for granted.
The shift is less about any particular price than about a change in what energy is, analytically. For a generation of industrial planning, the cost of energy entered models as a stable assumption, a number that moved within a narrow band and rarely altered where things were built. The gas fracture turns that assumption into a question. Where energy sits in the cost structure now interacts with geography in a way it did not when a cheap, stable pipeline fed the continent. That is the durable change: not a level, but the promotion of energy from constant to variable.
That promotion has consequences beyond any single industry. When energy is a constant, competition turns on labor, capital and technology; when it becomes a variable that differs by region, it joins that list as a factor in its own right. The map of energy costs starts to shape the map of production. This is not a forecast of where industry will go, but an observation about which variable has entered the calculation — and stayed in it.
This is no basis for a final verdict. An economy’s competitiveness does not reduce to the price of gas: it depends on productivity, human capital, value chains, energy-policy choices, and how fast other sources — renewables, nuclear — can take over. Gas is one factor among many, much as crude oil or uranium, with its own reference price, sits within a broader energy complex. But gas is now a visible and measurable factor, where it was previously invisible because stable. It is that change of status, more than any given price level, that constitutes the durable information.
This reintroduction of energy as a variable is not specific to gas, but gas is its clearest case. Oil, with its world price, imposes the same input cost on everyone: it shifts margins over time, with its cycles, but does not durably separate one zone from another. A connected reading: why the refining margin can matter more than the barrel. Gas, because it stays regional, introduces a geographic dimension oil lacks: it does not merely vary the cost of energy over time, it differentiates it across space. It is this spatial dimension — the same input, durably distinct prices by continent — that makes it a singular geoeconomic object, and not simply one more cost line.
The fragmentation of the global gas market is thus the signal of a wider shift: the return of energy as a first-order geoeconomic variable. The gaps between TTF, Henry Hub and JKM are not market oddities; they trace a map of costs that separates industrial zones. What remains is to observe how that map deforms as transport infrastructure expands, as Asian demand evolves, and as energy policies redefine the place of gas in the mix. The fracture does not close at a stroke — it now reads as a structural feature of the world economy.
- Natural gas has no single world price: three regional markets — European TTF, US Henry Hub, Asian JKM — coexist, connected only at the margin by LNG flows, because ocean transport of gas requires costly liquefaction.
- The TTF–Henry Hub spread measures an energy cost differential between industrial zones: at the August 2022 peak, European gas was worth in energy terms on the order of ten times American gas (TTF ~€342/MWh ≈ $100/MMBtu against Henry Hub ~$8.80/MMBtu, per the Council of the EU, ICE Endex and the EIA).
- The shock fed through to European inflation: according to Eurostat, energy contributed 4.44 percentage points to the euro area’s 10.6% inflation peak in October 2022, close to half the total.
- The fracture is structural and predates the war, not a cyclical accident: in early 2026 the TTF–Henry Hub gap persisted at a factor of about three, and European dependence on Russian gas fell from roughly 40% to below 15% of demand, durably replaced by LNG at the world price.
Last updated — 12 July 2026
Disclaimer – Financial Information: The analyses, commentary, and content published on eco3min.fr are provided for informational and educational purposes only. They do not constitute investment advice or a solicitation to buy or sell financial instruments. Past performance is not indicative of future results. All investment decisions involve risk and are the sole responsibility of the reader.
Read next
Full pillar →IMO 2020: the regulatory shock that rewrote product spreads
An environmental rule on marine sulfur can move a refining spread more than a swing in crude. IMO…
The 2022–2023 refining golden age: anatomy of an episode
In 2022, refined fuel prices climbed faster than crude. That gap, measured by the 3-2-1 crack spread, reached…
Diesel versus gasoline: why the two crack spreads diverge
The 3-2-1 crack blends gasoline and distillate into a single number, and that convenience hides something the market…


