
The US Share of the World Stock Market: History and the 50% Record
Eco3min Research · Global Equity
Everyone is calling the US a record share of the world’s stock market. On the data, it has been here before.
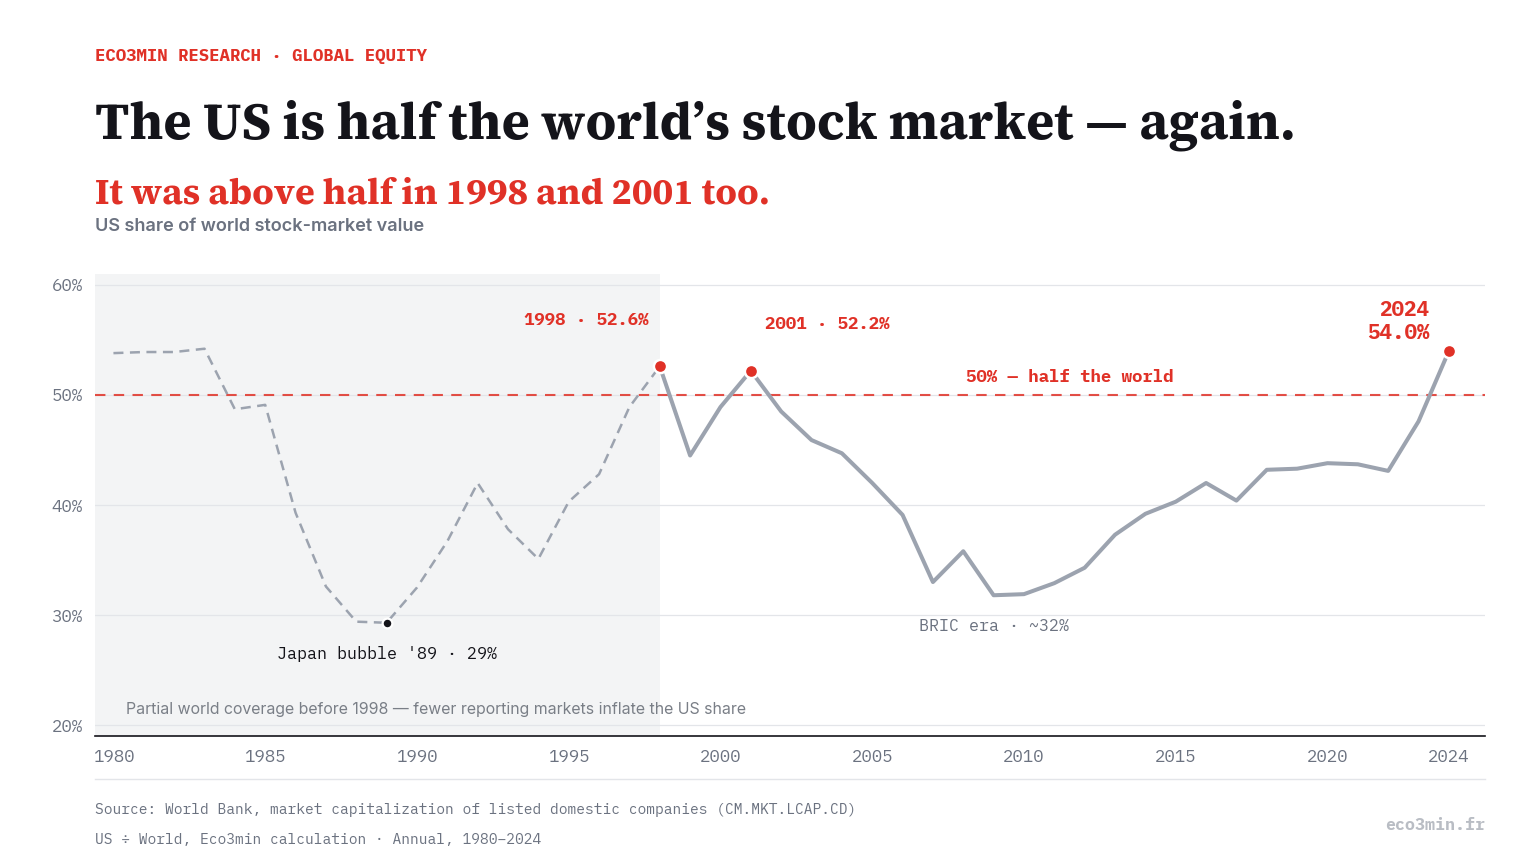
The United States is back above half of the world’s stock-market value — about 54% in 2024 on World Bank data, roughly $62 trillion of US market capitalization against a world total near $115 trillion. A wave of coverage has called this a first: the US passing 50% of global market capitalization for the first time in history.
The historical record on the same measure is more precise, and more interesting. The US share of world equity already crossed 50% in 1998 and again in 2001, during the dot-com era. It is a number that cycles rather than trends: it cratered to 29% at the peak of Japan’s 1989 bubble, recovered through the late 1990s, fell back to about 32% during the BRIC commodity boom of the 2000s, and has climbed since. And on the only measure with a full century of data — the US weight in the developed-world equity market — the share was higher still, near 70% in the 1960s. This page compiles the World Bank series, the dates the US share crossed 50%, and what “record” does and does not mean. Read alongside: our breakdown of how real rates, multiples and earnings shape equity valuation.
The US share of world stock-market value is back above half (54% in 2024, World Bank). It is not the first time: the share crossed 50% in 1998 and 2001, and it had fallen to 29% at Japan’s 1989 peak and ~32% in the BRIC years. On the century-long developed-world measure it was higher still — near 70% in the 1960s. Whether today is a “record” depends entirely on which universe you measure.
The framing behind “record” treats the US share of world equity as a one-way climb. The data describe a cycle. A country’s slice of global market capitalization rises and falls with the relative size of its market versus everyone else’s, and over the last four decades the lead has changed hands more than once: the US in the early 1980s, Japan at the end of that decade, the US again through the dot-com years, the emerging markets in the 2000s, and the US once more in the 2010s and 2020s.
Read that way, today’s level is the latest peak of an oscillation, not an unprecedented high. The same measure that puts the US at 54% in 2024 put it at 52–53% in 1998 and 2001, and below 30% in 1989.
This is the United States’ share of the total market capitalization of all listed domestic companies worldwide — US market cap divided by the world total, both from the World Bank. It moves when US markets outperform or underperform the rest of the world, and when other countries’ markets grow or shrink. It is a relative measure, so a rising share can reflect US strength, foreign weakness, or both. Counting only listed companies also leaves aside a pool of corporate value that has tripled in a decade, which is what a shrinking listed universe measures and what it hides.
02The US has been above 50% of world equity before
The common claim is that the US has “never been this large a share of the world.” On the World Bank series it has — twice in living memory. Explore the full path below; the dashed line is the 50% mark.
54.0%
US market cap as a share of total world market cap of listed domestic companies. Dashed line = 50%. Annual; the world aggregate covers fewer reporting markets before 1998, which inflates the early readings.
The table lists the share at the cyclical turning points. “Above 50%” rows are shaded.
| Year | US share of world | What was happening |
|---|---|---|
| 1980 | 53.8% | US-led, before Japan’s bubble (thin early coverage) |
| 1983 | 54.2% | Highest reading in the series — but on partial coverage |
| 1989 | 29.3% | Japan bubble peak — Tokyo briefly the world’s biggest market |
| 1998 | 52.6% | Dot-com — US back above half |
| 1999 | 44.5% | Back below half for two years |
| 2001 | 52.2% | Dot-com — above half again |
| 2007 | 33.0% | BRIC & commodity boom — emerging markets surge |
| 2009 | 31.8% | Post-crisis trough |
| 2024 | 54.0% | US tech leadership — the “record” claim |
Source: World Bank, market capitalization of listed domestic companies (CM.MKT.LCAP.CD), US divided by World. The World Bank’s world aggregate broadens over time, so early-1980s readings rest on fewer reporting markets — which is why the highest reading in the whole series, 54.2% in 1983, is not treated here as a record: it sits inside the partial-coverage window. The 1998 and 2001 crossings sit on full coverage and are the most robust evidence that today’s level is not unprecedented. Note also that the two crossings were not a plateau: the share fell back to 44.5% in 1999 before crossing again. On a developed-world basis (see §04), the US was higher still in the 1960s.
- The US share of world equity has crossed 50% in 1998, 2001 and 2024 — the 2024 reading is the highest of the three, but not the first.
- Between those peaks the share fell to 29% (1989, Japan) and ~32% (2009, BRIC era): a swing of more than 20 percentage points.
- The 2024 figure of 54% reflects US market cap of roughly $62 trillion against a world total near $115 trillion. Separate 2026 trackers, on a different company universe, put US-listed market value near $75 trillion — more than the next nine national markets combined.
The two deep troughs in the series line up with two episodes in which the rest of the world, not the US, was the story. In the late 1980s, Japan’s asset bubble inflated the Tokyo market to the point where Japan briefly rivalled or exceeded the US in total market capitalization; the US share fell below 30%. After Japan’s bubble burst, the US share recovered through the technology boom of the late 1990s and crossed 50% in 1998 and 2001.
The second trough came in the 2000s, when the BRIC economies and a commodity supercycle expanded emerging-market capitalization rapidly and Chinese listings multiplied; the US share fell back toward 30% by the late 2000s. The climb since then has been driven by US large-cap technology — the firms now among the most valuable in the world — outpacing markets elsewhere. Each leg of the cycle is a story about relative growth, which is what a share, by construction, measures.
04The longer view: the US was near 70% of the developed-world market in the 1960s
The World Bank’s global series begins in the 1970s. To see further back, the reference is the long-run academic record of equity market capitalization. On that basis — the US share of the developed-world equity market — the United States was a larger share of the investable world in the mid-twentieth century than it is today.
In the long-run dataset of 17 advanced economies compiled by Kuvshinov and Zimmermann, the US accounted for close to 70% of the group’s combined market capitalization by the 1960s, after the rest of the developed world’s markets had been diminished by war and were still rebuilding. That is a larger share of the investable world than the US holds today: even now, at the highest weight since that 1960s era (Verdad Capital, 2024), the current level remains below the post-war peak — high on the century-long view, but not a record.
05Why “record” depends on which universe you measure
Whether today qualifies as a record is a measurement choice, and the answer changes with the universe. The criterion on this page is explicit: the US share of the total market capitalization of all listed domestic companies, from the World Bank. On that measure the US exceeded 50% in 1998 and 2001, so 2024 is not a first. On the century-long developed-world measure, the US was higher in the 1960s. Each of those peaks belongs to a distinct valuation cycle, one of the threads of the overview of equity markets and ETFs. If new data later revise these series materially, the comparison should be revisited.
There is a measure on which a record claim is defensible. On a float-adjusted equity index such as MSCI ACWI — which weights only the freely tradable shares of large and mid-cap companies, and whose history is shorter — the US weight today is roughly 63%, at or near its highest level (Verdad Capital, 2024). That is a narrower universe than total market capitalization, and a different question. The honest reading is that “the US is at a record share of the world” is true on some index measures and false on the broad market-cap measures used here. The headline omits which one. A companion piece: near-zero US net investment income.
06Methodology & data
The series is the US share of world equity market capitalization: the World Bank’s “market capitalization of listed domestic companies (current US$)” for the United States divided by the same indicator for the World aggregate, for each year. The indicator counts companies listed on a country’s domestic exchanges at end-year prices. The World Bank’s world total broadens as more countries’ exchanges enter the dataset, which inflates the United States’ apparent share in the earliest years; for that reason the series here starts in 1980, the pre-1998 span is shaded and drawn dashed in the chart, and the dot-com-era crossings of 1998 and 2001, on full coverage, carry the central claim. The long-run developed-world figures in §04 are from the published academic and yearbook sources cited below. All shares here are computed by Eco3min from the public series. Underlying data: the quarterly Buffett Indicator series.
| Series | Source | Coverage | Latest |
|---|---|---|---|
| US market cap | World Bank · CM.MKT.LCAP.CD (USA) | 1980–2024 | $62.2T |
| World market cap | World Bank · CM.MKT.LCAP.CD (WLD) | 1980–2024 | $115.1T |
| US share of world | Eco3min · USA ÷ WLD | 1980–2024 | 54.0% |
import pandas as pd

# US and World market cap straight from the World Bank API — no key
base = "https://api.worldbank.org/v2/country/{}/indicator/CM.MKT.LCAP.CD?format=json&per_page=300"
us  = pd.read_json(base.format("USA"))
wld = pd.read_json(base.format("WLD"))

# US share of world = US market cap / World market cap, by year
# (parse the JSON 'value' by 'date', then divide)
share = 100 * us_by_year / world_by_year
print(share.loc[["1998", "2001", "2024"]]) # 52.6, 52.2, 54.007Data & reproducibility
The annual US-share-of-world series used in the chart and table is available in open format, recomputed when the World Bank revises the underlying data.
License: Creative Commons Attribution 4.0 (CC BY 4.0). Free for research, academic and journalistic use with attribution.
08Questions & answers
Is the US really at a record share of the world stock market?
When was the last time the US was above 50% of world equity?
What is the US share of the global stock market in 2024?
Why did the US share fall so low in 1989?
Was the US ever a bigger share of the world than today?
Why do different sources give different numbers for the US share?
09Sources & limitations
- PrimaryWorld Bank — Market capitalization of listed domestic companies, current US$ (CM.MKT.LCAP.CD), United States and World, 1980–2024.
- AcademicKuvshinov & Zimmermann (2022), “The Big Bang: Stock Market Capitalization in the Long Run,” Journal of Financial Economics 145(2) — 17 advanced economies, 1870–2016.
- AnalysisVerdad Capital (2024) — US share of global market value near a six-decade high (~63%), the highest since the 1960s.
- CurrentVisual Capitalist / Bloomberg (2026) — US-listed market capitalization above $75 trillion, more than the next nine markets combined.
- ClaimThe Globalist (2025) — “the US accounts for more than half of world market capitalization for the first time ever,” the framing this page examines.
- A share is a relative measure. A rising US share can reflect US strength, weakness elsewhere, or both; it is not by itself a statement about US market valuation.
- World Bank coverage broadens over time. The world aggregate adds countries as their exchanges enter the dataset, inflating the US share in the earliest years; the series here begins in 1980, the pre-1998 span is flagged in the chart, and the central claim rests on the fully covered 1998 and 2001 crossings.
- Different universes give different numbers. Total market capitalization, float-adjusted index weight, and developed-world-only shares are not interchangeable; “record” can hold on one and fail on another.
- Annual data. The World Bank series is year-end; intra-year peaks are not captured, and 2026 figures from other trackers use different company universes than the World Bank.
Last updated — 15 September 2026
Disclaimer – Financial Information: The analyses, commentary, and content published on eco3min.fr are provided for informational and educational purposes only. They do not constitute investment advice or a solicitation to buy or sell financial instruments. Past performance is not indicative of future results. All investment decisions involve risk and are the sole responsibility of the reader.