
Buffett Indicator (Market Cap to GDP): US Corporate Equities Divided by GDP, Quarterly Since 1947
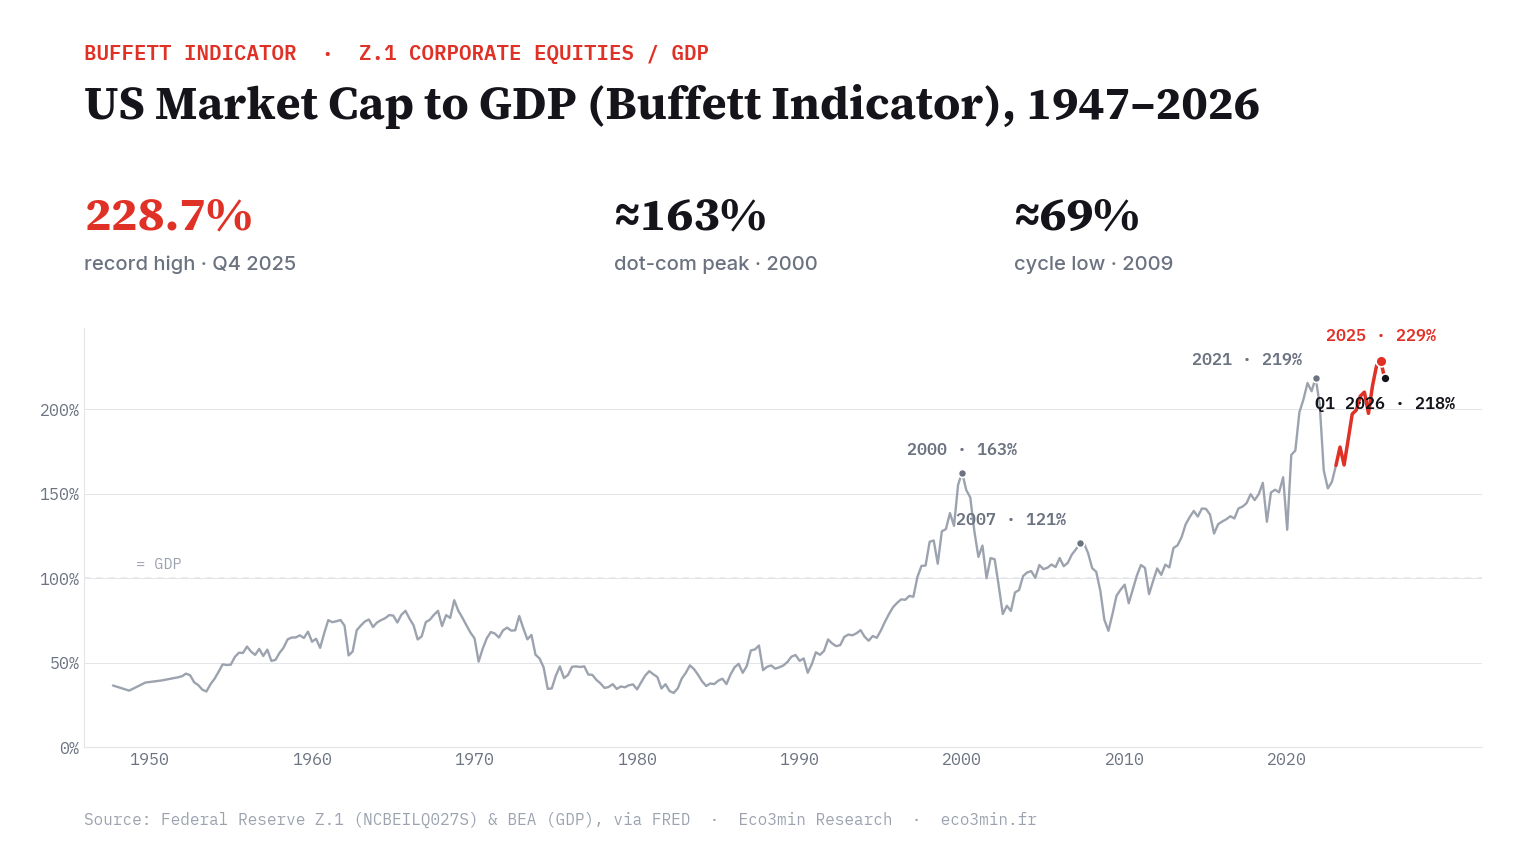
The Buffett Indicator — total US stock market capitalisation measured against the size of the economy — is one of the most-cited long-horizon equity valuation gauges. This Market Cap to GDP dataset is an Eco3min composite: the market value of US corporate equities from the Federal Reserve’s Z.1 Financial Accounts, divided by nominal GDP and expressed as a percentage. It uses the Z.1 corporate-equities numerator — the construction that reads highest among the published versions of the Buffett Indicator — aligned with GDP on the same quarter, so the ratio is never built from a current numerator over a lagged denominator. Coverage is quarterly from Q4 1947 to the present.
Quarterly, Q4 1947–Q1 2026 · Z.1 corporate equities ÷ nominal GDP.
Macro Takeaway
The Buffett Indicator sets aggregate US equity value against the economy that ultimately underpins corporate earnings. Because equity prices are far more volatile than nominal GDP, the ratio is driven mostly by the numerator over short horizons and tends to be read alongside other valuation gauges such as the CAPE ratio and against the wider monetary and liquidity backdrop. It is a level, not a turning-point signal: the same reading can persist for years.
Through 2023–2025 the ratio climbed to an all-time high near 229% in late 2025, before easing to about 218% in early 2026 — well above the dot-com peak of roughly 163% and the 2007 high near 121%, and close to the 2021 peak of about 219% — as US large-cap equities, led by a small group of technology names, outpaced nominal GDP. The denominator (GDP versus GNP) barely changes the level; the gap between published Buffett Indicator readings comes almost entirely from the numerator choice. Related discussion: our reference page on the drivers of equity market valuation.
Explore the Full Series
Hover or tap the chart for the exact ratio in any quarter since 1947. The grey line is the full record; the red segment marks the 2023–2026 run to the recent high and the pullback since.
Construction & Components
The Buffett Indicator isolates how large the US equity market has grown relative to the real economy. It is a single ratio of two quarterly series; the only modelling choices are which equity aggregate sits in the numerator and which output measure sits in the denominator. This dataset fixes one transparent, FRED-sourced construction.
Formula:
Market Cap to GDP = US Corporate Equities (Z.1) / Nominal GDP × 100
Components:
- US Corporate Equities — Federal Reserve Z.1 Financial Accounts, nonfinancial corporate business; corporate equities; liability, level (FRED
NCBEILQ027S) — quarterly. Market value of equity outstanding; the numerator. - US Nominal GDP — US Bureau of Economic Analysis (FRED
GDP) — quarterly, annualised (SAAR). The denominator.
Frequency reconciliation: Both series are quarterly. The composite pairs each quarter’s equities level with the same quarter’s GDP — no interpolation, and deliberately not the latest numerator over a lagged GDP, which would overstate recent readings.
Coverage: Q4 1947–present — the first quarter for which both series are available (quarterly GDP begins in 1947; the Z.1 equities series extends slightly earlier).
Dataset Overview
| Indicator | Market Cap to GDP — Buffett Indicator (Q4 1947–present) |
|---|---|
| Geography | United States |
| Frequency | Quarterly |
| Period | 1947–2026 |
| Variables | date, market_cap_gdp |
| Format | CSV |
| Sources | Federal Reserve Z.1 (corporate equities) · BEA (nominal GDP), via FRED |
| Latest observation | Q1 2026 — 218.5% |
Dataset Variables
The CSV file contains the following columns.
| Column | Type | Description |
|---|---|---|
date | Date (YYYY-MM-DD) | Observation date (quarter-end reference) |
market_cap_gdp | Float | US corporate equities (Z.1) divided by nominal GDP, in percent |
Column names match the CSV headers exactly.
Download the Dataset
Source FRED Series Used for This Composite
Both components are public FRED series. The composite can be reproduced from:
https://fred.stlouisfed.org/graph/fredgraph.csv?id=NCBEILQ027S
https://fred.stlouisfed.org/graph/fredgraph.csv?id=GDP
Direct CSV Access — Eco3min Structured Dataset
https://eco3min.fr/wp-content/uploads/2026/07/market-cap-to-gdp.csv
This URL returns the complete computed ratio in CSV format. It can be used directly in pandas, R, curl, or any data tool.
Using the Dataset in Python
import pandas as pd

url = "https://eco3min.fr/wp-content/uploads/2026/07/market-cap-to-gdp.csv"
df = pd.read_csv(url, parse_dates=["date"])

print(df.head())
print(df.describe())
Using the Dataset in R
library(readr)

url <- "https://eco3min.fr/wp-content/uploads/2026/07/market-cap-to-gdp.csv"
df <- read_csv(url)

head(df)
summary(df)
Both examples load the dataset directly from the URL — no download or API key required.
Methodology
Eco3min recomputes the ratio by an automated pipeline that pulls the Z.1 corporate-equities series and nominal GDP from the FRED API, aligns them on the concurrent quarter, and computes the percentage according to the formula in Construction & Components. The series is refreshed after each quarterly update.
The numerator is a market-value (mark-to-market) measure of corporate equity outstanding, not a count of shares; it therefore moves with prices as well as issuance. Because the Z.1 release and GDP are revised, the most recent quarters are provisional: Eco3min replaces the full CSV when upstream data are revised.
Data Quality & Provider Notes
Latency is set by the slower component. The Z.1 Financial Accounts are published roughly ten to eleven weeks after the quarter, so the latest ratio cannot be fresher than that release; GDP carries its own advance, second and third estimates.
Revisions propagate. When GDP is revised, or the Z.1 equity level is restated, every affected quarter of the ratio changes; Eco3min replaces the entire CSV on each release rather than appending.
There is no single canonical downloadable Buffett Indicator series. Third-party trackers each publish their own construction — some on the Z.1 corporate-equities numerator, others on the Wilshire 5000 market index, some over GNP rather than GDP — which is why their headline levels differ at the same date. This dataset fixes one transparent FRED-sourced construction; the next section sets out what that does and does not mean. On this point: the historical weight of US equities.
What This Index Captures (And What It Doesn’t)
The Buffett Indicator is a structural valuation level, not a market-timing tool. It is most informative over long horizons and across regimes.
What it captures:
- The size of the US equity market relative to domestic output, a broad proxy for how richly the market is priced against the economy.
- Multi-decade valuation regimes: the secular climb from below 100% before the late 1990s to repeated records since.
- A complement to earnings-based gauges — it cross-checks the CAPE ratio using market value over output rather than price over smoothed earnings.
What it does NOT capture (common misinterpretations):
- There is no single “Buffett Indicator” number. The level depends on the numerator (Z.1 corporate equities versus the Wilshire 5000) and the denominator (GDP versus GNP). This dataset uses Z.1 corporate equities over GDP, the construction that reads highest. At the same date, published readings span roughly 200% to 235% depending on construction; the GDP-versus-GNP choice barely moves the level, while the numerator choice accounts for most of the spread.
- It is not a market-timing signal. The ratio has stayed historically elevated for years at a stretch without dating a top. It is a coincident level, not a leading indicator, and over short horizons it correlates poorly with subsequent returns.
- The level drifts upward over decades. Readings since the mid-1990s sit structurally above the 1950–1995 range. Proposed reasons include foreign earnings of US multinationals that GDP does not capture and a higher structural profitability and concentration of US firms, so part of any “record” reflects this secular drift rather than valuation alone.
- The denominator is domestic while the index is global. US-listed companies earn a large share of revenue abroad, which GDP — a measure of domestic output — does not reflect, biasing the ratio upward for an increasingly international market.
It is most useful as a long-horizon valuation-level reference and regime marker, read alongside other indicators — not as a tactical allocation trigger.
Historical Regimes
Pre-1995 — Below the economy. For four decades the ratio sat well under 100%, ranging from about 32% to a high near 87% in 1968, with equity value below annual output. Lower household equity participation, higher interest rates and the absence of a structural technology-margin premium kept the market modest relative to GDP. Participation, rates and margins are the same three forces that run through the equity markets and ETFs pillar on structure, valuations and cycles.
Dot-com bubble (late 1990s–2000). The ratio crossed above 100% for the first time in 1997 and peaked near 163% at the 2000 market top, then fell sharply through the 2001–2002 bear market as equity prices corrected faster than GDP.
Housing-cycle peak (2007). A secondary high near 121% in 2007 preceded the 2008 financial crisis, which drove the ratio to a cyclical trough near 69% in 2009 as market capitalisation collapsed.
Zero-rate era and the everything bubble (2010s–2021). Across the zero-rate decade the ratio trended steadily higher and reached a new high near 219% in late 2021, before a 2022 drawdown alongside rising rates.
AI and concentration (2023–2026). The ratio recovered and set fresh all-time highs, peaking near 229% in late 2025 — above the 2021 high — before easing to about 218% by early 2026, driven by mega-cap technology leadership and a narrow market; this coincided with extreme readings on the CAPE ratio.
Related Macroeconomic Datasets
- S&P 500 CAPE Ratio — the earnings-based valuation gauge that cross-checks this one
- Excess CAPE Yield
- M2 to GDP Ratio
- Fed Balance Sheet to GDP Ratio
- US Corporate Debt to GDP
Related Research
Sources
- US corporate equities — Federal Reserve, Z.1 Financial Accounts of the United States (nonfinancial corporate business; corporate equities; liability), via FRED series NCBEILQ027S.
- US nominal GDP — US Bureau of Economic Analysis, via FRED series GDP.
- Concept origin — Warren Buffett, Fortune (2001), where the market-cap-to-GDP ratio was described as a broad measure of equity valuation.
Dataset Reference
Last updated — 21 September 2026
Disclaimer – Financial Information: The analyses, commentary, and content published on eco3min.fr are provided for informational and educational purposes only. They do not constitute investment advice or a solicitation to buy or sell financial instruments. Past performance is not indicative of future results. All investment decisions involve risk and are the sole responsibility of the reader.