
2-year vs 10-year breakeven inflation, 1999–2026: a front end that ranged from −4.9% to +4.9%
Since 1999, the US 2-year inflation breakeven has ranged from −4.9% to +4.9%. The 10-year never left 0.2% to 3.0%.
The front end swings, the long end holds: 2-year and 10-year breakevens, daily since 1999
The 2-year point of the Federal Reserve Board’s fitted breakeven curve fell to −4.89% on December 10, 2008 and reached 4.89% on March 25, 2022. Over the same 6,918 trading days the 10-year point stayed between 0.17% and 3.00%. The lower panel is their spread, positive when the front end prices more inflation than the long end.

Source: Board of Governors of the Federal Reserve System, TIPS yield curve and inflation compensation (Gürkaynak, Sack and Wright), zero-coupon inflation compensation at 2 and 10 years. Chart: Eco3min Research.
A daily file of the Board’s fitted breakeven curve from 2 to 20 years since January 1999, the spread between its shortest and its 10-year point, every run of days on which the short end priced more inflation than the long end, and the record of what the 2-year point was followed by.
The 2-year vs 10-year breakeven inflation spread is the difference between the inflation compensation priced into 2-year and 10-year US Treasury securities, read here from the daily fitted curve published by the Federal Reserve Board. This page publishes that spread from January 4, 1999 to September 11, 2026, together with the full curve from 2 to 20 years, and documents its 23 runs of at least 20 consecutive trading days above zero. The longest, from January 7, 2021 to September 23, 2022, lasted 431 trading days and peaked at +1.94 percentage points on March 24, 2022. The second longest, from December 20, 2024 to November 20, 2025, lasted 229. The page also records the amplitude of each point of the curve: over the sample the 2-year breakeven moved through 9.78 percentage points and the 10-year through 2.83.
TL;DR
Since 1999, the US 2-year inflation breakeven has ranged from −4.9% to +4.9%. The 10-year never left 0.2% to 3.0%.
- The 2-year point of the Board’s breakeven curve read −4.89% on December 10, 2008 and 4.89% on March 25, 2022. The 10-year point read 0.17% on November 21, 2008 and 3.00% on April 21, 2022. Day to day, the 2-year moves with 3.9 times the standard deviation of the 10-year.
- The front end priced more inflation than the long end on 431 consecutive trading days from January 7, 2021 to September 23, 2022, the longest of the 23 runs in the record. It happened again for 229 days from December 20, 2024 to November 20, 2025, the second longest. Since January 2021 the 2-year has been above the 10-year on 69.9% of days, against 6.7% in 2009–2020.
- Robustness, disclosed: the fitted 2-year point rests on few securities before 2004. Both extremes of the headline are dated after 2004, and every ranking on this page is unchanged when the sample starts in 2004. Excluding the TIPS dysfunction window of September 2008 to March 2009, the 2-year still spans −0.68% to 4.89% and the 10-year 0.46% to 3.00%.
- A breakeven is not an expectation. The 2-year point contains the next known CPI prints, a liquidity discount on TIPS and an inflation risk premium; the −4.89% of December 2008 was followed by realized inflation of 2.11% a year over the next two years. The page measures what the curve recorded, and says so where it matters.
Scope: this page reads one fitted curve, published by the Board as a staff research product, and compares its points to each other and to realized CPI. It contains no forecast and no signal. Method in the methodology, reservations in the limitations.
Latest observation
2-year breakeven
2.32%
September 11, 2026, Board fitted curve
10-year breakeven
2.36%
same day, same curve
2-year minus 10-year
−0.04 pp
flat regime, 64.5th percentile of its own history
Days since the last inversion run
61
the 109-day run of 2026 ended on June 15, 2026
The 5-year point reads 2.41% and the 20-year 2.37%. The rolling 252-day ratio of the daily volatility of the 2-year to that of the 10-year is 2.14. The Board posts the curve every Tuesday for the week ending the previous Friday; this release stops at September 11, 2026. Updated monthly.
Summary
Six findings
- Since 1999, the US 2-year inflation breakeven has ranged from −4.9% to +4.9%. The 10-year never left 0.2% to 3.0%. On the same 6,918 trading days, the width of the 2-year range is 3.46 times the width of the 10-year range.
- The amplitude is a property of maturity, not of one episode. Every point from 2 to 9 years has its record low in 2008 and its record high in March or April 2022; the 20-year point has its low in 2008 and its high on May 19, 2004. The width of the range falls from 9.78 percentage points at 2 years to 5.30 at 5 years, 2.83 at 10 years and 2.56 at 20 years.
- The inversion of 2021–2022 is dated to the day: the 2-year point stayed above the 10-year point from January 7, 2021 to September 23, 2022, 431 trading days, a run 1.88 times longer than the next one. At its peak on March 24, 2022 the spread was +1.94 percentage points, with the 2-year at 4.87% and the 10-year at 2.93%.
- The curve did not simply normalize. After 2022 the front end went back above the long end for 229 trading days from December 20, 2024 to November 20, 2025, the second-longest run of the record, peaking at +0.64 on April 3, 2025, and again for 109 days from January 9 to June 15, 2026. Eight of the 23 runs started in 2021 or later; 2009–2015 contains none, on 1,752 trading days.
- The 2-year point has been a poor guide to the inflation that followed it. Over the 6,391 days with two years of subsequent CPI, the median gap between the 2-year breakeven and realized two-year inflation is −0.52 percentage points, and the gap reached −7.00 on December 10, 2008 and +3.19 on July 3, 2008. The 10-year point, on 4,391 days with ten years of data, has a median gap of −0.10.
- The file behind this page carries the Board’s fitted breakeven at each of the 19 maturities from 2 to 20 years, the 2–10 and 5–10 spreads, the regime label, the episode identifier and its day count, the rolling volatility ratio, the NBER recession flag, WTI, realized CPI at two and ten years and the forward change of the spread. CC BY 4.0.
The record in six numbers
−4.89%
lowest 2-year breakeven, December 10, 2008
4.89%
highest 2-year breakeven, March 25, 2022
0.17% to 3.00%
the entire range of the 10-year breakeven since 1999
431
consecutive trading days with the 2-year above the 10-year, January 2021 to September 2022
3.9×
daily volatility of the 2-year point relative to the 10-year, full sample
69.9%
of trading days since January 2021 with the 2-year above the 10-year
What the inversion story says
The standard account of US inflation pricing since 2021 runs as follows. When inflation surged, the market priced most of it into the near term: short-dated breakevens rose far above long-dated ones, the term structure of inflation compensation inverted, and that inversion was read as evidence that investors saw the shock as temporary and long-run expectations as anchored. As inflation fell back, the story continues, the curve normalized. Eco3min’s own 5-year vs 10-year breakeven page documents the monthly version of that reversal, 45 inverted months out of 61 since April 2021 after a decade with none, and this page does not repeat those counts.
The account is consistent with the data at 5 years. It is also the reason a reader searches for the 1-year or 2-year point against the 10-year: the shorter the maturity, the larger the swing, and the more visible the episode. That instinct is right, and this page follows it to the shortest point the Board’s curve provides, 2 years, on every trading day since January 1999. What it finds is that the episode of 2021–2022 is the largest example of a general property of the front end, that the property is symmetric, and that the normalization was not the end of the story.
Two facts from the file frame everything below. First, the 2-year point moved through 9.78 percentage points between its low and its high, and the 10-year through 2.83. Second, the 2-year point was above the 10-year on 2,225 of 6,918 trading days, 32.2% of the sample, and those days cluster into runs: 23 of them lasted at least 20 consecutive trading days, 7 of them at least 100.
What this dataset does not measure
The series are inflation compensation, the rate of inflation at which a nominal Treasury and a TIPS of the same maturity would return the same amount, read from a smoothed curve fitted by Board staff to the outstanding TIPS. The Board’s own file header states that these rates incorporate inflation risk premiums and the effects of the differential liquidity of TIPS and nominal securities, and should not be interpreted as estimates of inflation expectations. Nothing on this page is a survey, a forecast, or a policy rate. A concrete example of the gap between compensation and expectation: on December 10, 2008 the 2-year point read −4.89%; the CPI-U rose 2.11% a year over the following two years. Survey measures of one-year expectations exist, from the University of Michigan and the New York Fed’s Survey of Consumer Expectations, and are not in this file.
Where the shocks land
The standard deviation of the daily change in the 2-year point is 0.1447 percentage points over the sample; that of the 10-year is 0.0372. The ratio is 3.89. It is inflated by the first years of the sample and by late 2008: from 2004 onward it is 1.62, and the median of the rolling 252-day ratio published in the file is 1.64, with a low of 1.02 and a high of 10.63. On no 252-day window of the record has the 10-year point been more volatile than the 2-year point.
The ranges tell the same thing with dates attached. The 2-year point went from −0.68% on March 19, 2020 to 4.89% on March 25, 2022, a swing of 5.57 percentage points in two years. The 10-year point went from 0.46% to 2.96% on the same two days, 2.50 points, and reached its record 3.00% on April 21, 2022. The 2-year has closed above 4% on 58 trading days of the record, 57 of them in 2022; the 10-year has closed above 3% on exactly one. The 2-year has closed below zero on 206 days, 86 of them outside the dysfunction window of late 2008; the 10-year has closed below 1% on 63 days and never below zero.
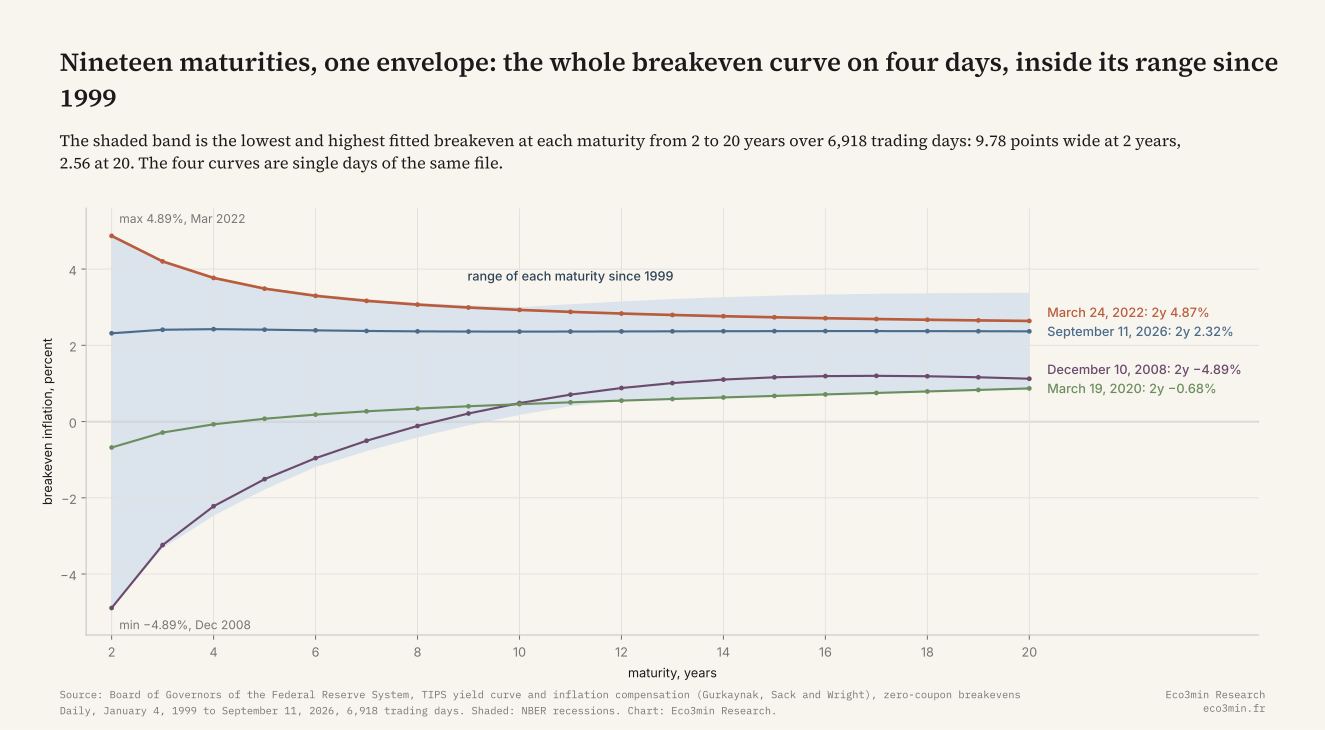
Nineteen maturities, one envelope: the whole breakeven curve on four days, inside its range since 1999
The shaded band is the lowest and highest fitted breakeven at each maturity from 2 to 20 years over 6,918 trading days. It is 9.78 points wide at 2 years and 2.56 at 20. The four curves are December 10, 2008, March 19, 2020, March 24, 2022 and September 11, 2026.
Source: Federal Reserve Board, TIPS yield curve and inflation compensation, zero-coupon breakevens at 2 to 20 years. Chart: Eco3min Research.
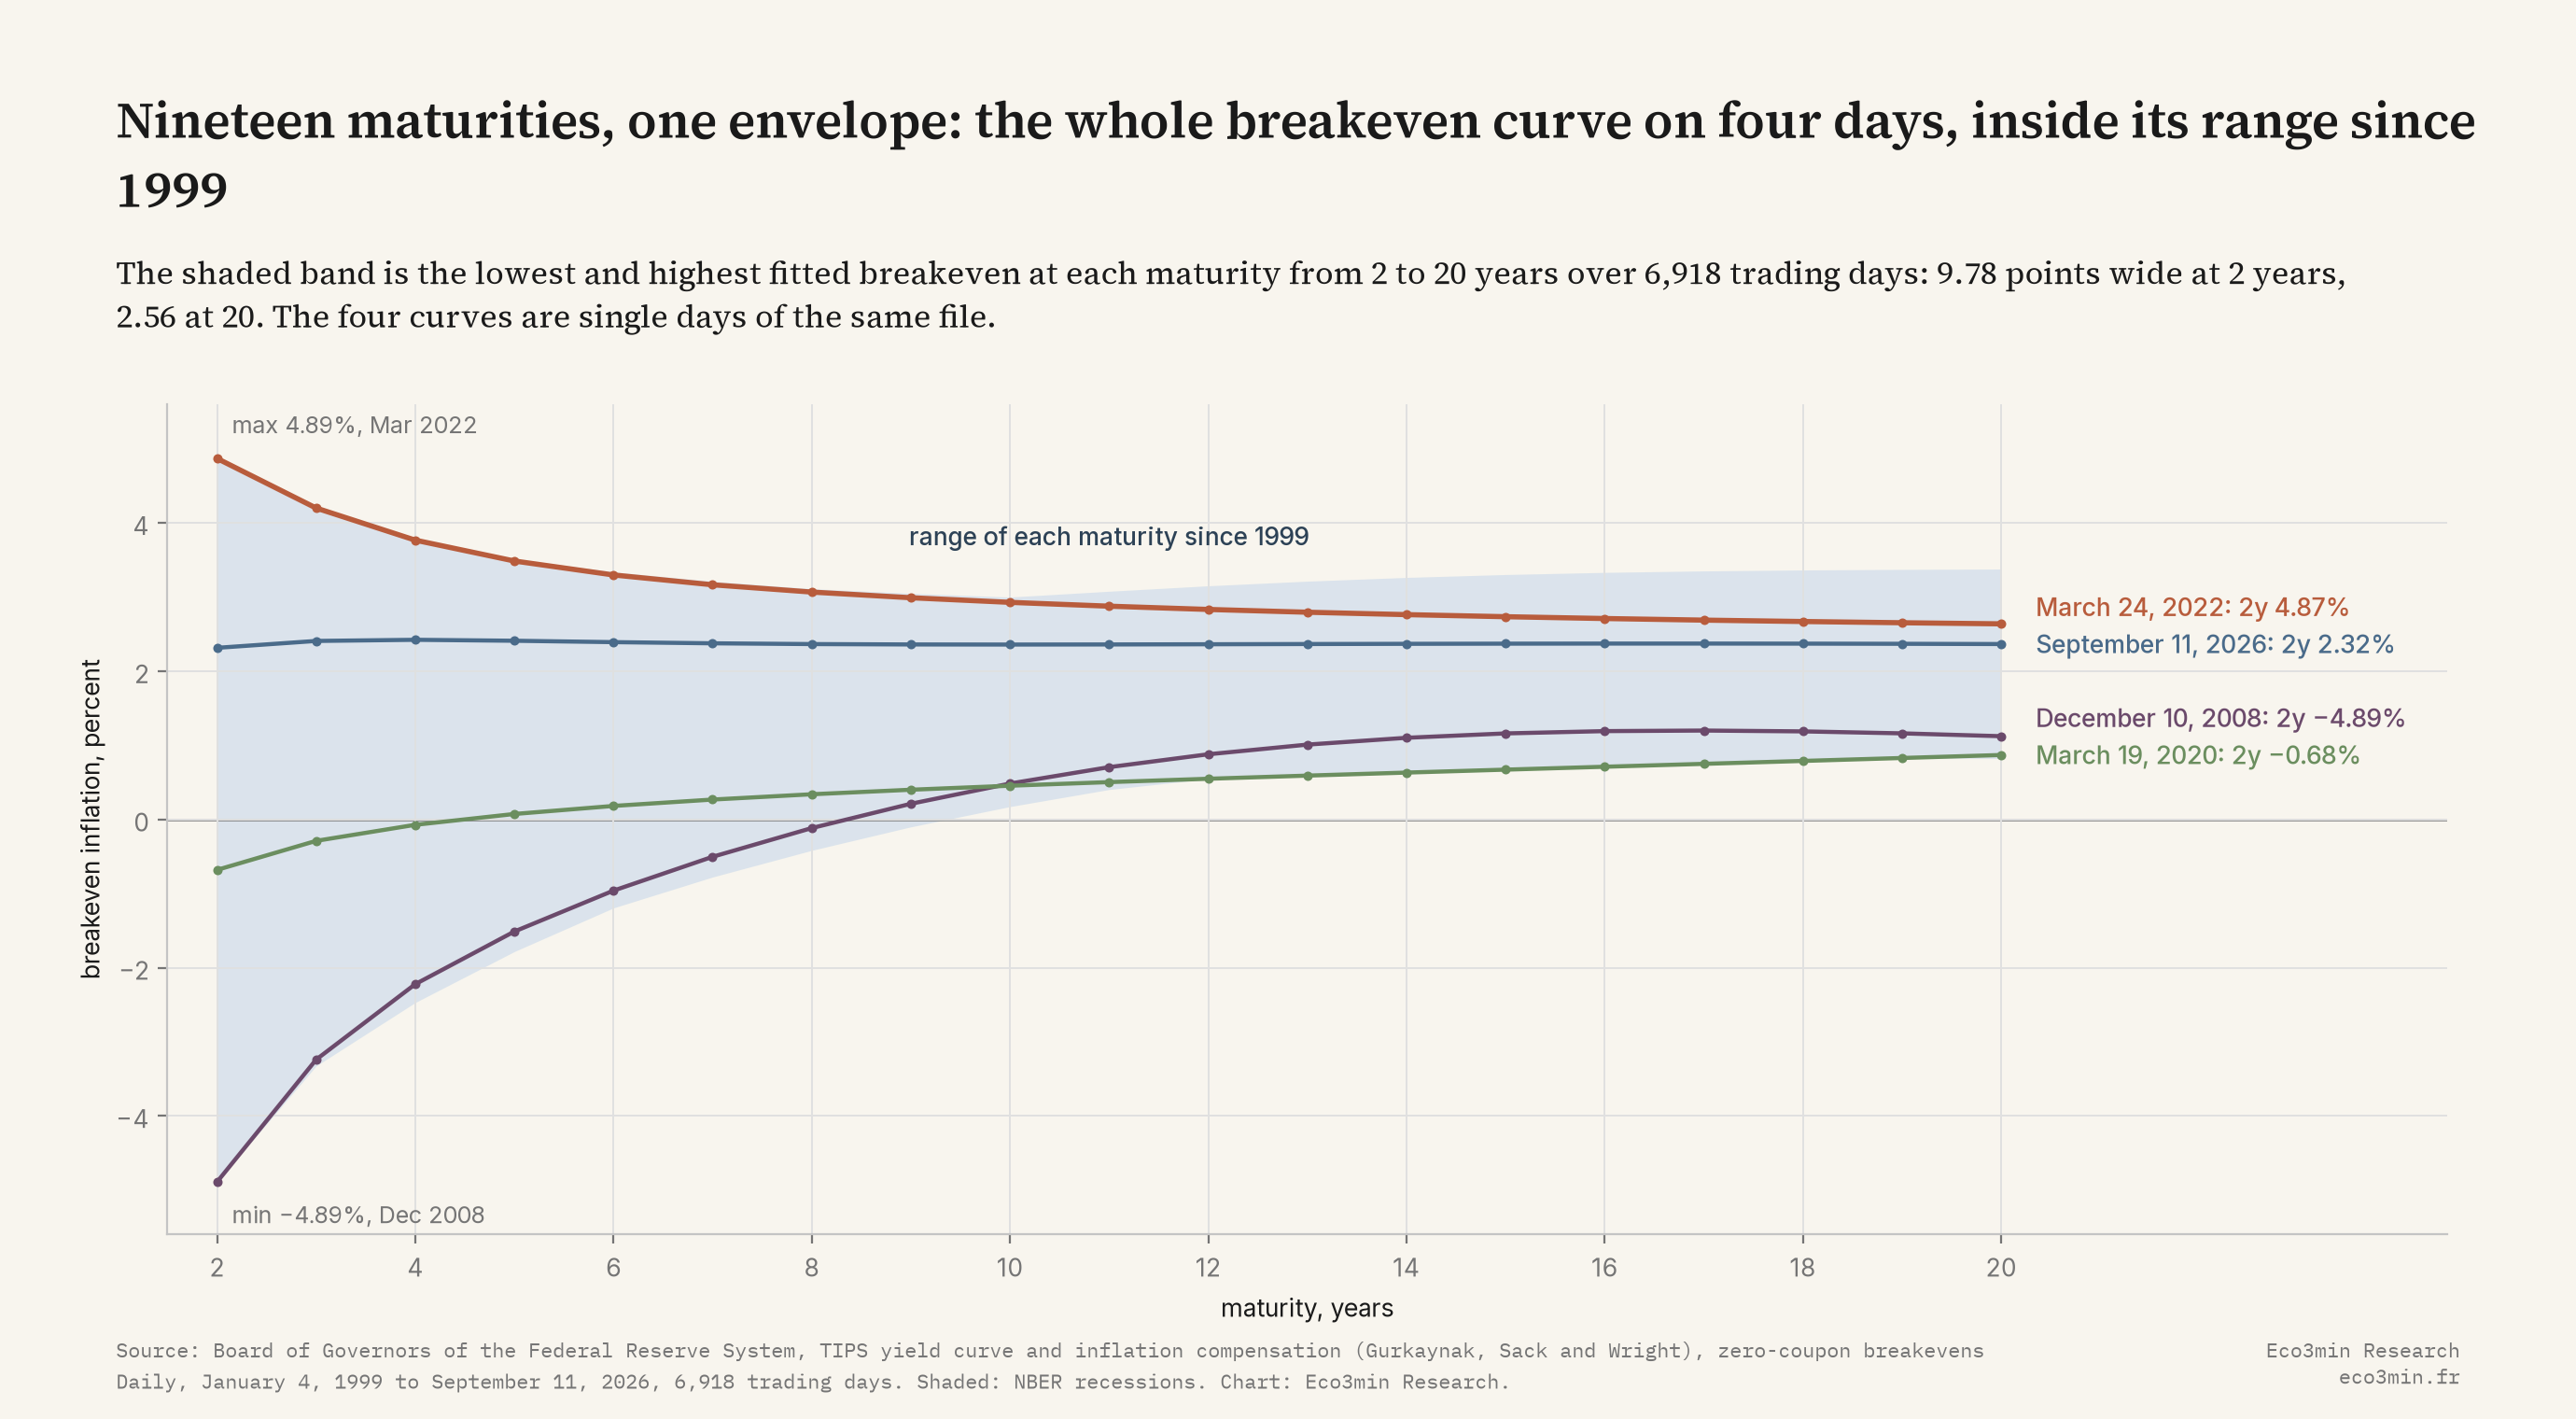
The envelope narrows monotonically with maturity. The width of the range is 9.78 percentage points at 2 years, 7.53 at 3, 5.30 at 5, 2.83 at 10 and 2.56 at 20. Eleven of the 19 maturities have their record low in 2008 and the other 8, from 12 to 19 years, on March 19, 2020. Six maturities between 2 and 8 years have their record high on March 25, 2022, the 3-year point having set its own two days earlier, and 10 maturities, from 11 to 20 years, on May 19, 2004. The two shocks of the sample, the deflation scare of late 2008 and the inflation of 2022, both landed on the short end; the long end’s record high belongs to a quieter year. Two shocks, two regimes: that is the distinction the regime reading of inflation, beyond the monthly print turns on.
Takeaway
The front end absorbs the shock; the long end records the anchor. That is what the envelope shows, and it holds in both directions: the point that reached 4.89% in 2022 is the same one that reached −4.89% in 2008.
Every inversion since 1999, dated
An inversion run, in this file, is a maximal stretch of consecutive trading days on which the 2-year point exceeds the 10-year point, counted as an episode when it lasts at least 20 trading days. There are 23 such runs. The first began on January 19, 2000 and the most recent ended on June 15, 2026. Seven of them started before 2004, 8 between 2004 and 2020, and 8 in 2021 or later.
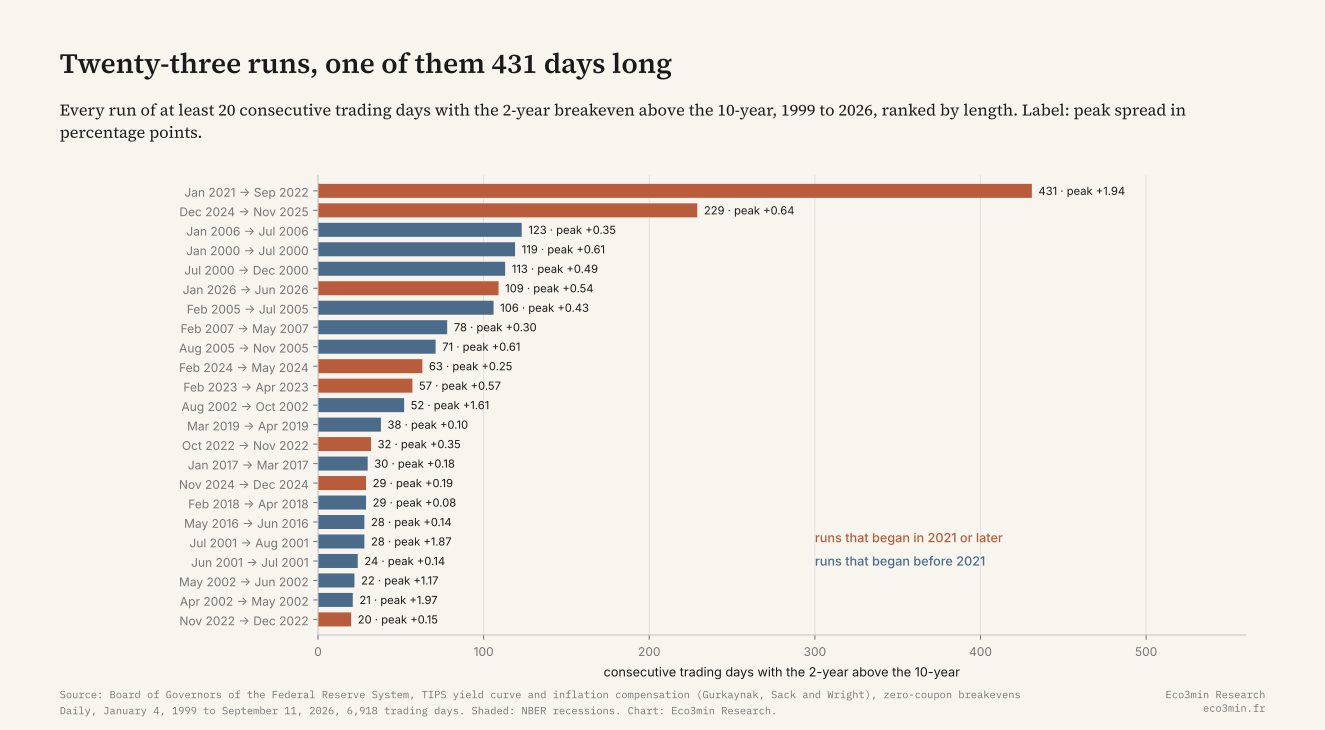
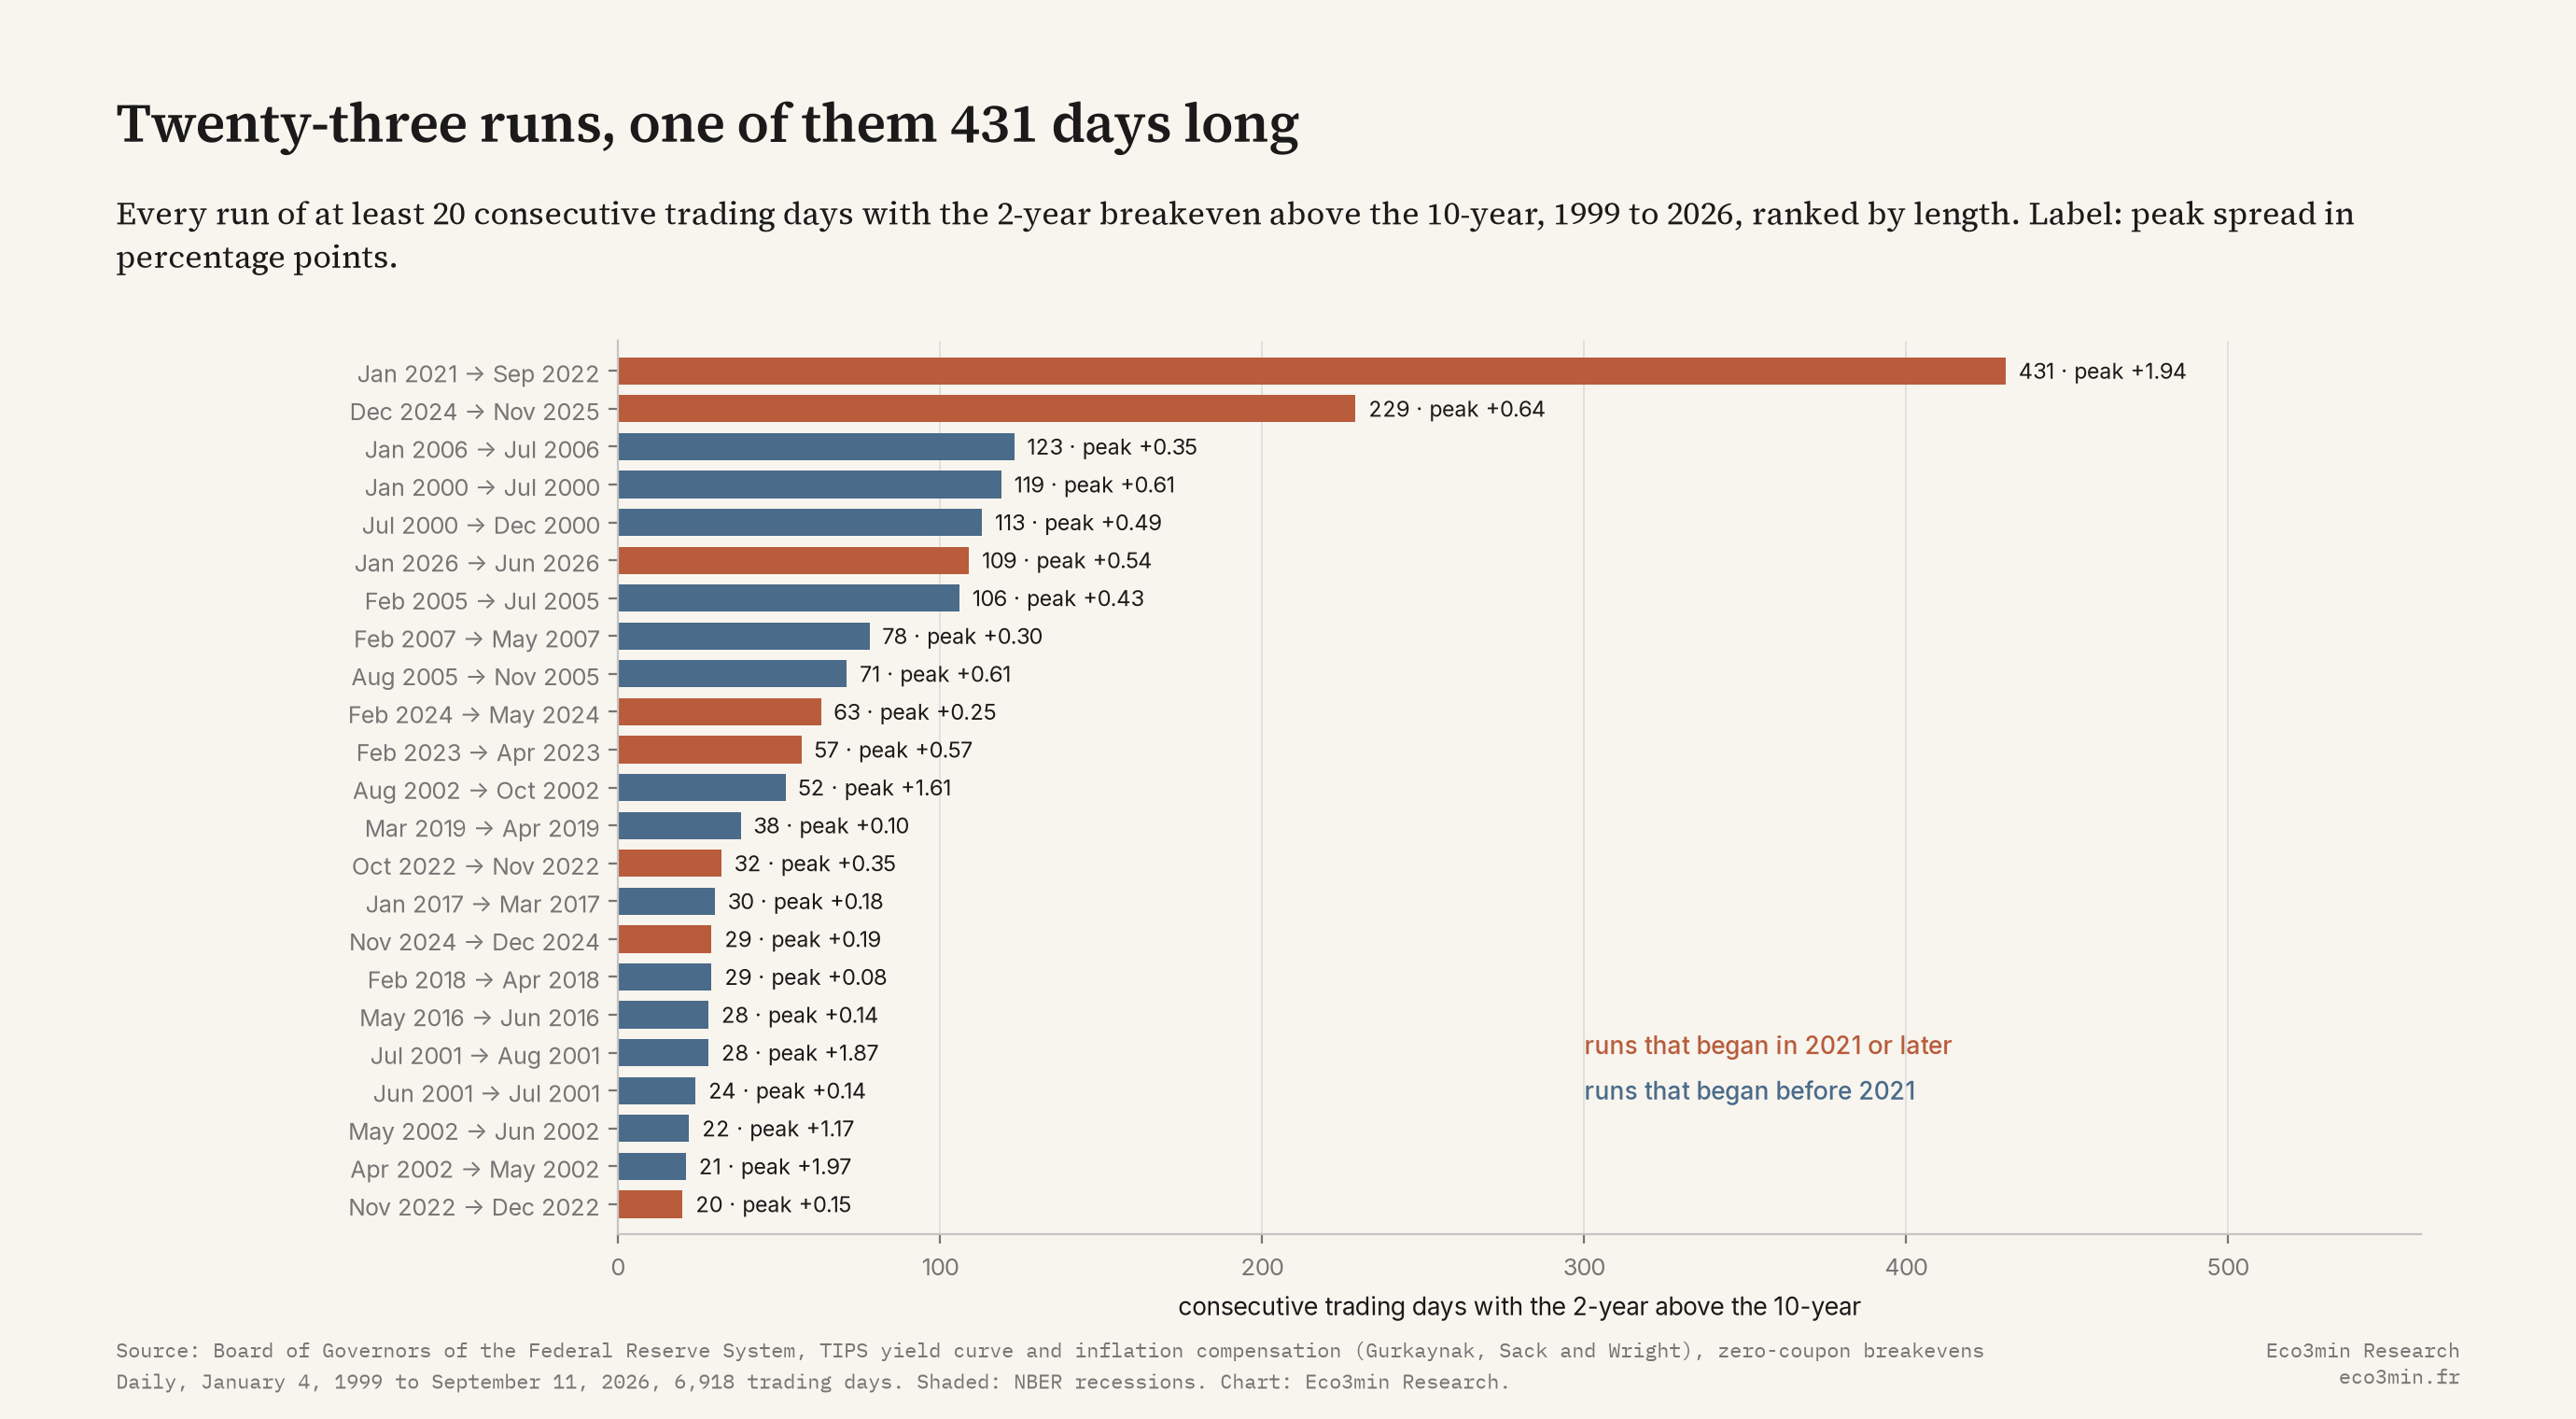
The run that began on January 7, 2021, with the 2-year at 2.11% and the 10-year at 2.06%, ended on September 23, 2022 with the spread at +0.03 points. It lasted 431 trading days, 624 calendar days, and its peak of +1.94 points on March 24, 2022 is the highest reading of the spread since 2004. The next-longest run, 229 trading days from December 20, 2024 to November 20, 2025, peaked at +0.64 on April 3, 2025 with the 2-year at 2.97% and the 10-year at 2.32%. Third comes the 123-day run of the first half of 2006, at +0.35. The 2021–2022 run is 1.88 times as long as the second and 3.50 times as long as the third.
The share of days with the front end above the long end is the simplest summary. It was 49.8% in 1999–2003, 40.3% in 2004–2007, 1.8% in 2008–2009, 8.0% in 2010–2019, 0.0% in 2020, 97.4% in 2021–2022 and 55.0% from 2023 to September 2026. On the 1,752 trading days from 2009 to 2015 the 2-year point never once closed above the 10-year. On the 1,424 trading days since January 2021 it did so on 995, 69.9%.
Twenty-three runs, one of them 431 days long
Every run of at least 20 consecutive trading days with the 2-year breakeven above the 10-year, 1999 to 2026, ranked by length. The three runs that began in 2021 and later fill three of the top six places.
Source: Federal Reserve Board, TIPS yield curve and inflation compensation. Chart: Eco3min Research.
Takeaway
The 2021–2022 inversion was not unprecedented in kind: the front end had been above the long end on 22.4% of trading days before 2021. It was unprecedented in length, and the curve has since inverted again for the second-longest run of the record.
What a 2-year breakeven contains
The strongest objection to reading the front end as a gauge of near-term inflation views is that a 2-year breakeven contains at least four things besides a view. It contains the CPI prints already published and those nearly known, because TIPS principal is indexed with a lag and the next few months of inflation are largely mechanical. It contains a discount for the relative illiquidity of TIPS, which D’Amico, Kim and Wei estimate to have been large in the early years of the market and to have spiked in 2008, and which Andreasen, Christensen and Riddell find to be time-varying and to have surged again in March 2020. It contains a premium for inflation risk, and it contains seasonality in the CPI itself. The Board’s own header on the file says as much.
The file quantifies how far compensation and outcome have diverged at the front end. On December 10, 2008 the 2-year point read −4.89% while WTI crude traded at $43.10; the CPI-U then rose 2.11% a year over the next two years, a gap of −7.00 points, the largest of the record. On March 19, 2020 it read −0.68%, with WTI at $25.09; realized two-year inflation was 5.54% a year, a gap of −6.22 points. On July 3, 2008, with WTI at $145.31, the 2-year read 2.74% and the next two years delivered −0.44% a year, a gap of +3.19 points, the largest overestimate. The −4.89% of 2008 was not a view that prices would fall 4.9% a year: it was the arithmetic of collapsing energy prices, a lagged index and a market in which the TIPS Treasury basis widened by several points.
Two things survive the objection. The first is that the same components exist at 10 years, in smaller size, so the comparison between maturities is a comparison of like with like; the amplitude gap is real whatever it is made of. The second is that the 2-year point co-moves with oil about as much as the 10-year does: the correlation of 63-day changes with the log change in WTI is 0.60 for the 2-year and 0.64 for the 10-year, and 0.46 against 0.45 at 21 days. The front end is not an oil gauge that the long end is not. And the mechanism that a targeting regime is meant to produce shows in the numbers: at the worst of 2022 the 10-year point was 3.00%, and it has spent one trading day above 3% in 27 years, against 58 days above 4% for the 2-year.
Takeaway
A 2-year breakeven is a price, not a poll. The page reports the amplitude of that price and the outcomes that followed it, and leaves the decomposition to the papers cited in the sources.
Pick any day, see the whole curve
The prose above quotes four days. The file has 6,918, and on each of them the Board publishes the fitted breakeven at 19 maturities. The module below draws the 2–10 spread across the whole record as a navigator; pointing at any date, or moving with the arrow keys, redraws the full curve from 2 to 20 years on that day, over a pinned reference curve that is March 24, 2022 by default and can be replaced with any date by a click. Every point shown is a cell of the published file; nothing is interpolated or recomputed.
The module reads the published CSV directly. If it does not load, the envelope chart above is the static equivalent of its default view.
What the 2-year point was followed by
The natural benchmark for a 2-year breakeven is the inflation realized over the two years after it was priced. The table classifies each trading day by the regime of the 2–10 spread that day, inverted above +0.10 points, normal below −0.10, flat in between, the band used on the 5-year vs 10-year page, and reports the median 2-year breakeven, the median annualized CPI-U inflation over the next 24 months, and the gap between the two, on the 6,391 days with a complete window, through August 30, 2024. It also reports the median change of the spread itself over the next 252 trading days.
| Regime that day | Days | Days with two years of CPI | Median 2-year breakeven | Median realized inflation, next 2 years | Median gap | P25 to P75 of the gap | Share overestimating | Median change of the spread, next 252 days |
|---|---|---|---|---|---|---|---|---|
| Inverted, spread above +0.10 | 1,708 | 1,390 | 2.70% | 2.93% | −0.15 pp | −0.74 to +0.27 | 43.5% | −0.28 pp |
| Flat, within ±0.10 | 1,095 | 999 | 2.13% | 2.34% | −0.41 pp | −0.81 to −0.04 | 24.1% | −0.09 pp |
| Normal, spread below −0.10 | 4,115 | 4,002 | 1.55% | 2.19% | −0.76 pp | −1.60 to +0.18 | 29.6% | +0.21 pp |
| All days | 6,918 | 6,391 | −0.52 pp | 31.7% |
In every regime the median 2-year breakeven undershot the inflation that followed, by the most when the curve was in its normal shape. The inverted rows carry the years 2021 and 2022, when the 2-year point rose above 4% and inflation subsequently ran at 4.23% a year from March 2022, so the gap there is the smallest. Consecutive days share almost all of their forward window, so the 1,390 inverted days are far fewer independent observations than the count suggests. The 10-year point, on the 4,391 days through August 31, 2016 with ten years of subsequent data, has a median gap of −0.10 points and a mean absolute gap of 0.61, against 1.17 for the 2-year over its own horizon.
Past distributions are not predictive of future outcomes. Regime-conditional statistics describe historical patterns, not expected returns or expected inflation.
Levels to watch
The spread
At −0.04 points on September 11, 2026 the 2–10 spread is in the flat band, 61 trading days after the end of the 109-day run of the first half of 2026. If it moved above +0.10 and the 2-year stayed above the 10-year for 20 consecutive trading days, the file would register a 24th episode. Inside the 23 episodes so far, the median change of the spread over the following 252 trading days was −0.25 points on 1,693 days.
The normal shape
A spread below −0.10 points is the normal regime of the file, held on 4,115 of 6,918 days, 59.5%. It was the state of every trading day from 2009 to 2015. A return there would put the curve back in the configuration that prevailed on 8.0% of days in 2010–2019.
The 2-year level
At 2.32% the 2-year point is above its full-sample median of 1.94% and below the 2.97% it reached on April 3, 2025. Readings above 4% have occurred on 58 trading days of the record, 57 of them in 2022.
The next data points
The Bureau of Labor Statistics publishes the CPI-U monthly on a preannounced calendar; each release moves the carry embedded in the 2-year point. The Board updates the curve every Tuesday for the week ending the previous Friday.
Era and episode tables
The era table cuts the sample on round dates, with 2008–2009 and 2020 isolated because they contain the two record lows. It reports how often the front end was above the long end, the ratio of the daily volatility of the two points, and the range of each.
| Era | Trading days | Share of days with 2-year above 10-year | Volatility ratio, 2-year to 10-year | 2-year range | 10-year range | Median spread | Episodes starting |
|---|---|---|---|---|---|---|---|
| 1999 to 2003 | 1,241 | 49.8% | 6.55 | 0.06% to 4.22% | 1.11% to 2.66% | 0.00 pp | 7 |
| 2004 to 2007 | 999 | 40.3% | 1.84 | 1.44% to 3.22% | 2.28% to 3.00% | −0.09 pp | 4 |
| 2008 to 2009 | 502 | 1.8% | 1.84 | −4.89% to 2.74% | 0.17% to 2.82% | −1.61 pp | 0 |
| 2010 to 2019 | 2,501 | 8.0% | 1.40 | 0.42% to 2.67% | 1.18% to 2.79% | −0.43 pp | 4 |
| 2020 | 251 | 0.0% | 1.32 | −0.68% to 1.87% | 0.46% to 1.96% | −0.32 pp | 0 |
| 2021 to 2022 | 500 | 97.4% | 1.61 | 1.90% to 4.89% | 1.98% to 3.00% | +0.45 pp | 3 |
| 2023 to September 2026 | 924 | 55.0% | 1.59 | 1.61% to 3.06% | 2.00% to 2.56% | +0.04 pp | 5 |
The episode table lists the twelve longest runs. The first run of 2002, 52 days peaking at +1.61 points, and the three runs of 2001–2002 further down the list belong to the years when the fitted 2-year point rested on very few securities; they are reported, not removed.
| Rank | Start | End | Trading days | Peak spread | Date of peak | Highest 2-year breakeven in the run |
|---|---|---|---|---|---|---|
| 1 | January 7, 2021 | September 23, 2022 | 431 | +1.94 pp | March 24, 2022 | 4.89% |
| 2 | December 20, 2024 | November 20, 2025 | 229 | +0.64 pp | April 3, 2025 | 2.97% |
| 3 | January 27, 2006 | July 24, 2006 | 123 | +0.35 pp | April 21, 2006 | 3.04% |
| 4 | January 19, 2000 | July 7, 2000 | 119 | +0.61 pp | April 28, 2000 | 2.99% |
| 5 | July 11, 2000 | December 19, 2000 | 113 | +0.49 pp | August 18, 2000 | 2.52% |
| 6 | January 9, 2026 | June 15, 2026 | 109 | +0.54 pp | March 20, 2026 | 2.99% |
| 7 | February 10, 2005 | July 15, 2005 | 106 | +0.43 pp | April 25, 2005 | 3.14% |
| 8 | February 2, 2007 | May 23, 2007 | 78 | +0.30 pp | March 30, 2007 | 2.78% |
| 9 | August 1, 2005 | November 9, 2005 | 71 | +0.615 pp | October 3, 2005 | 3.22% |
| 10 | February 13, 2024 | May 13, 2024 | 63 | +0.25 pp | April 17, 2024 | 2.65% |
| 11 | February 3, 2023 | April 25, 2023 | 57 | +0.57 pp | March 6, 2023 | 3.06% |
| 12 | August 14, 2002 | October 28, 2002 | 52 | +1.61 pp | October 16, 2002 | 3.48% |
Historical turning points
Seven days, each looked up on its own row of the file, plus the current observation.
April 5, 2002, the highest spread of the record, with a caveat. The 2-year point read 4.22% and the 10-year 2.25%, a spread of +1.97 points, on a day when WTI traded at $26.21. The 2-year point in 2001–2002 was fitted on very few outstanding TIPS, and the 36 days on which the spread exceeded one point before 2004 are the reason every ranking on this page is also reported from 2004 onward, where the highest spread is the +1.94 of March 24, 2022.
July 3, 2008, the largest overestimate. With WTI at $145.31, the 2-year point read 2.74%. The CPI-U then fell 0.44% a year over the next two years, a gap of +3.19 points between what the front end priced and what arrived, the widest positive gap of the record.
December 10, 2008, the lowest 2-year breakeven and the lowest spread. The 2-year point read −4.89%, the 5-year −1.51%, the 10-year 0.48% and the 20-year 1.12%, a 2–10 spread of −5.38 points. WTI traded at $43.10. Realized inflation over the next two years was 2.11% a year. The 10-year point had reached its own record low of 0.17% on November 21, 2008, three weeks earlier.
March 19, 2020, the lowest 2-year breakeven outside the dysfunction window. −0.68%, with the 10-year at 0.46% and WTI at $25.09; 8 of the 19 maturities, from 12 to 19 years, set their record low that day. Realized inflation over the next two years was 5.54% a year, a gap of −6.22 points.
January 7, 2021, the first day of the longest run. The 2-year point crossed above the 10-year, 2.11% against 2.06%, a spread of +0.05 points, and stayed above it for 431 trading days. Inflation over the next two years ran at 6.94% a year.
March 24 and 25, 2022, the peak. The spread reached +1.94 points on March 24, with the 2-year at 4.87% and the 10-year at 2.93%; the 2-year set its record 4.89% the next day, with the 5-year at 3.52% and the 10-year at 2.96%. WTI traded at $116.20 on March 25. Inflation over the next two years ran at 4.23% a year, so the 2-year point overshot by 0.66 points. Six maturities between 2 and 8 years set their record high on March 25; the 10-year set its own, 3.00%, on April 21.
April 3, 2025, the peak of the second-longest run. The spread reached +0.64 points, with the 2-year at 2.97% and the 10-year at 2.32%, in the middle of a run that lasted from December 20, 2024 to November 20, 2025.
September 11, 2026, the current observation. The 2-year point reads 2.32%, the 10-year 2.36%, the spread −0.04 points, in the flat band for 4 consecutive days and 61 trading days after the end of the 2026 run.
Methodology
be_Ny_pct = BKEVENNN of the Board’s feds200805 file, zero-coupon inflation compensation at N years, continuously compounded, percent
be_slope_2y10y_pp = be_2y_pct minus be_10y_pct, percentage points
slope_regime = inverted if the spread exceeds +0.10, normal if it is below −0.10, flat otherwise
inversion_episode_id = the k-th maximal run of consecutive trading days with be_slope_2y10y_pp above 0, when the run lasts at least 20 trading days; 0 outside such runs
cpi_fwd_2y_ann_pct = 100 x ((CPI-U NSA at the observation month plus 24 months / CPI-U NSA at the observation month) ^ (1/2) minus 1)
be_2y_err_2y_pp = be_2y_pct minus cpi_fwd_2y_ann_pct
Source and licensing. The breakevens come from the Federal Reserve Board’s TIPS yield curve and inflation compensation page, the daily file that accompanies Gürkaynak, Sack and Wright’s model, a Nelson-Siegel-Svensson curve fitted to outstanding TIPS and compared with the Board’s nominal curve. The file is a staff research product in the public domain, updated every Tuesday for the week ending the previous Friday, and its header carries the warning quoted in the context box above. The 19 published maturities from 2 to 20 years enter the file unchanged. The CPI-U is the not seasonally adjusted all-items index from the Bureau of Labor Statistics, taken from FRED and checked against the BLS API on 55 months with no difference. WTI is the EIA’s Cushing spot price, taken from FRED, matched on the same trading day and left blank on the 489 days without an EIA print. All three sources are in the public domain, so the file is released under CC BY 4.0.
The series the file does not contain. FRED’s T5YIE and T10YIE, the Treasury par-yield breakevens used on the 5-year vs 10-year page, carry a citation-required licence and are used here only as a check: the Board’s 10-year zero-coupon point and T10YIE correlate at 0.968 over 5,921 common days, with a mean gap of +0.061 points and a largest gap of 0.587; the 5-year point and T5YIE correlate at 0.977 with a mean gap of +0.004. The gap is one of convention, zero-coupon against par, and it is largest in late 2008. The nominal 2-year point is not in the file either; the reader who wants the nominal 2s10s curve has its own history on Eco3min.
Why 2 years and not 1. No TIPS is issued with a 1-year maturity, and the Board’s curve is published from 2 years outward, so the shortest market breakeven that can be read on every day since 1999 is the 2-year point. One-year inflation views exist as surveys and models, not as breakevens; the scope question in the FAQ names them.
Episodes. A run is defined on the raw sign of the spread with no smoothing and no threshold, and counted as an episode from 20 consecutive trading days. The count is 33 runs at a 10-day minimum, 23 at 20 and 12 at 40; the two longest are the same under all three, 2021–2022 with 431 days and 2025 with 229. Requiring the spread to exceed +0.10 points throughout gives 15 runs, the longest 385 days from February 19, 2021 to August 30, 2022 and the second 204 days in 2025. Requiring +0.25 splits the 2021–2022 run in two, of 226 and 85 days, which then occupy the first two places. The regime band of ±0.10 is the convention of the paired page; at ±0.05 the file has 1,925 inverted, 4,431 normal and 562 flat days, at ±0.10 it has 1,708, 4,115 and 1,095, and at ±0.15 it has 1,531, 3,814 and 1,573.
Robustness to the start date. The Board’s curve starts in January 1999, when the outstanding TIPS were few and the 2-year point was estimated from a thin part of the market; the spread exceeded one point on 36 days before 2004 and on 97 days since, all of them in 2022. Restricting the sample to 2004 onward leaves the 2-year range at −4.89% to 4.89% and the 10-year range at 0.17% to 3.00%, the volatility ratio at 1.62 instead of 3.89, and the correlation of daily changes between the two points at 0.63 instead of 0.20. The two longest episodes and the six maturities with a record high on March 25, 2022 are unchanged.
Realized inflation. The forward inflation attached to a trading day is computed from the CPI-U of the observation’s calendar month to the index 24 months later, annualized, so it is defined through August 30, 2024 for the 2-year point and through August 31, 2016 for the 10-year point. It is an ex post comparison of a price with an outcome, not a test of forecasting skill: the price on any day already contained the CPI of that month in the lagged index.
Filter Definitions
full sample: date >= 1999-01-04 and date <= 2026-09-11, every trading day with a fitted 2-year and 10-year point, n = 6,918
since 2004: date >= 2004-01-01, n = 5,677
dysfunction window: 2008-09-01 <= date <= 2009-03-31, n = 144 · ex dysfunction: the complement
since 2021: date >= 2021-01-01, n = 1,424 · 2009 to 2020: n = 3,002 · 2010 to 2019: n = 2,501 · 2009 to 2015: n = 1,752 · before 2004: date <= 2003-12-31
inverted: spread > +0.10, n = 1,708 · flat: −0.10 <= spread <= +0.10, n = 1,095 · normal: spread < −0.10, n = 4,115
positive: spread > 0, n = 2,225 · episode: a maximal run of consecutive trading days with spread > 0 lasting at least 20 trading days, 23 runs
two years of CPI: cpi_fwd_2y_ann_pct defined, n = 6,391, through 2024-08-30 · ten years of CPI: n = 4,391, through 2016-08-31
eras: 1999-01-04 to 2003-12-31, 2004-01-01 to 2007-12-31, 2008-01-01 to 2009-12-31, 2010-01-01 to 2019-12-31, 2020, 2021-01-01 to 2022-12-31, 2023-01-01 to 2026-09-11
| Column | Unit | Definition |
|---|---|---|
| be_2y_pct to be_20y_pct | percent | Board zero-coupon inflation compensation at each maturity from 2 to 20 years, 19 columns |
| be_slope_2y10y_pp, be_slope_5y10y_pp, be_slope_2y5y_pp | pp | differences between points of the curve |
| be_2y_chg_1d_pp, be_10y_chg_1d_pp | pp | one-day changes |
| slope_regime | label | inverted, flat or normal at the ±0.10 band |
| inversion_episode_id, episode_day, episode_length_days | integer | run identifier in chronological order, day within the run, length of the run; 0 outside a run |
| vol_ratio_2y10y_252d | ratio | standard deviation of the 2-year daily change over the standard deviation of the 10-year daily change, trailing 252 trading days |
| nber_recession | 0 or 1 | day inside an NBER recession, peak month through trough month: March to November 2001, December 2007 to June 2009, February to April 2020 |
| wti_usd | dollars per barrel | EIA Cushing WTI spot, same trading day, blank when not published |
| cpi_fwd_2y_ann_pct, cpi_fwd_10y_ann_pct | percent a year | annualized CPI-U NSA inflation over the 24 or 120 months from the observation month; blank when not elapsed |
| be_2y_err_2y_pp, be_10y_err_10y_pp | pp | breakeven minus realized inflation over its own horizon |
| slope_fwd_126d_pp, slope_fwd_252d_pp, be_2y_fwd_252d_pp | pp | change of the spread over the next 126 and 252 trading days, and of the 2-year point over 252; blank when not elapsed |
Reproduce it
import pandas as pd
d = pd.read_csv(“breakeven-curve-front-end-1999-2026.csv”, parse_dates=[“date”])
print(d.be_2y_pct.min(), d.be_2y_pct.max(), d.be_10y_pct.min(), d.be_10y_pct.max())
s = d.be_slope_2y10y_pp; runs = (s > 0).astype(int).groupby((s <= 0).cumsum()).sum()
print(sorted(runs[runs >= 20], reverse=True)[:3])
Data sources and references
- Board of Governors of the Federal Reserve System, TIPS Yield Curve and Inflation Compensation, daily file feds200805.csv retrieved September 17, 2026, series BKEVEN02 to BKEVEN20. Staff research product, public domain.
- Refet S. Gürkaynak, Brian Sack and Jonathan H. Wright, “The TIPS Yield Curve and Inflation Compensation”, American Economic Journal: Macroeconomics, volume 2 number 1, 2010, pages 70 to 92, the model behind the Board’s file.
- Stefania D’Amico, Don H. Kim and Min Wei, “Tips from TIPS: The Informational Content of Treasury Inflation-Protected Security Prices”, Journal of Financial and Quantitative Analysis, volume 53 number 1, 2018, pages 395 to 436, on the liquidity premium in TIPS yields.
- Martin M. Andreasen, Jens H. E. Christensen and Simon Riddell, “The TIPS Liquidity Premium”, Review of Finance, volume 25 number 6, 2021, pages 1639 to 1675, on its variation over time.
- Bureau of Labor Statistics, Consumer Price Index for All Urban Consumers, all items, not seasonally adjusted, series CUUR0000SA0, via FRED CPIAUCNS and the BLS public API, retrieved September 17, 2026.
- U.S. Energy Information Administration, Cushing, OK WTI spot price FOB, daily, via FRED DCOILWTICO, retrieved September 17, 2026.
- National Bureau of Economic Research, Business Cycle Dating Committee, US business cycle peaks and troughs: March and November 2001, December 2007 and June 2009, February and April 2020.
- Eco3min, the 5-year vs 10-year breakeven term structure, monthly from FRED, the page this one extends toward the short end; the T5YIE and T10YIE datasets; and the decomposition of the 10-year breakeven into real yield and expectations.
Limitations
- The series is a fitted curve, not a traded price. A different fitting method, or the par-yield convention of FRED’s T5YIE and T10YIE, gives different levels on any given day; the cross-checks in the methodology bound the difference at 0.587 points for the 10-year point and locate it in late 2008.
- The 2-year point before 2004 rests on a handful of securities and is less reliable than the rest of the file. It is kept because the Board publishes it, and every result is also reported from 2004.
- Inflation compensation contains carry, liquidity and risk premiums as well as expectations, in proportions this page does not estimate. The papers in the sources do, and their estimates change what the front end means at any date.
- The episode definition is applied ex post; the regime label on a given day is computable in real time, but the length and rank of a run are known only at its end.
- Consecutive days overlap almost completely in their forward windows, so the forward table describes a few episodes, not thousands of independent observations, and its rows are dominated by 2021–2022 and by 2008.
- The sample contains one sustained inflation shock and one deflation scare. Statements about how the front end behaves in shocks rest on those two events.
Frequently asked questions
Is there a 1-year breakeven inflation rate?
Not as a market series. The Treasury issues no 1-year TIPS, and the Federal Reserve Board’s fitted breakeven curve, the source of this page, starts at 2 years. The 2-year point is therefore the shortest breakeven that can be read on every trading day since 1999, and it is what this page compares with the 10-year. One-year inflation views do exist as surveys and models: the University of Michigan’s consumer survey, the New York Fed’s Survey of Consumer Expectations and the Cleveland Fed’s model-based expectations all publish a one-year horizon, but none of them is a breakeven.
What is the 2-year vs 10-year breakeven spread today?
On September 11, 2026, the latest day in the Board’s file at publication, the 2-year breakeven was 2.32% and the 10-year 2.36%, a spread of −0.04 percentage points, in the flat band of the file. The most recent run with the 2-year above the 10-year lasted 109 trading days and ended on June 15, 2026. The page is updated monthly and the CSV carries the full daily history.
When did the breakeven curve invert in 2021–2022, and how long did it last?
On the Board’s daily curve, the 2-year breakeven crossed above the 10-year on January 7, 2021 and stayed above it through September 23, 2022, 431 consecutive trading days. The spread peaked at +1.94 percentage points on March 24, 2022, with the 2-year at 4.87% and the 10-year at 2.93%; the 2-year set its record 4.89% the next day. It is the longest of the 23 runs of at least 20 days in the record, 1.88 times longer than the 229-day run of 2025.
Why is the 2-year breakeven so much more volatile than the 10-year?
Because a 2-year breakeven prices the next two years of inflation and a 10-year breakeven averages the same two years with eight more. An energy shock or a few surprising CPI prints move the two-year average by their full size and the ten-year average by a fifth of it. The file shows the daily standard deviation of the 2-year point at 3.89 times that of the 10-year over the full sample, 1.62 times from 2004 onward, and the range of the 2-year point at 9.78 percentage points against 2.83 for the 10-year.
Did a 2-year breakeven of −4.89% in December 2008 mean the market expected deflation of 4.9% a year?
No, and the outcome shows it: the CPI-U rose 2.11% a year over the two years after December 10, 2008. The reading combined three things. Energy prices had collapsed, from $145.31 a barrel of WTI on July 3, 2008 to $43.10, and TIPS principal is indexed to the CPI with a lag, so several months of falling prices were already arithmetically inside the 2-year point. TIPS were being sold into a market with few buyers, so their yields rose against nominal Treasuries for reasons of liquidity rather than inflation. And the Board’s curve at 2 years is fitted through very few securities. The Board’s own file header warns that breakevens should not be read as inflation expectations. The same caution applies to any market gauge set against the big picture of macro-financial regimes since the Great Moderation.
How does this page differ from the 5-year vs 10-year breakeven page, and can I reuse the data?
The 5-year vs 10-year page uses FRED’s monthly T5YIE and T10YIE from 2003 and documents the persistence of the reversal month by month. This page uses the Board’s daily fitted curve from 1999, reads its shortest point, dates every run to the day, and publishes all 19 maturities so that the whole curve can be drawn on any day. The two agree on the sign of the 5–10 spread in every month of the 2021–2022 episode. The CSV and XLSX are released under CC BY 4.0: reuse them freely with attribution to Eco3min Research and to the Federal Reserve Board, the Bureau of Labor Statistics and the EIA.
Cite this page
Eco3min Research, “2-year vs 10-year breakeven inflation, 1999 to 2026: a front end that ranged from −4.9% to +4.9%”, September 2026. https://eco3min.fr/en/2-year-vs-10-year-breakeven-inflation/ Data CC BY 4.0.
Last updated — 18 September 2026
Disclaimer – Financial Information: The analyses, commentary, and content published on eco3min.fr are provided for informational and educational purposes only. They do not constitute investment advice or a solicitation to buy or sell financial instruments. Past performance is not indicative of future results. All investment decisions involve risk and are the sole responsibility of the reader.