
Equity Markets & ETFs: Structure, Valuations, Cycles and Monetary Regimes
Business cycles, monetary regimes and capital flows — the structural forces that determine the trajectory of equities and ETFs.
— Past performance tells a story. The current regime determines the next one.
Equity markets do not reflect the economy. They reflect the discounted value of future earnings within a given monetary regime. This distinction — between observable economic activity and forward-looking valuation — is the source of most misunderstandings about the stock market, and gains depth when read alongside the complete guide to inflation regimes and the reading key without which market moves appear incoherent. When the S&P 500 gains 26% in 2023 (S&P Global) while consensus expects a recession, it is not “disconnected from reality” — it prices a soft landing that data will only confirm six months later. When it falls 19% in 2022 despite earnings still growing, it is not “overreacting” — it is repricing to a regime where real rates moved from -1.19% to +2.40% in sixteen months (Federal Reserve).
To understand the fundamental principles behind equity investing, from valuation to long-term performance drivers, see our investing for beginners hub.
The question structuring this pillar is not “which stocks to buy?” — it is: in which regime of real rates, earnings, flows and concentration does the equity market operate, and what are the implications for returns, risk and allocation?
This pillar is the analytical framework dedicated to equity markets and ETFs within the Eco3min architecture. It does not duplicate the Markets Finance pillar, which covers cross-asset price formation, correlation and liquidity dynamics. Here the focus is specific: equity valuation mechanics, the earnings cycle, index composition and concentration, the passive management revolution, and structural shifts that have changed the nature of “equity investing.” The sub-pillars — Valuations & profits, Cycles & expectations, The passive revolution, Sectors & themes, Shareholder returns, Companies & sector dynamics — implement this framework.
The structuring equation: decomposing equity performance
All equity market performance decomposes into three components, and only three: earnings growth, changes in valuation multiples, and dividends. This decomposition is not theoretical — it is the diagnostic grid that allows us to tell which parts of a rise or fall are sustainable and which are not. Our other head-to-head breakdowns are gathered in the comparison library.
Total equity return ≈ Earnings growth + Change in multiples + Dividends
Where: Change in multiples ≈ Change in real rates + Change in equity risk premium
Over the very long term (1950–2024), the S&P 500 delivered a total annualized return of 10.3% (Ibbotson/Morningstar). Earnings-per-share growth contributed about 6.8% (S&P Global, Shiller), dividends about 2.5% (S&P Dow Jones Indices), and net multiple expansion the remainder. Over horizons of 10 years and more, earnings growth explains over 80% of total return variation (Bernstein Research). But on short and medium horizons — the ones that drive allocation decisions — changes in multiples dominate. And multiples are a function of the real-rate regime. This articulation is what this pillar formalizes.
2009–2019: the multiples-driven regime
The S&P 500 rose from 677 in March 2009 to 3,231 by end-2019 — a 15.3% annualized return (S&P Global), about 5 points above the long-run historical average. Decomposing that performance reveals the nature of the regime.
Half earnings, half rates
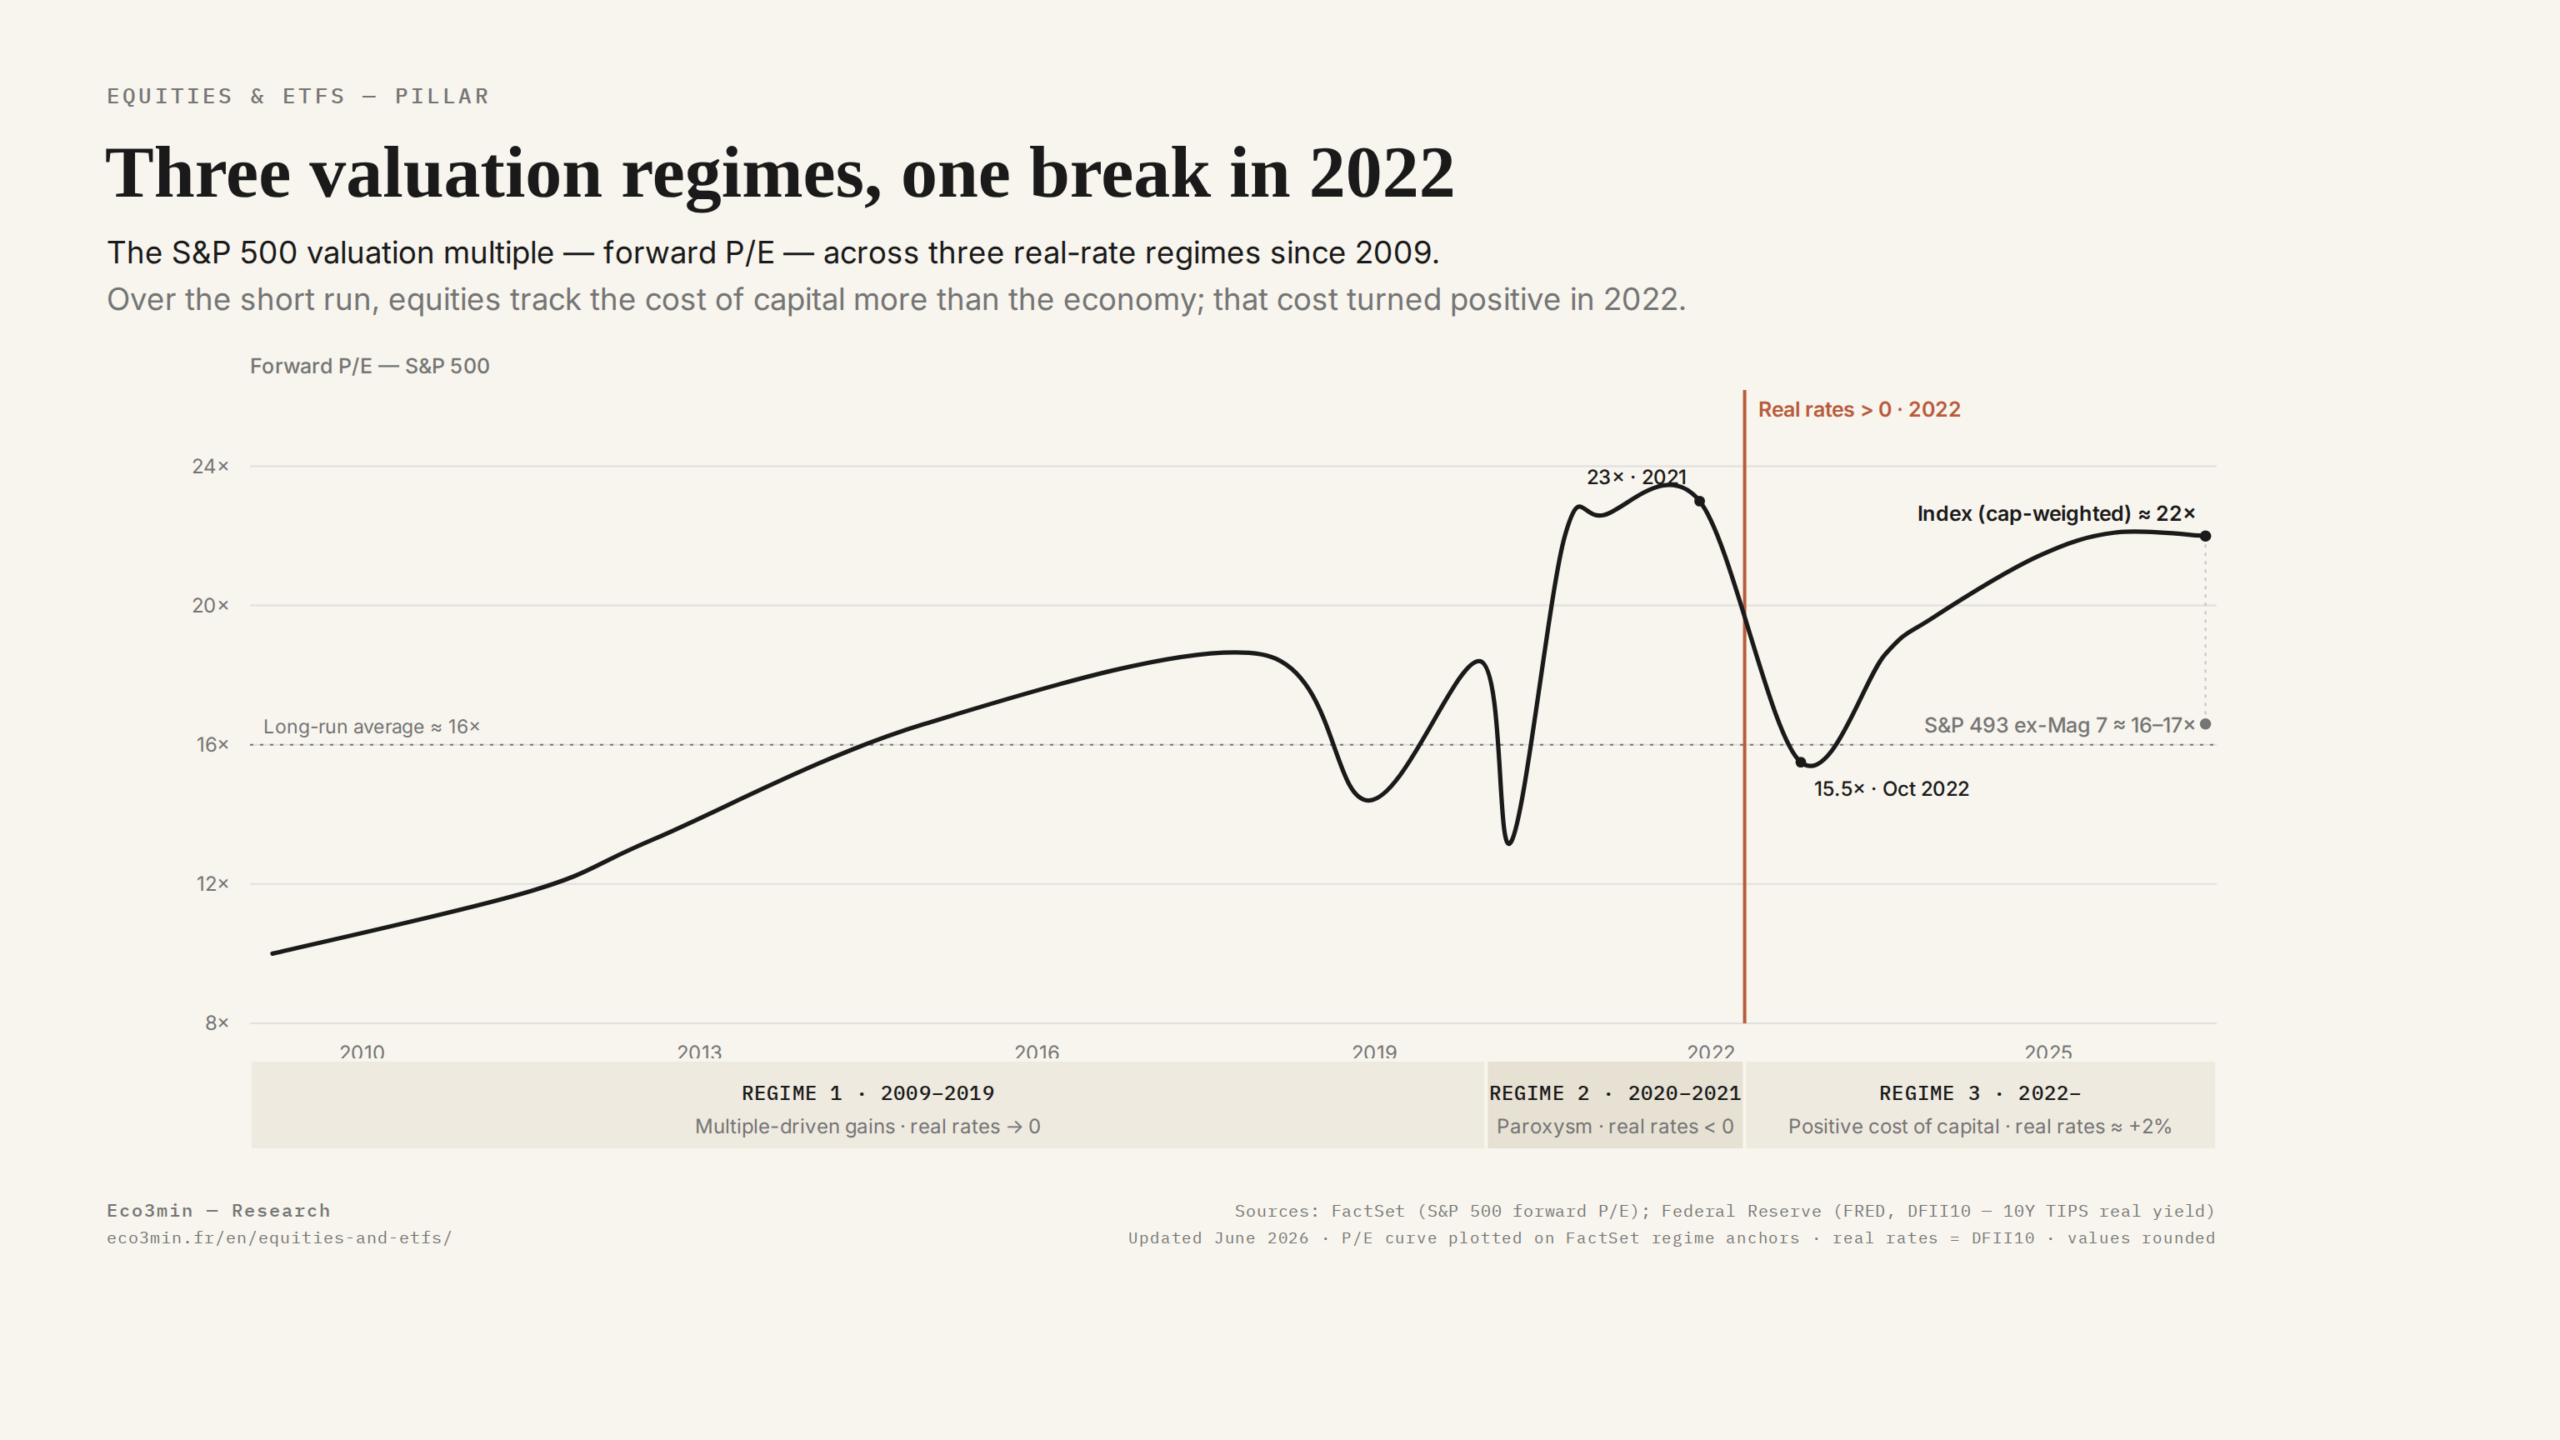
S&P 500 earnings per share multiplied by 3.5 between 2009 and 2019 — an 8.5% annualized growth (FactSet), well above the long-run average of 6.8%, driven by margin expansion (from 7% to 12%, FactSet), massive buybacks (+$100bn per year, Goldman Sachs) and the rising weight of the technology sector. But that growth explains roughly only half of the performance. The other half came from forward P/E expansion from 10x to 19x (FactSet) — a 90% revaluation — produced by falling real rates toward zero and the TINA regime (There Is No Alternative).
In other words, an investor who bought the S&P 500 in March 2009 and sold at end-2019 should attribute about half their gain to genuine improvement in corporate fundamentals. The other half was a monetary-regime effect — reproducible only if real rates return to zero or negative territory.
Rising concentration: a structural feature
The decade saw a methodical concentration of performance in a small set of names. The FAANGs (Facebook, Apple, Amazon, Netflix, Google) rose from 5% of S&P 500 market cap in 2013 to 18% in 2019 (S&P Global). The growth factor outperformed value every year except 2016 (S&P Global). This concentration is the logical consequence of a low-rate regime: long-duration equities — whose cash flows are concentrated far in the future — mechanically benefit from a lower discount rate. The monetary regime did not merely support the market — it selected the winners.
The passive revolution: a silent transformation
At the same time, a structural mutation was redefining how equity markets function. Global ETF assets rose from $1tn in 2009 to $6.3tn in 2019, then to over $12tn by end-2024 (ETFGI). In the United States, index funds and ETFs now represent more than 50% of equity fund assets (ICI, 2024) — a historic inversion relative to active management. This transformation has three measurable consequences for market dynamics: stronger intraday correlations (index flows buy or sell all components simultaneously), reduced price discovery (fewer fundamental analysts “vote” with capital), and mechanical amplification of cap-weighted index moves (largest stocks receive largest flows, reinforcing their weight). This is decomposed carefully in the sub-pillar The passive revolution.
2020–2021: the apex — everything rises and discrimination disappears
Monetary and fiscal stimulus in 2020–2021 pushed equity valuation regimes to a breaking point. With real rates at -1.19% (10-yr TIPS, Aug 2021, Federal Reserve), excess liquidity of over $4tn in the banking system (Federal Reserve) and $5tn of fiscal stimulus (CBO), markets’ corrective mechanisms — cost of capital, fundamentals-based discrimination, loss punishment — were temporarily neutralized.
The numbers document the disconnect. The S&P 500 hit a new high in Aug 2020, five months after a -34% trough — the fastest recovery on record — while the unemployment rate was still 8.4% (BLS). Forward P/E peaked at 23x (FactSet). The Goldman Sachs Non-Profitable Technology index — grouping tech firms without profits — rose 200% in 11 months (Bloomberg). IPOs reached 1,035 in 2021, the highest since 2000 (Renaissance Capital). SPAC assets exceeded $160bn (SPAC Research). GameStop reached $483, +18,700% from its low (NYSE).
This was not accidental — it was the mechanical consequence of a regime in which capital had no price. Individual rationality (invest rather than hold cash with negative real yield) produced a collectively unsustainable result. The conditions for that regime disappeared in 2022 and have not returned.
2022–?: the new regime — when capital regains a price
The monetary tightening of 2022–2023 restored the fundamental mechanism that the prior decade had neutralized: discrimination via the cost of capital. When real rates are positive and cash yields 5%, capital is no longer forced into risky assets — it moves there only if expected returns justify the risk. This change transformed the nature of the equity market.
Multiple compression: structural repricing
Forward P/E for the S&P 500 fell from 23x at end-2021 to 15.5x in October 2022 (FactSet) — a 7.5-point compression in ten months driven by a 360 bps swing in real rates (Federal Reserve). The Goldman Sachs Non-Profitable Technology index lost 75% (Bloomberg). Bitcoin fell from $69k to $16k (CoinGecko). Long-duration assets — most sensitive to discount rates — suffered the largest losses. In 2022, S&P 500 Value outperformed S&P 500 Growth by 22 points (S&P Global) — the largest factor rotation since 2000.
Extreme concentration: a two-speed market
Then a remarkable phenomenon occurred: S&P 500 multiples climbed back to ~20–21x by end-2024 (FactSet), despite real rates remaining above 2%. This apparent re-expansion is explained by unprecedented concentration. The Magnificent 7 (Apple, Microsoft, Alphabet, Amazon, Nvidia, Meta, Tesla) accounted for over 60% of S&P 500 gains in 2023 and nearly all in 2024 (S&P Global). The S&P 500 equal-weight underperformed the cap-weighted index by more than 10 points in 2023 (S&P Global). The share of S&P 500 constituents outperforming the index fell below 30% (S&P Global).
In reality the market became two-tiered. The S&P 493 (ex-Magnificent 7) trades around 16–17x forward P/E (Goldman Sachs) — consistent with a 2% real-rate regime. The Magnificent 7, with earnings growing 30–50% annually (FactSet), trade at much higher multiples — justified by exceptional growth but creating systemic dependence of the index on a handful of firms’ earnings trajectories.
The return of selection: bankruptcies, defaults, dispersion
Regime change is also measured by what no longer rises. The Russell 2000 (small caps) underperformed the S&P 500 by over 30 cumulative points between 2021 and 2024 (FTSE Russell). High-yield default rates rose from 1.0% to 3.9% between early 2022 and Q3 2024 (Moody’s). US corporate bankruptcies reached 642 in 2023 — the highest since 2010 (S&P Global Market Intelligence). When capital has a cost, companies that do not cover it are culled. That selection — suspended during the prior decade — is back.
Judging the market as “expensive” by comparing the S&P 500 P/E to its historical average (16–17x) without accounting for the rate regime, sector composition (technology = 30% of the index vs 5% thirty years ago), or margin levels (12–13% vs 6–7% historically) is misleading. Apparent S&P 500 expensiveness is largely a concentration artifact — the S&P 493 trades at multiples consistent with the current rate regime.
The four axes of equity market analysis
Beyond the historical reading of regimes, structural equity market analysis is organized around four dimensions that the sub-pillars develop in depth.
Real rates set the discount rate. The discount rate sets multiples. Multiples drive short-term performance. Historically, each 100 bps rise in 10-year real rates is associated with a 2–3 point compression in forward P/E (Goldman Sachs, 2023). The equity risk premium (ERP) — expected excess return of equities over bonds — was around 2.8% at end-2024 (Damodaran, NYU), versus a long-run average of 4.5–5%. Published in Aswath Damodaran’s current-year equity risk premium estimates (NYU Stern). This compression signals a market that demands little compensation for risk — and tolerates little error. The point is set out at length in the sub-pillar Valuations & profits.
Axis 2: the earnings cycle — margins, revisions, pricing power
Over the long term earnings rule. S&P 500 EPS have grown ~6.8% per year since 1950 (S&P Global, Shiller). The revision dynamic — the ratio of upward revisions to total revisions — anticipates market inflection points 2–6 months ahead (Citi Earnings Revision Index). When that ratio falls below 0.50, the probability of underperformance at 6 months exceeds 70% (Citi Research). S&P 500 net margins, peaking at 13.1% in 2021 (FactSet) vs 6–7% historically, provide structural support — but their sustainability depends on companies’ pricing power in a higher-inflation regime. Sub-pillars Valuations & profits and Cycles & expectations develop this mechanism.
Axis 3: flow structure — passive, buybacks, concentration
Flows determine direction — fundamentals determine the destination. ETFs and index funds collect over $600bn per year (ETFGI), S&P 500 buybacks exceed $800bn (Goldman Sachs), and money market funds absorbed over $1tn in 2023 (ICI). These three flows — passive inflows, buyback outflows, monetary competitors — are the tectonic forces shaping trend. The rise of passive management mechanically reinforced cap-weight concentration: the biggest stocks receive the largest flows, increasing their weight and attracting more flows — a self-reinforcing loop. The sub-pillar The passive revolution and sub-pillar Shareholder returns analyse these mechanisms.
Axis 4: composition — when the index is not the economy
The S&P 500 is not the US economy — it is a cap-weighted portfolio of the 500 largest listed US companies, whose earnings depend more on global demand, the technology cycle and the cost of capital than on domestic GDP. The top ten stocks weigh over 35% of the index (S&P Global). Apple generates 60% of revenue outside the US (10-K), Nvidia 75%. The US economy is dominated by services (78% of GDP, BEA), SMEs (47% of employment, SBA) and consumption (68% of GDP, BEA) — segments not represented proportionally in the index. This structural divergence is the norm, not the exception. The sub-pillar Cycles & expectations formalizes five mechanisms around it.
Structural risks of the current regime
The new market regime concentrates risks of a different nature than those of the previous regime. Three deserve formalization.
Concentration risk. The S&P 500’s sensitivity to the earnings trajectory of seven companies creates an unprecedented systemic vulnerability. If Nvidia, Apple or Microsoft’s earnings disappoint — or if the market re-prices AI monetization prospects — the correction of those few names can drag the entire index, even if the other 493 constituents are reasonably valued. The S&P 500 Herfindahl-Hirschman concentration index reached record levels (S&P Global, 2024).
Passive correlation risk. A broad ETF does not eliminate risk — it mutualizes it in normal times and synchronizes it in stress. Passive growth has reduced the number of fundamental buyers and sellers per stock, creating an “illusion of diversification”: in stress, internal correlations converge to 1 and apparent diversification disappears. $100bn of equity fund outflows in March 2020 (ICI) produced indiscriminate selling across components.
Sectoral repricing risk. Technology represents over 30% of the S&P 500 (S&P Global). Sector margins (25–35% for the GAFAMs) rely on scale effects, quasi-monopolistic positions and optimized tax structures. Any combination of stronger antitrust regulation, taxation of international profits and maturity in the AI investment cycle could compress both margins and multiples for the segment that weighs most heavily on the index. Sector analysis is developed in the sub-pillar Sectors & themes and sub-pillar Companies & sector dynamics.
From equity analysis to allocation decisions
The analytical framework formalized in this pillar does not aim to provide recommendations — it aims to structure the reading of equity markets in their macroeconomic context. A regime of positive real rates, extreme concentration, historically high margins and a compressed risk premium does not imply the same exposures as a zero-rate regime with broad gains and expanding multiples. Understanding the regime precedes allocation decisions.
The allocation principles, strategic frameworks and concrete implications of this reading are developed in the Strategies pillar, which is the operational extension of the structural analysis formalized here and in the Monetary policy & rates, Markets Finance and Macroeconomics & geopolitics pillars.
Equity markets do not reflect the economy — they reflect the discounted value of future earnings within a monetary regime. Total return decomposes into earnings growth, change in multiples and dividends. Over the long run earnings dominate. In the short run multiples dominate — and multiples depend on real rates and the risk premium. The 2009–2021 decade produced historically exceptional performance, about half of which derived from multiple expansion — a monetary-regime effect not easily reproduced. The regime emerging since 2022 is characterized by positive real rates, restored selection, extreme concentration and a return of defaults and bankruptcies. The relevant question is not “which stocks to buy?” but “in which regime of real rates, earnings and concentration does the market operate, and what are the implications for returns, dispersion and risk?”. This is the question this pillar and its sub-pillars aim to answer.
Last updated — 26 August 2026
Disclaimer – Financial Information: The analyses, commentary, and content published on eco3min.fr are provided for informational and educational purposes only. They do not constitute investment advice or a solicitation to buy or sell financial instruments. Past performance is not indicative of future results. All investment decisions involve risk and are the sole responsibility of the reader.
Read next
Equity Markets vs Real Economy: Earnings Cycles, Index Structure and Monetary Regimes
Reading framework This page extends the analysis of the Equities & ETFs pillar. It formalizes the structural framework…
Passive management: how ETFs are transforming market structure
Passive management has profoundly transformed the structure of financial markets. What was a marginal innovation in the 1970s…
Sector Rotation and Style Regimes: Value, Growth and Market Cycles
Sector rotation is not a prediction strategy — it is a reading of the market’s implicit arbitrages. When…