
QE vs rate cuts: two different easing tools
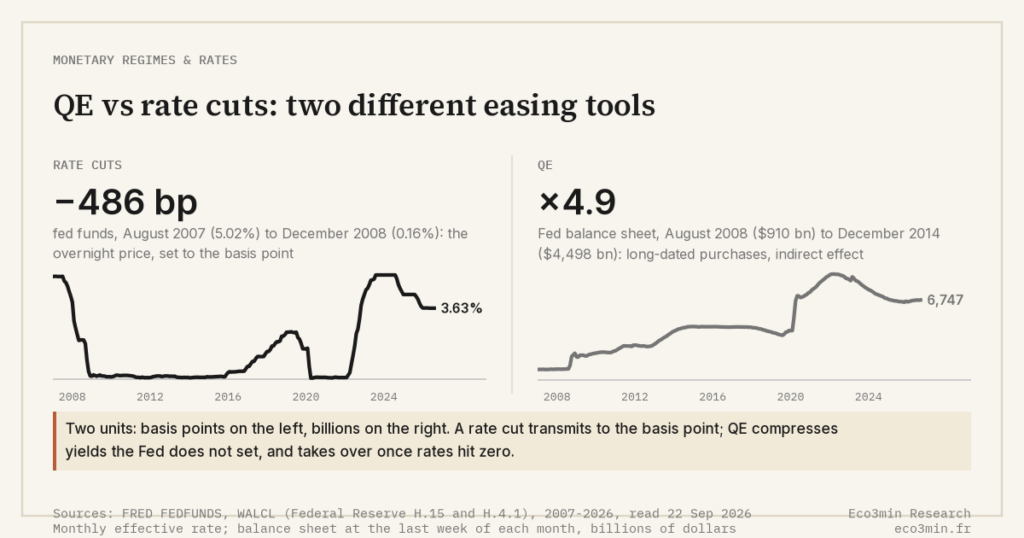
Quantitative easing and rate cuts are both forms of monetary easing, but they act on different prices through different channels. A rate cut moves the overnight rate the Fed sets directly and one-for-one; QE buys long-term bonds to push down yields the Fed does not set, an effect research estimates at roughly 100 to 150 basis points across QE1 to QE3 but one that is indirect and contested. The deciding difference is the certainty of transmission, and the fact that QE is what central banks reach for once rate cuts hit zero.
In this comparison
Why this comparison matters
Search interest in “QE vs rate cuts” rises whenever a central bank signals easing, because the two tools are routinely described with the same word — stimulus — as if they were interchangeable. They are not. A rate cut changes the price of overnight money that the Federal Reserve sets administratively; quantitative easing changes the quantity of reserves in the system and works on long-term yields the Fed does not directly control. Treating them as the same instrument obscures why central banks deploy them in sequence rather than as substitutes, and why their effects differ in both certainty and persistence. A broader view: our reference page on the institutions and rate cycles behind monetary policy.
What quantitative easing is
Quantitative easing is the large-scale purchase of long-term securities — Treasuries and agency mortgage-backed securities — financed by newly created reserves, which expands the central bank’s balance sheet. The Federal Reserve first used it at scale in 2008, when the federal funds rate had already reached its effective floor. Across QE1, QE2 and QE3, the Fed’s balance sheet rose from roughly $0.9 trillion in 2008 to about $4.5 trillion by 2014 (Federal Reserve Bank of Kansas City). The stated objective was to compress long-term yields and ease financial conditions once conventional cuts were exhausted.
→ Fuller explanation: What is quantitative easing and how does it differ from QT?
What a rate cut is
A policy rate cut lowers the target range for the federal funds rate — the overnight rate at which banks lend reserves to each other. The Fed implements it operationally by adjusting administered rates, chiefly the interest paid on reserve balances, which steers the effective rate into the target band. Unlike QE, transmission to the controlled price is mechanical: a 25-basis-point cut is a 25-basis-point move at the policy target. In 2007 to 2008 the Fed cut from 5.25% to a 0 to 0.25% range; in March 2020 it returned to that floor in two emergency moves.
→ Extended explanation: How does the Fed control short-term interest rates operationally?
The key differences
Channel. A rate cut works through the short end and the expectations channel: it lowers the cost of overnight funding and signals the likely path of future short rates. QE works through the term-premium and portfolio-balance channel — by removing duration from the market, it aims to reduce the compensation investors demand to hold long-term bonds.
Certainty of transmission. This is where the tools diverge most. The policy rate moves exactly as decided. QE’s effect on the 10-year Treasury yield is an estimate: research commonly cites a cumulative reduction of about 100 to 150 basis points across QE1 to QE3 (Gagnon et al., 2011), with individual studies spanning a wider band of roughly 90 to 200 basis points (Federal Reserve Bank of Philadelphia). Some analyses found long yields actually rose during certain QE windows, which underscores that the relationship is contested rather than mechanical.
Residue. A rate cut can be reversed in a single meeting. QE leaves a balance-sheet footprint that interacts with asset prices and takes years to unwind. After peaking near $8.9 trillion in April 2022, the Fed’s balance sheet had declined only to about $6.7 trillion by mid-2026 — still far above the pre-2008 level of roughly $0.9 trillion (Federal Reserve).
How they behave across regimes
The choice between the two tools has historically been dictated by one parameter: the zero lower bound. When the policy rate sits well above zero — as in the 2001 and 1990 to 1991 downturns, or the partial easing cycle that began in late 2024 — conventional rate cuts are the first-line response and QE stays in reserve. When the rate reaches its floor, as in 2008 to 2015 and again in 2020 to 2021, the conventional tool is exhausted and central banks turn to balance-sheet expansion. The exit reverses both, but asymmetrically: in 2022 to 2023 the Fed raised rates by 525 basis points quickly, while quantitative tightening has unwound the balance sheet only gradually. The switch parameter is the effective lower bound on the short rate; below it, easing migrates from price to quantity.
A rate cut moves the price the Fed sets; QE wagers on one it does not.
→ Framework: Monetary regimes, interest rates and liquidity
The common confusion
The most common error is to fold both tools into a single idea — the Fed printing money — and to assume QE pushes down long-term yields with the same certainty a cut pushes down the overnight rate. The mechanics differ. Reserves created by QE are not currency in circulation, and their effect on long yields runs through investor portfolios rather than an administered rate, which is why the estimated magnitude varies so widely across studies. A related confusion treats the two as alternatives a central bank picks between; in practice they sit at different points on the same sequence, separated by the zero lower bound.
Practical observation
What the data suggests for framing your own analysis:
- Question to ask yourself: is the central bank operating above or below the effective lower bound? That single fact indicates which tool is in play and how directly it transmits.
- Data to monitor: the level of the policy-rate target relative to zero, and the weekly direction of the balance sheet (Federal Reserve H.4.1 release).
- Historical parallel: in 2008 and again in March 2020, the funds rate reached the 0 to 0.25% floor before QE began; the sequence, not the simultaneity, is the recurring pattern.
- What the literature documents: Gagnon et al. (2011) and subsequent Federal Reserve research estimate QE’s yield effect within a wide band, reflecting genuine measurement uncertainty rather than a fixed coefficient.
This is descriptive information to help you frame your own analysis. Eco3min does not provide investment advice.
Go deeper
📁 Datasets: Fed funds rate track record · US net liquidity index
Related guides
Frequently asked questions
How is quantitative easing different from a rate cut?
A rate cut lowers the overnight rate the Federal Reserve sets directly: a 25-basis-point cut is a 25-basis-point move at the policy target, transmitted through administered rates. Quantitative easing instead buys long-term bonds with newly created reserves to push down yields the Fed does not set, working through the term premium and portfolio-balance channel. The first acts on the short end with mechanical certainty; the second acts on the long end through investor behaviour, with an effect that is estimated rather than guaranteed.
Why does the Fed use QE instead of cutting rates further?
Because conventional cuts run out of room. Once the policy rate reaches its effective floor near zero, it cannot be lowered much further without venturing into negative territory the Fed has avoided. At that point the central bank has historically turned to balance-sheet expansion to keep easing financial conditions, as it did in 2008 and again in 2020. This is why the two tools are best understood as sequential rather than as substitutes a committee chooses between: the zero lower bound is the threshold that moves easing from price to quantity. The wider set of head-to-heads brings every pairing together in one spot.
Why is QE’s effect on long-term rates debated when a rate cut’s is not?
Because they act on different prices through different channels. The policy rate is administered, so its move is observable and exact. Long-term yields are set by the market, and QE influences them indirectly by removing duration and signalling future support. Estimating that influence requires separating the purchases from everything else moving yields at the same time, which is why study estimates for QE1 to QE3 range from roughly 90 to 200 basis points, and why some windows even show long yields rising. The uncertainty is structural, not a failure of measurement.
Last updated — 22 September 2026
Disclaimer – Financial Information: The analyses, commentary, and content published on eco3min.fr are provided for informational and educational purposes only. They do not constitute investment advice or a solicitation to buy or sell financial instruments. Past performance is not indicative of future results. All investment decisions involve risk and are the sole responsibility of the reader.
Read next
Full pillar →Buying vs renting: what the data shows
Buying gives you a leveraged claim on a single asset whose real price has barely risen over the…
Value vs growth: how the styles diverge across regimes
Value buys cheap cash flows today; growth pays up for cash flows years out. The real difference is…
Physical vs synthetic ETFs: replication compared
Physical ETFs hold the index's actual securities; synthetic ETFs replicate it through a total return swap with a…