
Buying vs renting: what the data shows
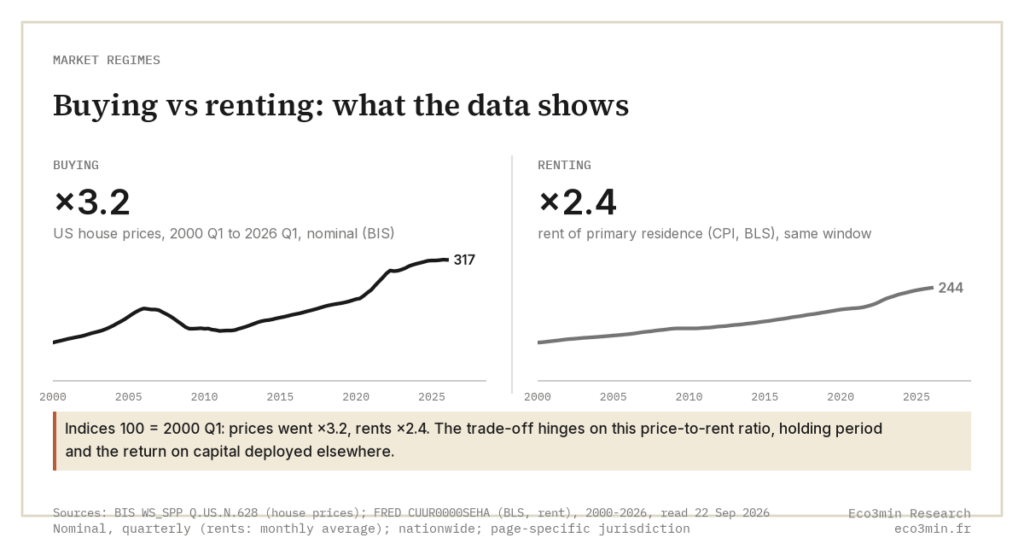
Buying gives you a leveraged claim on a single asset whose real price has barely risen over the long run; renting buys flexibility and frees capital. The decision rarely turns on “throwing money away”: it turns on the price-to-rent ratio, how long you stay, and what the freed capital earns elsewhere.
In this comparison
Why this comparison matters
Few financial decisions are framed as poorly as buying versus renting. The dominant narrative treats rent as money lost and ownership as wealth automatically built. Both halves of that framing collapse under the data. Renting purchases a real service (shelter and mobility) while buying bundles a housing service with a leveraged, illiquid investment whose return depends far more on the price-to-rent ratio at entry and the interest-rate regime than on any inherent tendency of property to appreciate. More context: the breakdown of diversification in stress regimes.
What buying is
Buying converts a stream of rent payments into ownership of an asset, almost always financed with leverage through a mortgage. The buyer takes on transaction costs, maintenance, property taxes and rate risk in exchange for a fixed housing cost (under a fixed-rate loan) and any future price appreciation. The financial appeal rests on a long list of variables (entry price, borrowing rate, holding period, local supply) far beyond the headline purchase price.
→ Full explanation: What drives housing affordability besides prices?
What renting is
Renting buys the use of housing without the capital commitment, the leverage, or the maintenance liability. The renter keeps mobility and keeps the down payment invested elsewhere. The cleanest gauge of which path is financially heavier is the price-to-rent ratio: the purchase price of a home divided by one year of rent for the equivalent property. A low ratio favours buying; a high ratio means renting is cheaper on a monthly basis.
→ Full explanation: What is the price-to-rent ratio and what does it tell us?
The key differences
Mechanism. Renting is a pure consumption expense for a service. Buying is a hybrid: part consumption (the housing service you would otherwise rent) and part leveraged investment. Conflating the two is the source of most bad rent-versus-buy arithmetic, because the “equity” a buyer builds is partly just the forced saving of paying down a loan. Consumption on one side, leveraged investment on the other: the split is why a primary residence, savings and investing are best kept as three distinct functions.
Where the return actually comes from. Here is the non-obvious part. Over very long horizons, real home prices barely move. Robert Shiller‘s data put the real capital gain on US residential property at roughly half a percent a year across 1890–2014. The ownership advantage, when it exists, comes not from appreciation but from the housing service consumed, the forced saving, and the leverage that magnifies a thin underlying return, in both directions.
Liquidity and flexibility. A rented home can be left in weeks; a bought one takes months to sell and costs several percent of its value in agent fees and taxes each time it changes hands. Those round-trip transaction costs raise the holding period a buyer needs before ownership pays off, and they are a real drag the rent-versus-buy slogan ignores entirely.
Opportunity cost of capital. The down payment a buyer locks into a property is capital that a renter can keep invested. Whether buying or renting comes out ahead financially depends heavily on what that freed capital earns elsewhere: a comparison the housing-only framing leaves out, and the reason the decision is rarely settled by the purchase price alone.
How they behave across regimes
The buy-versus-rent balance moves with rates and with the price-to-rent ratio. In the low-rate, disinflationary years to 2021, cheap mortgages and rising prices made ownership look unambiguously attractive and pushed the US national price-to-rent ratio up to about 14.3 by 2024, from 13.0 in 2019 (Baselane data on FRED/Census series). When real rates jumped in 2022, monthly ownership costs rose sharply even as rents softened: by June 2025 renting remained cheaper than buying in 49 of the 50 largest US metros (Realtor.com Rental Report). The pivot is the relationship between the mortgage rate, the entry ratio, and the expected holding period, not a fixed rule that ownership wins after a set number of years. Because all three move together, the comparison resists any rule of thumb and depends on the numbers of each case, the premise behind the financial tools and simulators built to test assumptions.
A stretched price-to-rent ratio can persist for years. The ratio works for housing the way a price-to-earnings multiple works for a stock, and three forces hold it up. Lower rates raise the present value of future rents more than they raise rents themselves. Constrained construction, through zoning, scarce land or limited builder capacity, lets demand lift prices faster than rents. The third force is mortgage architecture. Where loans are variable or fixed for short periods, rising rates quickly raise carrying costs, some owners sell, others delay buying, and prices move back toward rents. Under the US 30-year fixed loan, existing owners are shielded from the rate move, resale supply freezes and that correction is delayed. The ratio is a gauge of fundamentals over several years. Read as a timing signal for the buy-versus-rent call, it can mislead for a long time.
Rent buys flexibility; buying buys a leveraged bet on a price that, stripped of inflation, has historically gone almost nowhere.
→ Analytical framework: Early mortgage repayment or investing: what has historically made the difference?
The common confusion
The recurring error is “rent is throwing money away, a mortgage builds equity.” Rent buys a real service that the owner also consumes: an owner is, in effect, paying imputed rent to themselves. And a mortgage payment is mostly interest in the early years, not equity. The fairer comparison sets total ownership cost (interest, taxes, insurance, maintenance, transaction costs) against rent, then asks what the un-invested down payment would have earned. Framed that way, the inflation-adjusted cost of housing is far closer between the two paths than the slogan suggests.
National accounts do record that flow. They value it with the market-rent method, pricing each owner-occupied dwelling at what comparable units rent for locally, the approach INSEE and Eurostat use. In France, imputed rent for owner-occupiers reached €215 billion in 2024, or 7.4% of GDP, according to INSEE national accounts and the SDES housing account. The user-cost method instead subtracts what holding the property costs: mortgage interest or the opportunity cost of the capital tied up, property tax, charges, maintenance, insurance and depreciation. Net imputed rent stays positive as long as the gross rental yield, the inverse of the price-to-rent ratio, exceeds that user-cost rate. Where prices stand very high relative to rents, user cost can absorb the whole flow, while the owner still capitalises part of each payment through principal repayment.
Tax systems treat the flow as real. The OECD’s Housing Taxation in OECD Countries (July 2022) counts four countries that tax imputed rent, Denmark, Greece, the Netherlands and Switzerland, at comparatively low rates. Switzerland approved its abolition on 28 September 2025, ahead of its entry into force. France kept imputed rent in the income tax base until 1965. Leaving it out now amounts to as much as €11 billion a year in tax expenditure, on Botey and Chapelle’s estimate in Économie et Statistique (INSEE, 2023).
→ Related: What is the real inflation-adjusted cost of housing?
Practical observation
What the data suggests for framing your own analysis:
- Question to ask yourself: over my realistic holding period, does the local price-to-rent ratio sit nearer the buy-favourable zone (historically below 15) or the rent-favourable zone (16–20 and above)?
- Data to monitor: the local price-to-rent ratio, the prevailing mortgage rate, and the breakeven horizon, the number of years before cumulative ownership cost falls below cumulative rent.
- Historical parallel: Zillow’s breakeven horizon stood near two years nationally in 2017 but stretched past four years in high-priced metros such as Los Angeles, illustrating how entry price reshapes the math.
- What the literature documents: Shiller’s long-run home-price series shows real appreciation of roughly 0.5% a year since 1890, undercutting the assumption that property reliably outpaces inflation.
This is descriptive information to help you frame your own analysis. Eco3min does not provide investment advice.
Related guides
Frequently asked questions
How is buying financially different from renting?
Renting is a single payment for a housing service. Buying bundles that same service with a leveraged investment in one illiquid asset, plus maintenance, taxes and transaction costs. The owner builds equity partly through forced saving and partly through any price appreciation, while the renter keeps the down payment available to invest elsewhere. Because long-run real home-price gains have averaged only around 0.5% a year (Shiller), the financial edge of owning typically comes from leverage and the housing service consumed, not from the asset rising faster than inflation.
When has buying tended to beat renting, and when has renting won?
The balance hinges on the price-to-rent ratio and the rate regime. In the low-rate years to 2021, falling mortgage rates and rising prices favoured buyers, lifting the US ratio toward 14.3 by 2024. After the 2022 rate jump, ownership costs climbed even as rents eased, and by June 2025 renting was cheaper than buying in 49 of the 50 largest US metros (Realtor.com). Historically, a price-to-rent ratio below 15 has leaned toward buying, while 16–20 and above has leaned toward renting.
Does the “buy if you stay more than X years” rule hold up?
Only loosely. The relevant concept is the breakeven horizon: the year cumulative ownership cost drops below cumulative rent. It is not a fixed number: Zillow estimated it near two years nationally in 2017 but above four years in expensive metros like Los Angeles. The horizon lengthens with a higher entry price, a higher mortgage rate, or higher transaction costs, and shortens when rents are high relative to prices. More comparisons in the same format continue this approach across the site.
Last updated — 20 October 2026
Disclaimer – Financial and Legal Information: The analyses, commentary, and content published on eco3min.fr are provided for informational and educational purposes only. They do not constitute investment advice or a solicitation to buy or sell financial instruments. Past performance is not indicative of future results. All investment decisions involve risk and are the sole responsibility of the reader. Data, charts and calculated series are provided as is and may contain errors or lag behind their source: check any figure against the primary source cited before relying on it. Content describing laws, regulations or contracts reflects the law as of its publication date and does not constitute legal or tax advice; applying it to a specific situation requires a qualified legal or tax professional.
Read next
Full pillar →Stocks vs bonds: what the long-run data shows
Stocks are residual claims on corporate earnings; bonds are fixed claims on a defined stream of payments. Over…
Proof-of-work vs proof-of-stake: the economics
Proof-of-work secures a blockchain by burning external energy; proof-of-stake secures it by locking internal capital. The real difference…
Dollar vs gold: the reserve-asset tension
The dollar is the world's primary reserve currency; gold is the reserve asset with no issuer and no…