
Policy rates vs long-term rates: why they move differently
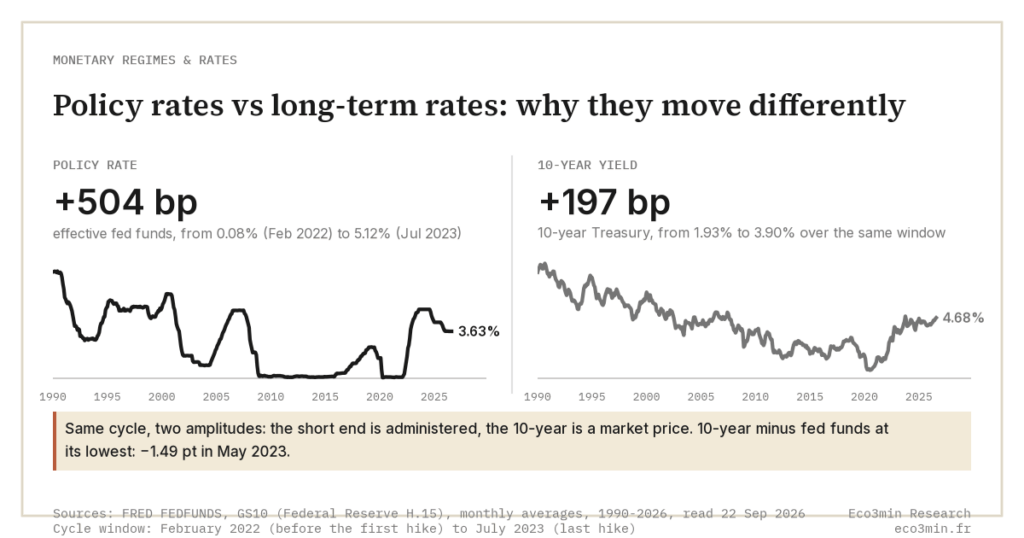
Policy rates are the overnight rate the Federal Reserve sets by decision; long-term rates are the yield the market prices on multi-year Treasuries. The Fed administers the front end directly, but the 10-year is a market price built on growth, inflation and term-premium expectations, which is why a hiking cycle does not move the two in lockstep.
In this comparison
Why this comparison matters
The phrase « the Fed sets interest rates » collapses two very different things into one. The Fed sets one rate directly: the overnight cost of money. Everything beyond a few months is a market price the Fed only influences. Confusing the two leads people to expect mortgage rates, the 10-year yield or corporate borrowing costs to track every policy move one-for-one. They do not. The 2022–2023 cycle made the gap visible: the Fed raised its target range by roughly 525 basis points while the long end moved far less, inverting the curve to its deepest level since 1981. A parallel read: our analysis of how monetary policy reaches corporate earnings.
What policy rates are
Policy rates are the very short end of the curve, set by central-bank decision rather than discovered by the market. In the United States the FOMC announces a target range for the federal funds rate, and since 2019 the Fed has implemented it through a regime of ample reserves, steering the overnight rate with two administered rates: interest on reserve balances (IORB) and the overnight reverse-repo rate (ON RRP). Between March 2022 and July 2023 the Fed lifted the target range from near zero to 5.25–5.50%, the fastest tightening in four decades. The defining feature is control: the front end is administered, not negotiated.
→ The full explanation: How does the Fed control short-term interest rates operationally?
What long-term rates are
Long-term rates are yields on multi-year Treasuries (the 10-year is the benchmark) set continuously by buyers and sellers in the secondary market. A 10-year yield can be decomposed into the average short rate the market expects over the next decade plus a term premium, the extra compensation investors demand for holding duration. Because it embeds expectations about growth, inflation and fiscal supply, the 10-year is a forecast, not a policy lever. It anchors mortgage rates, corporate bond pricing and the discount rate on long-dated cash flows. The defining feature is discovery: the long end is a price, not a setting.
→ Full breakdown: How does the 10-year Treasury yield affect the economy?
The key differences
Mechanism. The policy rate is set by a committee and enforced through administered rates; the 10-year is the equilibrium price of a traded security. One is announced eight times a year; the other reprices every second the market is open. This is the root of every other difference. Read alongside: our growing collection of comparisons.
What moves them. The front end tracks the current and near-term expected policy stance. The long end tracks expectations over a decade plus the term premium. The summer-2023 « Treasury tantrum » illustrated the gap: the 10-year yield climbed by roughly 164 basis points between May and October 2023, even though the Fed was already near the end of its hiking cycle, according to PIMCO. The long end moved on supply and term-premium repricing, not on a fresh policy decision. Knowing where the policy rate stops and bond-market pricing takes over is the hinge of the way central-bank moves travel through markets.
Behaviour across the cycle. Raising the policy rate can flatten or even invert the curve rather than lift long yields proportionally, because aggressive front-end hikes can lower the market’s expected average short rate further out. In July 2023 the 2s10s spread reached roughly −108 basis points, the most inverted since 1981, according to Reuters and FRED data: a direct artefact of the two rates diverging. The counter-intuitive result: tightening at the front end can coincide with a richer, lower-yielding long end.
How they behave across regimes
The split between the two rates widens or narrows with the regime. At the 2020 zero lower bound, the front end was pinned near zero and the long end was suppressed by large-scale asset purchases, pushing the term premium to a record low. Through the 2022–2023 tightening, the front end raced up about 525 basis points while the long end lagged, producing the deepest inversion since 1981. During the Fed’s easing into 2024–2025 the pattern reversed: as the policy rate came down, the 10-year term premium crossed back above zero for the first time since 2021, on fiscal-supply and sticky-inflation concerns. The switching parameter is the term premium, when it is suppressed, the long end follows policy; when it normalises, the long end moves on its own.
Measured cycle by cycle, the long end has followed only a fraction of the policy move. In 2004–2006 the Fed took the federal funds rate from 1.0% to 5.25%. The 10-year yield went from 4.73% to 5.09% in monthly averages between June 2004 and July 2006, 9% of the move. Greenspan called it a « conundrum », later explained by structural demand from Asian central banks recycling trade surpluses into Treasuries. The ratio was 0.29 in 2015–2018 (upper bound from 0.25% to 2.50%, 10-year from 2.24% to 2.83% between December 2015 and December 2018). It was 0.40 in 2022–2023, with the effective rate rising from 0.20% to 5.33% and the 10-year from 2.13% to 4.17% between March 2022 and August 2023 (FRED DGS10).
The two rates can also cross. In monthly averages, the 10-year yield has fallen below the effective federal funds rate in ten episodes since 1954, the latest from December 2022 to October 2025. Seven were followed by an NBER-dated recession within 24 months of their start, including the 2020 one, triggered by the Covid shock. Three were not: 1966–1967, 1998 and 2022–2025. The configuration has since reversed: in May 2026, the 10-year (4.48%) stood above effective fed funds (3.63%).
The euro area ran the same split on its own calendar. The 10-year Bund stayed below the ECB deposit rate for twenty-five months, from February 2023 to February 2025, with a maximum gap of 190 basis points in December 2023 (2.10% against 4.00%, monthly averages, ECB). Easing did not close the gap from the long end. Between June 2024 and June 2025 the ECB cut its deposit rate from 4.00% to 2.00%, while the Bund moved from 2.48% to 2.52%. Funding priced off long rates barely eased: French fixed-rate mortgages are indexed to OAT and swap rates, and corporate bonds are priced off swaps of matching maturity plus an issuer spread.
The reverse case came in 2026. The euro AAA 10-year/2-year slope narrowed from about +84 basis points in January to +39 in September, the month the ECB raised its deposit rate to 2.50% (ECB). In monthly average, the two-year yield rose from 2.08% to 3.10% and the ten-year from 2.92% to 3.49%. The narrowing came from the short leg, the one policy moves directly.
The Fed sets a rate; the market sets a curve.
→ Framework: Monetary regimes, interest rates & liquidity
The common confusion
The frequent assumption is that when the Fed raises rates, all borrowing costs rise by the same amount. In practice only the front end follows the decision mechanically; mortgage and long-bond rates depend on the 10-year, which can move the other way. A reader watching the Fed hike in 2023 and expecting the 10-year to climb point-for-point would have been wrong twice: first when long yields lagged the front end, then when they jumped on term-premium repricing unrelated to any new policy move. The fix is to separate the rate the Fed sets from the curve the market prices.
Practical observation
What the data suggests for framing your own analysis:
- Question to ask yourself: when a policy move is announced, is the rate I care about (mortgage, corporate, long bond) anchored to the front end or to the 10-year?
- Data to monitor: the 2s10s spread and the ACM 10-year term premium; together they show how far the long end has detached from policy.
- Historical parallel: July 2023, when +525 bp of hikes coincided with a 2s10s spread near −108 bp, the deepest since 1981.
- What the literature documents: Adrian, Crump and Moench decompose long yields into an expectations path and a term premium, the variable that lets the long end diverge from policy.
This is descriptive information to help you frame your own analysis. Eco3min does not provide investment advice.
Go deeper
📊 Background article: Monetary policy: incentives, limits and the real economy
📁 Datasets: Yield curve inversion history (2s10s) · Fed funds rate track record
Related guides
Frequently asked questions
Why don’t long-term rates rise when the Fed hikes?
Because the 10-year is a market price, not a policy setting. It reflects the average short rate the market expects over the next decade plus a term premium. When the Fed hikes aggressively to fight inflation, the market may simultaneously lower its expectation for short rates further out, anticipating slower growth or future cuts. The two effects can offset, leaving the long end roughly flat or even lower while the front end climbs: the mechanics behind the 2022–2023 inversion.
What actually decides the gap between short and long rates?
The decomposition is the answer: a 10-year yield equals the expected path of short rates plus the term premium. The expected path links the long end to policy; the term premium lets it detach. From 2014 to 2023 the term premium was negative or near zero, so the long end largely tracked policy. When it crossed back above zero in late 2024, on fiscal-supply and inflation concerns, the long end began moving on its own, widening or narrowing the gap independently of any FOMC decision.
Which rate matters more for the economy?
They transmit through different channels. The policy rate sets the cost of overnight funding for banks and short-dated credit, feeding quickly into money-market and floating-rate borrowing. The 10-year anchors mortgages, long-dated corporate debt and the discount rate on distant cash flows, so it dominates housing and equity valuation. Between those two ends sits the 10-year / 3-month Treasury spread, which compresses the whole gap into one recession signal. Historically the front end moves first and the long end registers the cumulative expectation, which is why watching only one rate gives an incomplete read on financial conditions. Within the front end itself, the official rate and what banks actually pay diverge, a gap the UK three-month sterling money-market series since 1957 makes visible.
Last updated — 29 October 2026
Disclaimer – Financial and Legal Information: The analyses, commentary, and content published on eco3min.fr are provided for informational and educational purposes only. They do not constitute investment advice or a solicitation to buy or sell financial instruments. Past performance is not indicative of future results. All investment decisions involve risk and are the sole responsibility of the reader. Data, charts and calculated series are provided as is and may contain errors or lag behind their source: check any figure against the primary source cited before relying on it. Content describing laws, regulations or contracts reflects the law as of its publication date and does not constitute legal or tax advice; applying it to a specific situation requires a qualified legal or tax professional.
Read next
Full pillar →Developed vs emerging markets: the risk-return profile
Developed markets (the economies in MSCI World) have deep, liquid capital markets and convertible currencies; emerging markets (the…
QE vs rate cuts: two different easing tools
Quantitative easing and rate cuts are both forms of monetary easing, but they act on different prices through…
Stablecoins vs CBDCs: private vs public digital money
A stablecoin is privately issued digital money pegged to a fiat currency, mostly the dollar, and backed by…