
Food Prices and Social Unrest (1990–2026): The Speed of the Rise, Not the Level Alone
Every major wave of food-linked unrest since 2008 — the 2008 food riots, the 2011 Arab Spring, the 2022 crises — struck while global food prices were surging by more than 28% a year. The same price levels, reached slowly or held as a plateau, have not been followed by comparable unrest.
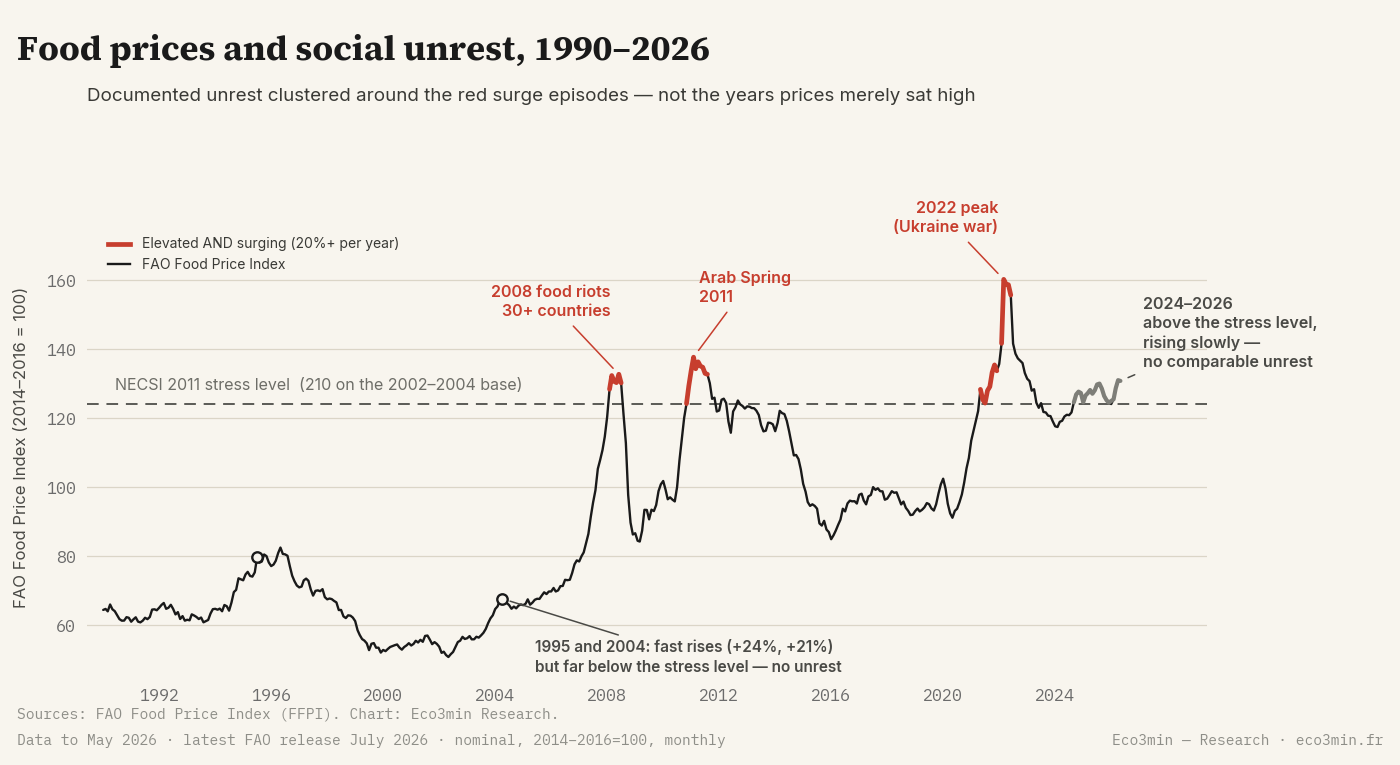
This study tests the most-cited claim in the food-security literature — the New England Complex Systems Institute (NECSI) 2011 “food price threshold” — against a consistent 1990–2026 FAO series. The threshold holds, but only as a backdrop: among the months when prices were already elevated, what separates the unrest episodes from the calm years is the speed of the rise, not how high the level sat.
This page documents the relationship between the FAO Food Price Index (FFPI) and documented episodes of food-linked social unrest from 1990 to 2026. It records where the index sat, in both nominal and inflation-adjusted terms, during the three major unrest clusters of the period, and quantifies the year-on-year rate of change at each. The dataset pairs the monthly FFPI and its five sub-indices with a curated, sourced list of documented unrest events, and derives a reproducible classification of the months when prices were both elevated and rising rapidly. It extends the NECSI (2011) analysis out of sample and onto a single consistent index base, and tests the reciprocal case — fast rises that occurred below the stress level.
Across 1990–2026 the FAO Food Price Index sat above its historical stress level (NECSI’s 210 on the 2002–2004 base, which rescales to 124.2 on the current 2014–2016 base) in 69 of 437 months (15.8%) — far more often than unrest followed. What distinguishes the three documented unrest clusters is speed: at each flashpoint the index was rising at +28% to +56% year-on-year, while the 25 elevated months that fall outside any unrest window — four in 2012, one in July 2023, and the run from September 2024 to May 2026 — never exceeded +7.8%. The exact surge cutoff does not matter: any threshold from 15% to 25% flags the same three periods. Speed alone is not sufficient either — the two fast rises that happened while the index sat below the stress level (July 1995, April 2004) were not followed by comparable unrest. This is a descriptive pattern across three clusters, not a statistically validated causal law; the FFPI measures global benchmark prices, not local retail prices (see Methodology and Limitations).
FFPI, nominal (2014–2016 = 100)
12-month change
stress level, but not surging
below the March 2022 record
FAO release of 7 August 2026. The analysed dataset and the charts below run through May 2026, the last month in the downloadable CSV; it is rebuilt at each monthly release.
- Every major food-linked unrest wave since 2008 struck while global food prices were surging by more than 28% a year — not merely while they were high. Measured at the month of each documented flashpoint, the FFPI was rising at +55.8% (April 2008), +28.3% (December 2010, the month of Bouazizi’s act) and +34.5% (March 2022). Readings at each episode’s price peak, which differ, are in the table below.
- The price level alone does not discriminate: the FFPI has sat above the NECSI stress level in 69 of 437 months (15.8%), and 25 of those months fall outside any documented unrest window — four in 2012, one in July 2023, and the stretch from September 2024 to May 2026 (interrupted only by January 2026, when the index briefly slipped back below).
- Those 25 elevated-but-calm months rose by at most +7.8% year-on-year (the peak was February 2025); the three unrest flashpoints all exceeded +28%. There is no overlap. Any surge threshold from 15% to 25% flags the same three periods, so the cutoff is not a tuned parameter.
- The reciprocal test. Speed alone is not sufficient either. Two months in the record show the index rising above +20% year-on-year while the level itself sat below the stress line and outside any run-up to a crisis: July 1995 (+24.0%, index 79.6) and April 2004 (+21.0%, index 67.7). Neither was followed by a documented unrest cluster. On this record the elevated level is a necessary backdrop and the fast rise is what separates the episodes within it.
- Robustness disclosure: the “stress level” is NECSI’s nominal 210 (2002–2004 base) rescaled to 124.2 on the current base; the 2020 FAO methodology change (a base change and a coverage expansion) makes this an approximation, discussed in full in Methodology.
- The July 2026 release put the FFPI at 131.1, its highest reading since January 2023 — and still 18.2% below the March 2022 record, rising just +1.0% year-on-year. A three-year high is exactly the kind of headline this page is about: on the historical pattern the level is elevated and the pace is calm, which is the regime that has not been followed by comparable unrest. The last month in the analysed dataset, May 2026, read 130.8 and +2.9%.
- Reproducible from the FAO Food Price Index (nominal and MUV-deflated real, 1990–2026) and a sourced event list; released under CC BY 4.0.
437 observations · Monthly · Jan 1990–May 2026 · CC BY 4.0
Methodology · Cite this dataset
monthly observations (1990–2026)
nominal record, March 2022
of months above the stress level
fastest 12-month surge on record (March 2008)
ceiling of every elevated-but-calm month
documented unrest clusters (2008, 2011, 2022)
The index and the unrest record
The chart plots the FAO Food Price Index monthly from January 1990 to May 2026. The horizontal dashed line marks the stress level — the level NECSI (2011) identified as a threshold for heightened unrest risk, translated onto the current index base. The index has crossed that line repeatedly, but the red segments highlight only the months when prices were both above the line and rising by at least 20% year-on-year. Those red episodes line up with the documented unrest clusters; the stretch from September 2024 to May 2026, above the line but gray, is the period when prices were high but rising slowly.
The pattern is easier to read as a contrast than as a rule. Read the raw FAO series alongside its inflation-adjusted twin in our companion study on real commodity prices since 1960, and the underlying components in the wheat, rice and palm oil dataset pages.
The consensus: high prices, food riots
The dominant reading is intuitive and well-supported. When food becomes unaffordable, populations that spend a large share of income on it are pushed toward the margin of survival, and governments perceived as responsible for food security lose their footing. History offers a long catalogue, from the European bread riots of 1848 onward.
The most-cited modern formulation is quantitative. Researchers at the New England Complex Systems Institute found that the timing of the 2008 food riots and the 2011 Arab Spring coincided with peaks in the FAO index, and identified a specific level — 210 on the index, on its then-current 2002–2004 base — above which unrest became statistically likely. The finding drew attention partly because the authors had submitted a report to the U.S. government on 13 December 2010 warning of the food-price/instability link — four days before Mohamed Bouazizi’s self-immolation in Tunisia on 17 December. During the 2008 peak, the same work counted more than 60 food riots across 30 countries, ten of which involved multiple deaths. As reported in the FAO Food Price Index.
The econometric literature has since sharpened the claim rather than dropped it. Bellemare (2015), using monthly international data and natural disasters as an instrument, finds that increases in the level of the world food price index cause increases in social unrest, while price volatility does not. That is a stronger version of the level story than NECSI’s, and this page is written against it as much as against the threshold.
On a short window, the level story looks decisive: the two great index peaks of the period coincided with the two great unrest waves. The question this dataset asks is whether the level is what did the work, once the full 1990–2026 record is on a single consistent base.
What the data shows: speed, not level
First, the level threshold cries wolf. On the consistent current-base series, the FFPI has sat at or above the rescaled stress level (124.2) in 69 of 437 months — 15.8% of the record. Those months are not confined to the unrest years: 25 of them fall outside any documented unrest window — four months in 2012 (February, March, April and September), one in July 2023, and the stretch from September 2024 to May 2026, which is continuous except for January 2026, when the index dipped just below the line. None of them was followed by an unrest cluster comparable to 2008 or 2011. Being above the level is common; unrest is not.
Second, the unrest episodes share a different signature — pace. At each documented flashpoint the index was climbing steeply: +55.8% year-on-year in April 2008, +28.3% in December 2010 (the month of Bouazizi’s act), and +34.5% at the March 2022 record. By contrast, across the 25 elevated-but-calm months, the twelve-month change never exceeded +7.8% (February 2025). The two groups do not overlap in pace: the calm elevated months stayed at or below +7.8%, the unrest flashpoints at or above +28%. And the surge cutoff is not a tuned parameter — drawn anywhere from 15% to 25%, it flags the same three periods and excludes the same calm months. Related framing: our study on agricultural commodities.
Third, the mechanism is a shock, not a price tag. A rapid surge signals a supply disruption still unfolding — a harvest failure, an export ban, a war — that outruns the ability of households and governments to adjust. A high but stable price has, by definition, already been absorbed: budgets have re-anchored, substitutions have been made, subsidies have been set. Grouping the above-stress months by documented outcome, the ones inside a documented unrest window ran at a mean of +23.7% year-on-year (44 months), against +1.5% for the calm elevated months (25 months). Speed is the axis on which they separate.
Fourth — and this is the limit of the finding — speed on its own does not do it either. Running the test in reverse, the record contains two months when the index was rising at more than +20% year-on-year while the level itself sat well below the stress line, and outside the run-up to any later crisis: July 1995 (+24.0%, index at 79.6) and April 2004 (+21.0%, index at 67.7). Neither was followed by a documented unrest cluster. The honest formulation is therefore joint rather than exclusive: on this record an elevated level looks like a necessary backdrop, and the speed of the rise is what separates the episodes that erupted from the ones that did not. What the data contradicts is the level threshold used alone, not the relevance of the level.
A methodology break sits in the middle of the record. The FAO rebased the index in 2020 — from a 2002–2004 base to a 2014–2016 base — and simultaneously expanded its underlying price coverage. NECSI’s 210 threshold was defined on the old base, so its translation onto the current base (124.2) is a rescaling, not an exact equivalence. The qualitative finding — surges, not levels alone — does not depend on the precise cutoff.
What this dataset does not measure. The FFPI tracks a basket of internationally traded food commodities at world benchmark prices. It does not measure the retail prices households actually pay, which are shaped by local currencies, subsidies, tariffs and domestic supply. During the Tunisian revolution the FAO’s own on-the-ground monitoring reported that domestic consumer food prices were broadly stable, and Tunisia’s consumer food price index slipped slightly between November and December 2010 — even as the international index set records.
Across 1990–2026, food prices above the stress level preceded unrest only when they were also rising fast. The same levels, reached slowly or held flat, did not — which is why the global food index has spent much of the 2020s in the stress zone without a comparable wave. And fast rises from a low base (1995, 2004) did not either: on this record it takes both.
Where the sceptics are right
The strongest objection: a published, instrumented result points the other way. Bellemare (2015), in the American Journal of Agricultural Economics, uses natural disasters to instrument for food prices and finds that increases in the world food price level cause increases in social unrest, while price volatility does not — a result robust to real versus nominal prices, to commodity-specific indices, and to alternative definitions of volatility. That is a properly identified causal estimate on a continuous outcome; this page is a descriptive overlay on three curated clusters, and where they conflict the econometrics should win. Two things keep the present finding standing. Volatility is not speed: Bellemare’s measure is the variance of the price distribution, whereas the variable here is the signed twelve-month rate of change, and a steady fast climb has high speed and low volatility. And his level result is about increases in the level, which is not the same as the threshold claim this page tests. The fair reading is that the two are compatible: the level matters, and among elevated months the pace of the rise is what discriminates.
The strongest mechanical objection: the index may be a symptom, not a cause. Todd Smith’s study of urban Africa argues that domestic consumer prices — not the international index — are the variable that actually moves people, and that rainfall scarcity works better as an instrument, implying that a common driver (weather, supply) can produce both the price surge and the unrest. On this view the FFPI is a real-time barometer of stress that happens to move first, not the lever itself. The speed finding is consistent with that: a fast surge is exactly what a fresh supply shock looks like in the index.
The sample is small, and the outcome variable is curated. Three documented clusters in thirty-six years is a pattern, not a statistically validated law, and the unrest windows here are compiled from Lagi et al. (2011) and the cited sources rather than drawn from a comprehensive event database — comprehensive event data (ACLED) is licensed and not redistributed here, which is a real limitation, not a technicality. Because the windows are curated, the fact that all 44 window months also sit above the stress level should be read as a property of how the windows were drawn, not as an independent result. This dataset offers a descriptive overlay of a sourced event list against a price series, not a regression with confidence intervals.
The 2022 case is the weakest of the three. The most prominent 2022 collapse — Sri Lanka, where mass protests drove President Gotabaya Rajapaksa to flee on 13 July 2022 — was largely domestic in origin: a 2021 ban on chemical fertiliser that gutted local harvests, a debt and foreign-exchange crisis, and the loss of tourism. The global surge amplified an already-collapsing domestic food situation rather than causing it — which is precisely the “contributing amplifier, not sole trigger” framing this study defends.
And the level story’s own forward call did not hold — instructively. NECSI extrapolated that the rising trend would cross into “high impact even without price peaks” in 2012–2013. The index did sit above the threshold in 2012, but prices were flat to falling, and no comparable wave followed. That is the level thesis’s sharpest miss — and the speed finding explains it: 2012 was a plateau, not a surge.
Unrest frequency by regime
The natural forward object here is not a market return but the frequency of documented unrest conditional on the price regime. With only three clusters, this is descriptive and heavily caveated — the counts are small and the classification of what constitutes a “cluster” is a judgement disclosed in Methodology.
“elevated AND surging” periods coinciding with documented unrest
elevated-but-calm months followed by a comparable wave
fast rises below the stress level (1995, 2004) followed by a comparable wave
At the 20% cutoff the “elevated AND surging” flag produces four contiguous runs — February–July 2008, November 2010–August 2011, May–December 2021 and February–June 2022 — which map onto three unrest clusters, since the 2021 and 2022 runs are one episode split by a brief dip below the cutoff. At a 15% cutoff those two merge and the count is three runs; at 25% it is four again. The three periods flagged are the same across the whole 15–25% range; only how they are cut into runs changes.
Read directionally, not as a probability: when the index has been both above the stress level and rising at 20%+ a year, documented unrest has followed within months in every case on record; when it has been above the level but rising slowly, or rising fast from a level well below the line, it has not.
Past patterns are not predictive of future outcomes. Regime-conditional frequencies describe a small historical record across three clusters, not expected probabilities.
Levels to Watch
These reference points describe where the current reading sits against the historical record. They are descriptive markers for reading future FAO releases, not signals or targets.
Above the 124.2 stress level and the highest reading since January 2023, but still 18.2% below the March 2022 record of 160.2. Being above the level has, on its own, not been associated with unrest in the historical record.
Well inside the calm-elevated band, and slower than the +2.9% recorded in May. In the historical record, unrest clusters coincided with readings above +28%; a sustained move into that range would mark a shift from the current regime.
The 25 elevated months outside any unrest window — four in 2012, one in July 2023 and the 2024–2026 stretch — never exceeded +7.8% year-on-year; the three unrest flashpoints all exceeded +28%. A sustained move above +20% a year would mark a shift from the current stable regime toward the surge regime.
Cereals led the 2008 surge; vegetable oils led 2011 and 2022. Which component is rising fastest identifies the nature of the supply shock (see the attribution chart below).
The three clusters, side by side
Each row records the FFPI at the episode’s peak, in nominal and inflation-adjusted terms, its twelve-month rate of change, and the sub-index that led the move. The twelve-month change here is measured at the price peak, which is later than the flashpoint month quoted in the summary above — hence the different figures.
| Episode | Peak (nominal) | Peak (real, MUV) | 12-month change at peak | At flashpoint | Leading sub-index | Documented unrest |
|---|---|---|---|---|---|---|
| 2008 (peak Jun 2008) | 132.7 | 129.1 | +45.2% | +55.8% (Apr) | Cereals (+74%) | 60+ food riots, 30 countries |
| 2010–11 (peak Feb 2011) | 137.7 | 124.1 | +38.7% | +28.3% (Dec 2010) | Vegetable oils (+63%) | Arab Spring; regional food riots |
| 2021–22 (peak Mar 2022) | 160.2 | 136.5 | +34.5% | +34.5% (Mar) | Vegetable oils (+58%) | Sri Lanka collapse; scattered protests |
| May 2026 (last dataset month) | 130.8 | 112.7 | +2.9% | — | — | None comparable |
Peak values are the highest FFPI reading within each episode window. Leading sub-index is the FAO component with the highest year-on-year change at the peak month. For 2021–22 the peak and the flashpoint are the same month. The last row is the final month of the analysed dataset; the July 2026 FAO release, published after the dataset was built, read 131.1 (+1.0% year-on-year).
What drove each surge

The 2008 spike was a grains-and-rice event; the 2011 and 2022 surges were led by vegetable oils, with 2022 compounded by the disruption of Ukrainian and Russian exports. The common thread is not a single commodity but the pace of the aggregate move. The individual components are tracked in the corn and sugar dataset pages, and the broader commodity picture in the commodity price hub.
Same level, opposite speed

Each dot is one month. To the right of the stress line — the same range of high price levels — the months of documented unrest (red) sit high on the vertical axis, while the elevated-but-slow months (including the last dataset month, circled) sit near zero. The horizontal position (how high) does not separate them; the vertical position (how fast) does. Note also the top-left of the plot: the months of July 1995 and April 2004 sit high on speed but far to the left of the stress line, and neither was followed by a documented cluster — which is why the reading here is joint rather than “speed alone.”
Historical turning points
2007–2008 — The grains and rice spike
The FFPI rose at its fastest pace on record, reaching +63.2% year-on-year in March 2008, and peaked at 132.7 in June 2008, led by cereals (+74% year-on-year). Food riots followed across more than 30 countries. Prices then fell sharply as the global financial crisis took hold, dropping back below the stress level by late 2008.
2010–2011 — The Arab Spring window
The index climbed back above the stress level from late 2010, rising +28.3% year-on-year by December 2010 and peaking at 137.7 in February 2011 (+38.7%), led this time by vegetable oils. The Tunisian and Egyptian uprisings unfolded through this window, though — as the domestic-price evidence shows — the international index and local retail prices diverged. The level then declined gradually through 2012 without a comparable wave, even while it briefly remained above the stress line.
2021–2022 — The wartime record
Post-pandemic supply strains and then the Russian invasion of Ukraine drove the FFPI to an all-time nominal high of 160.2 in March 2022 (+34.5% year-on-year), led by vegetable oils (+58%). Documented unrest was more concentrated than in 2008 or 2011 — most prominently Sri Lanka’s collapse — and, in that case, largely domestic in origin. Prices have since receded.
The quiet surges: 1995 and 2004
Twice in the record the index rose faster than +20% year-on-year without the level ever approaching the stress line: July 1995, when the index reached 79.6 on a +24.0% twelve-month rise, and April 2004, at 67.7 on +21.0%. Neither episode is associated with a documented unrest cluster. They are the closest thing this record offers to a falsification test of speed taken on its own, and they are the reason the finding here is stated as a joint condition.
2026 — Current observation
May 2026, the last month in the analysed dataset, read 130.8: above the stress level but rising only +2.9% year-on-year, and 18.4% below the 2022 record. In real (MUV-deflated) terms it was 112.7, well below its 2022 peak of 136.5. The FAO release of 7 August 2026 put July at 131.1, up 0.6% on June and the highest reading since January 2023, driven by cereals, vegetable oils and sugar while meat and dairy fell; year-on-year the index was up just 1.0%, and it remained 18.2% below the March 2022 peak. On the historical pattern this is the elevated-but-stable regime: a high level, a slow pace, no surge signature. Whether it stays that way depends on the physical side — harvests, energy inputs, fertiliser — the terrain of the reading of commodities as regimes.
Methodology
The series is the FAO Food Price Index and its five sub-indices (cereals, vegetable oils, dairy, meat, sugar), monthly from January 1990 to May 2026, in both nominal and real terms. The real index is deflated by the World Bank Manufactures Unit Value (MUV) index — the standard deflator for a global commodity index — both on the current 2014–2016 = 100 base. Year-on-year change is the twelve-month percentage change of the nominal index.
The stress level and its caveat. NECSI (2011) identified 210 on the FAO index as an unrest threshold, defined on the index’s then-current 2002–2004 base. To place it on the current 2014–2016 base, we rescale by the ratio of the two base-period averages: the 2002–2004 average is 59.15 on the current base, giving a factor of 0.5915 and a rescaled threshold of 124.2. Because the FAO’s 2020 revision changed the base and expanded price coverage, this is an approximation rather than an exact equivalence; we disclose it rather than present a false precision. The qualitative result does not depend on the exact figure.
Regime and episode definitions
The 20% surge cutoff is not tuned. Set anywhere from 15% to 25%, the “elevated AND surging” flag identifies the same three periods — 2008, 2010–11 and 2021–22 — and excludes the same calm months; only the number of contiguous runs changes, because the 2021–22 episode splits in two above a 20% cutoff and merges below it. The 25 elevated months outside any unrest window never exceeded +7.8% year-on-year, while the three unrest flashpoints all exceeded +28%, so the exact cutoff between them is immaterial. Documented unrest windows are curated from the sourced event list (below), not derived from prices: 2008 (Feb–Jul), 2010–11 (Nov 2010–Nov 2011) and 2021–23 (the 2021 surge through the 2022 protests). Because those windows were drawn around the episodes, every window month also happens to sit above the stress level; that is a property of the curation, and is disclosed here rather than presented as a result.
Filter Definitions
Dataset Design
| Variable | Type | Unit | Source | Calculation |
|---|---|---|---|---|
| ffpi | float | index (2014–16=100) | FAO | direct |
| rffpi | float | index (2014–16=100) | FAO | MUV-deflated |
| cereals / oils / sugar / meat / dairy | float | index | FAO | direct |
| ffpi_yoy | float | % | FAO | 12-month % change |
| above_stress / surge / danger | int (0/1) | flag | Eco3min | see definitions above |
| unrest_window | int (0/1) | flag | Eco3min | curated, sourced |
Python Reproduction Code
# Reproduce from the FAO Food Price Index workbook (CC BY 4.0)
import pandas as pd
url = "https://www.fao.org/.../food_price_indices_data.csv"
df = pd.read_csv(url, parse_dates=["date"])
df["ffpi_yoy"] = df["ffpi"].pct_change(12) * 100
STRESS, SURGE = 124.2, 20
df["danger"] = (df.ffpi >= STRESS) & (df.ffpi_yoy >= SURGE)
# reciprocal test: fast rises that happened below the stress level
df["fast_but_low"] = (df.ffpi < STRESS) & (df.ffpi_yoy >= SURGE)
Download the Dataset
The CSV contains the monthly FFPI, its five sub-indices, the real (MUV-deflated) index, the twelve-month change, and the regime flags, alongside a second sheet in the XLSX with the sourced unrest-event list and a data dictionary. Released under CC BY 4.0 — free to reuse with attribution to Eco3min Research.
This study sits within Eco3min’s commodity coverage. Explore the underlying series — the commodity price data hub.
Data Sources & References
- Primary FAO, Food Price Index (nominal and real, 2014–2016 = 100, monthly from 1990), dataset retrieved June 2026, covering January 1990 to May 2026. Licence CC BY 4.0.
- Primary FAO, Food Price Index monthly release of 7 August 2026 (July 2026 reading) — used for the current observation only.
- Research Lagi, M., Bertrand, K. Z., & Bar-Yam, Y. (2011). The Food Crises and Political Instability in North Africa and the Middle East. arXiv:1108.2455.
- Research Bellemare, M. F. (2015). Rising Food Prices, Food Price Volatility, and Social Unrest. American Journal of Agricultural Economics, 97(1), 1–21. doi:10.1093/ajae/aau038.
- Research Smith, T. G. (2014). Feeding Unrest: Disentangling the Causal Relationship between Food Price Shocks and Sociopolitical Conflict in Urban Africa. Journal of Peace Research, 51(6), 679–695.
- Research Raleigh, C., Choi, H. J., & Kniveton, D. (2015). The Devil is in the Details. Global Environmental Change, 32, 187–199.
- Context FAO GIEWS bulletin, Tunisia (31 January 2011); New Security Beat / Stimson Center (2014) on international-vs-local prices.
- Context USIP and UK House of Commons Library (2022) on the Sri Lankan economic crisis and Aragalaya protests.
Limitations
- Global, not local. The FFPI is a world benchmark price; it does not capture the retail prices households pay, which reflect currencies, subsidies and domestic supply.
- Base and coverage break. The 2020 rebasing changed both the base and the price coverage, so the rescaled threshold (124.2) is an approximation of NECSI’s original 210.
- Small sample. Three documented clusters in thirty-six years support a descriptive pattern, not a statistically validated causal relationship.
- Curated event list, and what follows from it. The unrest overlay is a sourced but non-exhaustive list of documented events, not a comprehensive unrest dataset; comprehensive event data (e.g. ACLED) is licensed and not redistributed here. Because the windows were drawn around known episodes, the alignment between window months and above-stress months is partly built in.
- Speed is not the whole story. Two fast rises below the stress level (1995, 2004) were not followed by unrest, so the level is not dispensable; the finding is a joint condition, not a replacement of level by speed.
- Correlation, not causation. A common driver (weather, supply shocks) may produce both the price surge and the unrest; the index may be a coincident barometer rather than a cause. A properly instrumented study (Bellemare, 2015) finds a causal effect running from price levels to unrest.
- Backward-looking. The record documents what happened; it is not a forecast.
Frequently Asked Questions
What is the food price “threshold” for unrest?
How high are global food prices in 2026?
Doesn’t published research find that price levels, not volatility, drive unrest?
Isn’t this just correlation? Couldn’t drought or war drive both prices and unrest?
Does this measure what people actually pay for food locally?
Can I reuse the dataset?
Eco3min Research (2026). Food Prices and Social Unrest (1990–2026): The Speed of Surges, Not the Price Level. Eco3min. https://eco3min.fr/en/food-price-speed-not-level/ — Underlying data: FAO Food Price Index; event list per Lagi et al. (2011) and cited sources. Licence: CC BY 4.0.
Related research
Last updated — 15 September 2026
Disclaimer – Financial Information: The analyses, commentary, and content published on eco3min.fr are provided for informational and educational purposes only. They do not constitute investment advice or a solicitation to buy or sell financial instruments. Past performance is not indicative of future results. All investment decisions involve risk and are the sole responsibility of the reader.