
Agricultural Commodities
Commodities & the global economy — Sub-pillar
A deposit is pumped or mined at a largely controllable pace. Inventories build without rapid decay, cushioning shocks and shortening the lag between a price signal and a supply response.
A harvest is decided a season ahead and only revealed at gathering. Storage is costly or impossible for perishable goods, and weather can erase output that price will not restore until the next cycle.
Oil and metals dominate how most people picture commodities, but a third family runs on a fundamentally different supply logic. Coffee, cocoa, sugar, wheat, corn, soybeans, rice, cotton and palm oil share a trait neither energy nor metals possess: their output is biological. You do not “decide” a harvest the way you open a valve — you plant a season ahead, you are at the mercy of the weather, and you gather whatever nature returns. This sub-pillar gathers that family — tropical softs, grains and oilseeds, fibres — and frames how its prices behave. On the same theme, see food prices and social unrest.
Eco3min’s lens is descriptive: agricultural prices read as signals — climate stress, supply tightness, pass-through to food inflation, producer concentration — not as allocation instructions. To place this family alongside the others, see the comparison of energy, metals and agricultural commodities.
The biological lag: why agriculture is the most cyclical family
The intuition is old and long formalised. The cobweb theorem — the term coined by Nicholas Kaldor in 1934 and formalised by Mordecai Ezekiel in 1938 (The Cobweb Theorem, Quarterly Journal of Economics) — captures the agricultural mechanism precisely: when this season’s supply depends on last season’s price, the market does not dampen shocks, it perpetuates them. A high price one year encourages more planting; the abundant harvest that follows pushes prices down; the discouragement then cuts acreage, and the shortage that follows reignites the rise. Plotted, that path traces a spiral — the “cobweb” that names the model. Kaldor already cited two agricultural examples, corn and rubber; the canonical empirical case remains the hog cycle. Cattle run the same loop on a longer clock, which is how the US cattle herd fell to a 75-year low while beef set records.
Three physical properties deepen this lag and set agriculture apart from energy and metals. First, the length of the production cycle: one season for annuals, but three to five years for a coffee or cocoa tree to bear. Second, perishability: carrying stocks from one crop year to the next is limited or costly, depriving the market of the buffer that smooths energy prices. Third, weather dependence: frost, drought, a weak monsoon or an El Niño episode shift supply from one season to the next, and no drilling can offset it. The cobweb dynamic applied to agricultural cycles, the role of inventories in price formation and the time asymmetry of commodity price formation are developed in dedicated analyses; the general framework sits in the commodity price formation sub-pillar.
Three food-price regimes since 2007
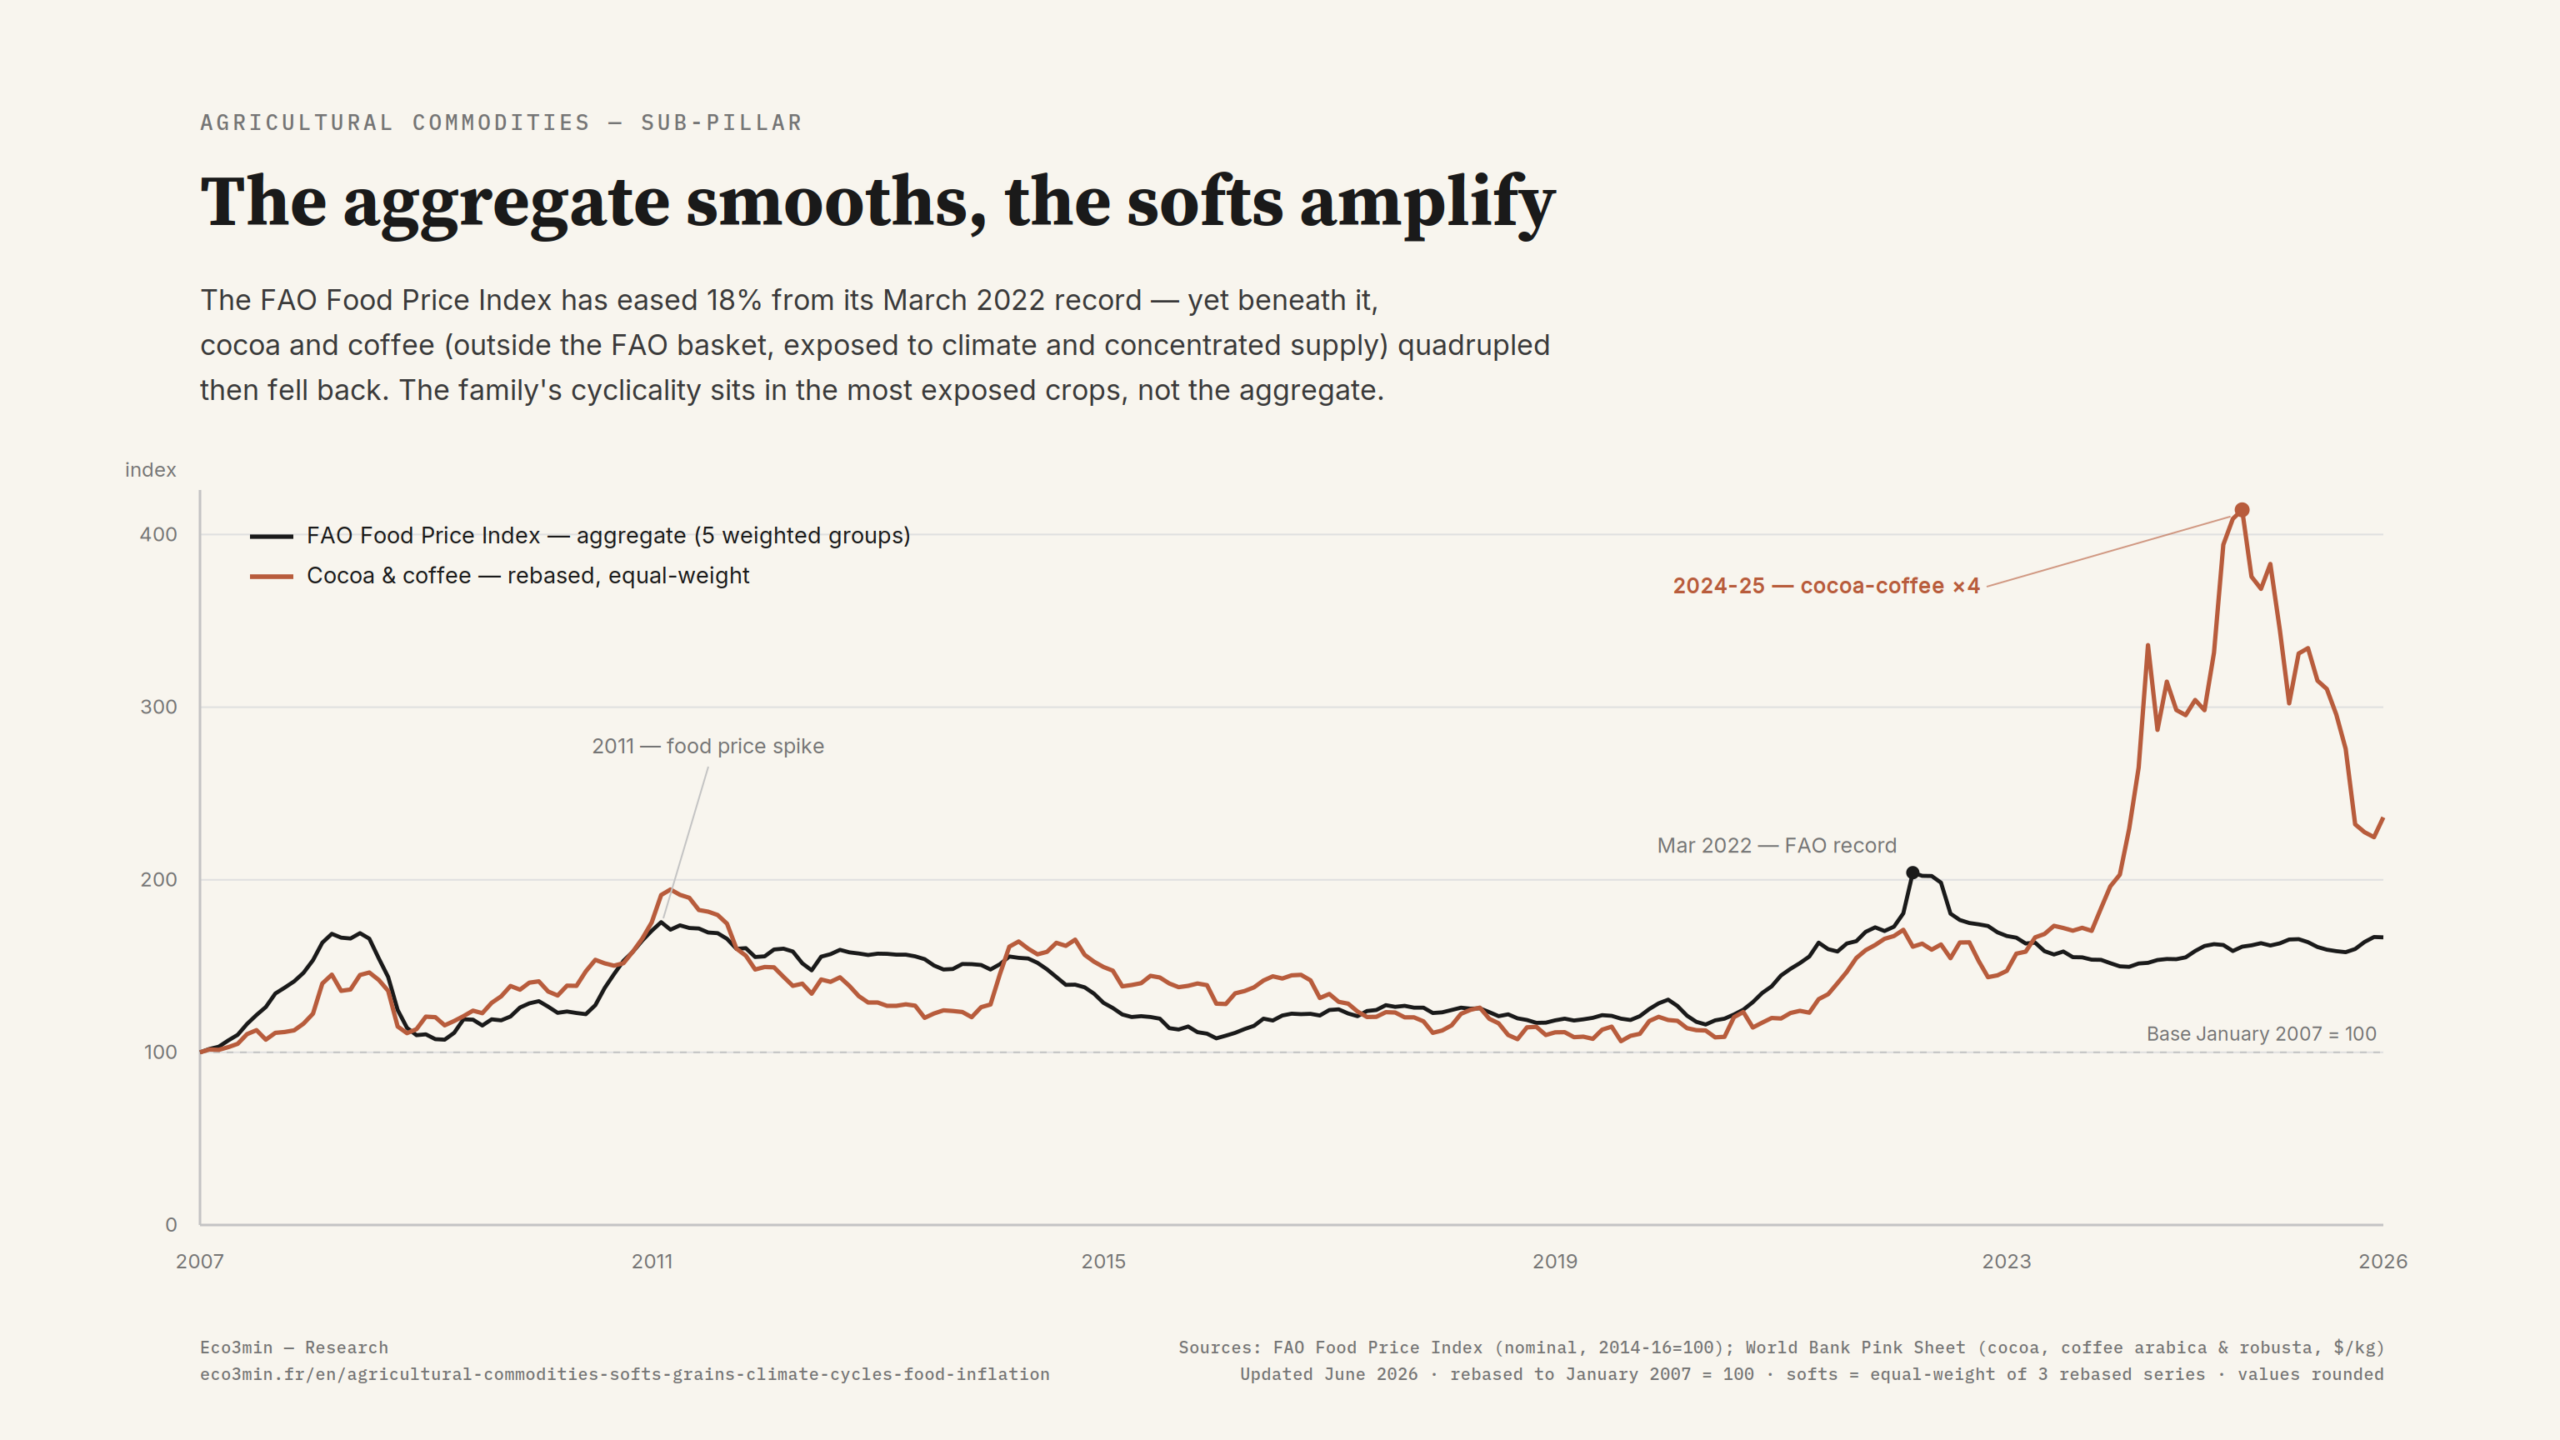
After decades of falling real prices — the Green Revolution and productivity gains had entrenched a long regime of abundance — agricultural markets have moved through a succession of tighter regimes since 2007. The FAO Food Price Index, which tracks international prices of cereals, vegetable oils, dairy, meat and sugar, provides the through-line.
Two spikes: 2007-2008 and 2010-2011
Poor harvests, biofuel demand and export curbs compound. The food riots are a reminder that an agricultural price is a political variable.
Two close spikes (2007-2008, then 2010-2011) lifted the FAO index to a peak in 2011 — its highest since the series began in 1961 up to that point (FAO). Methodology detailed in the FAO Food Price Index. The mechanics combined harvest shocks, rising biofuel demand and, above all, a cascade of export restrictions: from October 2007 Vietnam and then India curbed rice sales, followed in early 2008 by Egypt, China and Cambodia. Several academic studies estimate this panic raised prices 13 to 40% beyond what fundamentals warranted (Headey, 2011). It is the moment opinion rediscovered that the price of a staple is not merely a market number: the food tensions of 2008 and the 2011 instability across North Africa were directly tied to it.
The all-time high of March 2022
Post-pandemic logistics disruption, then the invasion of Ukraine, drove the FAO index to its highest reading on record — led by vegetable oils and cereals.
The FAO index hit its all-time high in March 2022, around 159.7 points (FAO), surpassing the 2011 peak. The invasion of Ukraine was the immediate trigger: Russia and Ukraine together supply close to 30% of world wheat exports and about a fifth of maize, with Ukraine also the leading exporter of sunflower oil (FAO). The vegetable-oil sub-index jumped in the shock month, as did cereals. Concentrated exportable supply turns a regional conflict into a global price shock — a mechanism that recurs, to varying degrees, across most staples. This case is unpacked in our account of the 2024-2026 cocoa price crash.
The divergence: the index eases, softs surge
The aggregate retreats, but cocoa, coffee and rice break away on weather and export curbs. The signal has shifted from the whole basket to the exposed crops.
Since 2022 the FAO index has eased: by mid-2026 it sits roughly 18% below its March 2022 peak (FAO). But that aggregate calm masks a divergence. Cocoa rose from about $4,200/t in early 2023 to nearly $12,000/t by late 2024 (ICCO), as West African crops were hit by heavy rain and then dryness; Ghana’s 2023/24 harvest was its weakest in fifteen years (COCOBOD). Rice broke higher after India’s ban on non-basmati white rice exports (July 2023 to September 2024), which lifted the Thai benchmark price by more than 20% (IFPRI), against an El Niño backdrop. The regime lesson is clear: when the aggregate calms, the meaningful signal migrates to the crops most exposed to climate and to concentrated supply. The dedicated analysis sits in our breakdown of the arabica-robusta spread as a supply-stress signal.
Five structural features of agricultural markets
Beyond the episodes, five mechanisms recur in agricultural price formation across products. They frame the clusters to come and provide the common lens for the whole family.
Five recurring forces — from the biology of supply to the geopolitics of food security.
Supply answers yesterday’s price (the cobweb theorem). The lag runs from one season for annuals to several years for perennials — coffee, cocoa, rubber.
Agricultural cycles & the cobweb →Frost, drought, El Niño or a weak monsoon shift supply from one season to the next. For agriculture, climate is the shock variable that geology is not for metals.
Many goods keep poorly; carrying stocks is expensive. The inventory buffer that smooths energy prices works far less well here.
Inventories & price formation →West Africa holds ~70% of cocoa (ICCO); Indonesia and Malaysia ~85% of palm oil; India ~40% of rice exports (USDA). A local disruption becomes a global shock.
The role of producing countries →Crop prices feed, with a lag, into the food component of consumer price indices — the channel through which a harvest shock reaches purchasing power.
Food inflation (HICP, data) →When food becomes a weapon: the geopolitics of supply
Geographic concentration creates more than weather risk — it hands producing states a lever. Facing a domestic price shock, the recurring reflex is the export restriction, which shields the national consumer at the cost of worsening the global shortage. Indonesia, which supplies around 60% of world palm oil (Malaysia about 25%), suspended exports from 28 April to 23 May 2022 to cool the domestic price of cooking oil — one of the largest acts of agricultural protectionism since the invasion of Ukraine. India did the same on rice from July 2023.
The trouble is that these moves are contagious: each restriction lifts the world price and prompts the neighbour to protect itself in turn, exactly as in 2007-2008. The agricultural price then becomes a matter of foreign policy as much as a market signal — a dimension detailed in the analysis of the role of producing countries and, more broadly, in the framework of commodity price formation, which formalises the gap between physical reality and market expectations.
Three signals to watch
More than any single spot price, three structural indicators give a more reliable read on the regime.
The stocks-to-use ratio. Tracked by the FAO, it measures the cushion available against demand; for cereals it stood around 30% in 2024/25 (FAO), a level judged comfortable. A contracting ratio is, for a storable good, the best early warning of coming tightness — the agricultural counterpart of what inventories signal for other commodities. Related framing: our study of the wheat price as a forward instability signal.
The climate cycle (ENSO). The El Niño / La Niña oscillation governs rainfall across the major producing zones of Asia and the Americas. The 2023-2024 El Niño weighed on rice and sugar crops and fed expectations of restriction. For a family whose supply is biological, the climate calendar is a leading indicator in its own right. Its owner holds that same biological supply, one season at a time, which is farmland as a claim on the same crops the futures market prices.
Export restrictions. Their appearance — especially from a dominant supplier — is the starkest sign of a regime shift: it reveals that a government deems domestic tightness more pressing than its trade commitments, and it often triggers a cascade. It is the marker to watch beyond the price level alone.
Reading an agricultural spike as a single signal. A sharp move in coffee or wheat can reflect climate stress in a producing region, tightness entrenched by cobweb dynamics, an export curb, or the start of a pass-through to food inflation — often several at once. The meaningful signal is not the price of one isolated crop, but the whole configuration: harvest, stocks, weather, geographic concentration and the trade policy of the large producers. When the produce is bottled and traded as a collectible, the same concentration logic applies, which is a market where most of the volume sits in a handful of names.
The agricultural families and their data
The in-depth analyses (coffee, cocoa, sugar, wheat…) are under construction. Each product already has a historical price series to draw on.
- CoffeeArabica · RobustaCluster coming
- CocoaCluster coming
- SugarPrice seriesCluster coming
- WheatPrice seriesCluster coming
- CornPrice seriesCluster coming
- SoybeansPrice seriesCluster coming
- RicePrice seriesCluster coming
- CottonPrice seriesCluster coming
- Palm oilPrice seriesCluster coming
- RubberPrice seriesCluster coming
- TeaPrice seriesCluster coming
Last updated — 18 September 2026
Disclaimer – Financial Information: The analyses, commentary, and content published on eco3min.fr are provided for informational and educational purposes only. They do not constitute investment advice or a solicitation to buy or sell financial instruments. Past performance is not indicative of future results. All investment decisions involve risk and are the sole responsibility of the reader.
Read next
Full pillar →Ukraine War 2022: The Grain Corridor and the Wheat Supply Shock
The invasion of Ukraine in February 2022 blocked the Black Sea grain ports and deprived the world market…
2007-2008: The First Modern Global Food Crisis
In 2007-2008, the world faced its first food crisis of truly global scope. The surge in grain prices,…
The Black Sea Breadbasket: Export Concentration as a Structural Chokepoint
Over two decades, the Black Sea has become the decisive breadbasket of the world wheat market. That ascent…