
How to Invest in AI: Mapping the Exposure Routes, from Chips to Indices
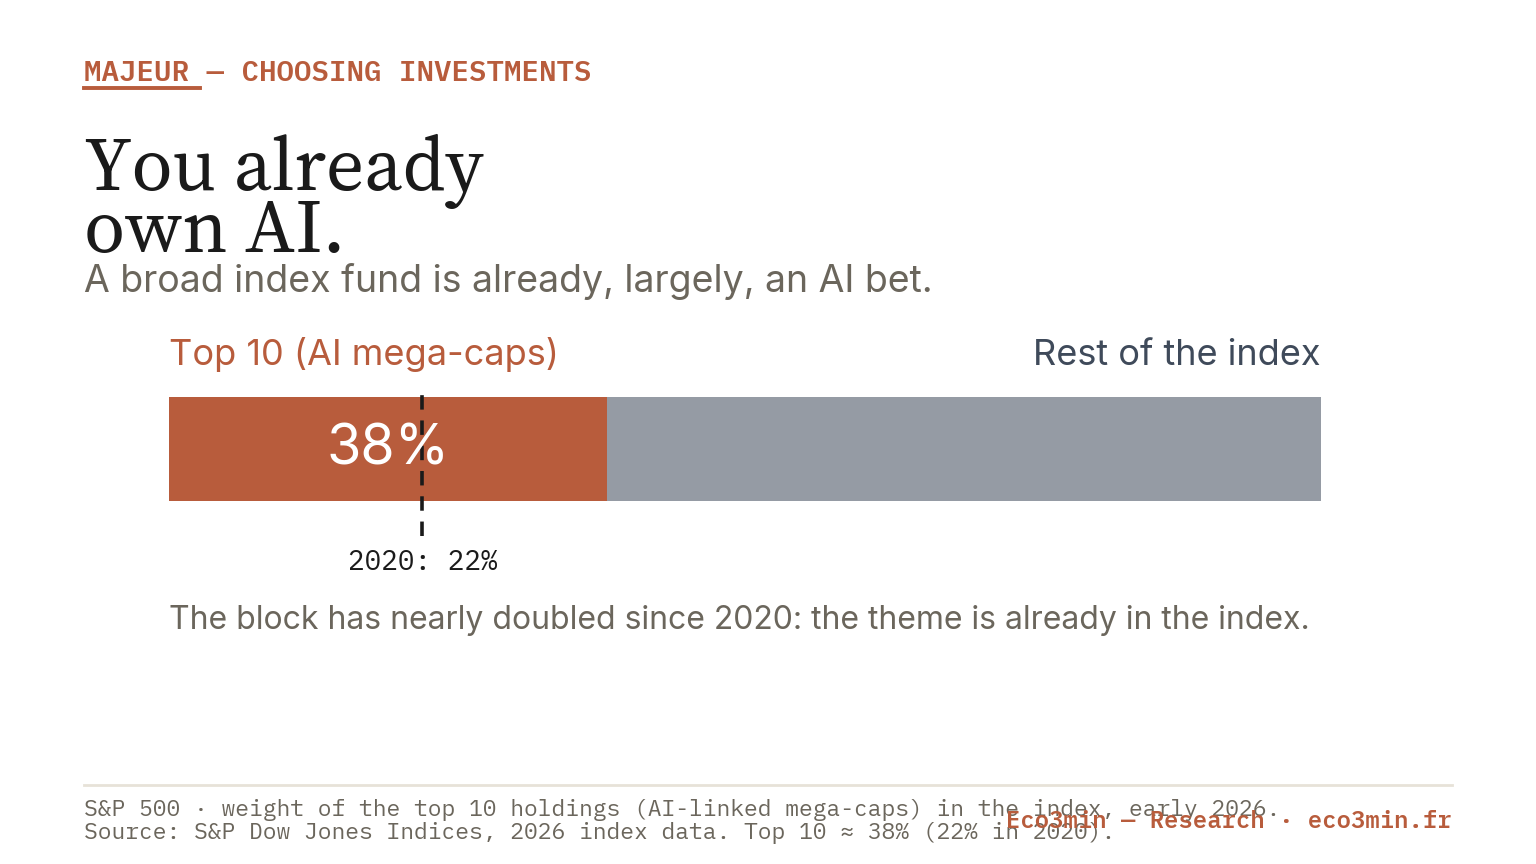
Before choosing a way into AI, measure the exposure you already hold: a broad index fund is largely an AI bet already.
- The ten largest S&P 500 companies made up roughly 38% of the index in early 2026, up from about 22% in 2020, and the Magnificent Seven alone were about 32.5% in July 2026 (S&P data).
- AI exposure reads as a four-layer chain, chips, cloud infrastructure, models and software, and adopters, not as a list of names to pick.
- A thematic AI ETF concentrates far more, often the majority of the fund in a handful of names, and overlaps heavily with what a broad index already holds.
There are three real routes to AI exposure: a broad index fund, a thematic AI ETF, or private and venture vehicles most investors cannot reach. The first question is not which to buy, but how much AI you already own.
The thematic pitch is to buy the AI ETF. That framing skips the step that matters: a market-cap-weighted index is now so concentrated in mega-cap technology that most investors already hold a large AI position. This page maps the routes and the overlap, not a name to buy.
You are probably already exposed
A broad index fund is already an AI bet. Because a market-cap-weighted index gives the biggest companies the biggest slices, and because the biggest companies are the mega-cap technology names driving the AI build-out, owning the index means owning the theme. The numbers make the point concrete: the ten largest companies in the S&P 500 made up roughly 38% of the index in early 2026, against about 22% in 2020, and the Magnificent Seven alone stood near 32.5% in July 2026. A global index fund does not escape this, because it is majority-US and carries the same names at its top. The practical implication is that measuring what you already hold comes before choosing any new route, and the reference for placing a concentrated, valuation-sensitive theme inside a portfolio is the sub-pillar on reading an investment choice through the regime.
The four-layer value chain as a reading grid
The useful way to see AI is not as a list of companies but as a chain of four layers, each with a different economic role and a different risk. The first layer is chips, the semiconductors and the equipment that make them, where a few firms hold decisive positions. The second is cloud infrastructure, the data-centre capacity and the hyperscalers that rent it, the picks-and-shovels of the build-out. The third is models and software, the firms building and selling the models and the applications on top. The fourth is adopters, the far larger set of companies across every sector that use AI to cut costs or lift revenue, where the eventual economic value may be largest and is hardest to attribute. Reading exposure by layer, rather than by ticker, is what turns “invest in AI” from a slogan into a map: it shows which layer a given fund actually concentrates in, and which layers it ignores.
Each layer carries a distinct risk, which is why the distinction is more than tidy. The chip layer is where the largest profits and the highest valuations have concentrated, and where a single supply shock or a shift in demand can move the whole theme, so it is both the most direct AI exposure and the most cyclical. The cloud layer converts the build-out into recurring revenue, but it also requires enormous capital spending, so its return depends on whether that spending eventually earns its cost. The model-and-software layer is the most visible and the least settled, with rapid competition and unclear moats, so its winners are the hardest to identify in advance. The adopter layer is the widest and the slowest: the value of AI applied across ordinary businesses may ultimately dwarf the other three, but it is diffuse, hard to attribute, and largely already inside a broad index through those same companies. A route that loads one layer is making a specific bet, not a general one on “AI”.
This grid is deliberately about categories, not names. No layer is a recommendation, and no company is named as a pick; the point is that the same four questions, who makes the chips, who rents the compute, who sells the models, who adopts them, let you read any AI product and any index and see where its bets actually sit. It is also why the theme resists a single instrument: no one fund covers all four layers evenly, so any route is a choice about which layer to weight.
Route 1: the broad index
The first route is the one most investors are already on: a broad market-cap-weighted index. Its AI exposure is not labelled as such, but it is real and large, sitting in the mega-cap technology names that dominate the top of the index. That has two consequences. It means a broad index already delivers substantial exposure to the chip and cloud layers without any thematic product, and it means the index’s own return has become more dependent on those same names, so its recent strength and its concentration are the same fact seen from two sides. The mechanics of choosing a broad fund, and the equal-weight alternative that dilutes this concentration, belong to the dedicated treatment of how to read an index’s composition rather than this page. What matters here is the measurement: read the top-ten weight of any index fund you own, and you have read most of your AI exposure.
Two nuances sharpen the picture. First, the concentration cuts both ways: the same top-heavy structure that delivered the index’s strong recent returns is also what would drag it in a mega-cap drawdown, so a broad index is less diversified in practice than its five-hundred names suggest. An equal-weight version of the same index, which holds every constituent in roughly the same proportion, is the standard way to dilute that concentration, and it behaves differently precisely because it strips out the mega-cap tilt. Second, a broad index concentrates in the chip and cloud layers, the mega-caps that build and rent AI infrastructure, and carries far less of the pure model-and-software or adopter layers, so its AI exposure is real but tilted. Reading the index by layer, not just by weight, shows not only how much AI you own but which part of the chain you own, which is the difference between an exposure you understand and one you merely have.
Route 2: thematic AI ETFs
The second route is the thematic AI ETF, and it is best judged on three observable facts rather than on its name. The first is concentration: a thematic fund typically holds the majority of its weight in a small number of AI-linked names, so it is a far more concentrated bet than a broad index, with the sharper drawdowns that concentration implies, the subject of AI ETF concentration and rate risk and, against the rate backdrop, AI ETF concentration versus real rates. The second is overlap: because the same mega-caps sit at the top of both, a thematic AI ETF held alongside a broad index fund often doubles up on the very names the index already carries, so the marginal exposure it adds is smaller than it looks. The third is cost: a thematic ETF usually charges more than a broad index fund, a fee paid for a tilt that may already be in the portfolio.
Two further threads sit inside this route without being re-run here. What a thematic AI ETF costs to enter at today’s levels, the valuation question, has a dedicated home in the entry price on AI ETFs, which this page points to rather than answers. And the mechanics of flows and factor exposure, why a thematic label can hide a smart-beta tilt, are treated in hidden concentration in smart beta ETFs. The dividing line is clean: this page maps where the routes go; those pages price them and dissect their risks.
The overlap deserves a concrete reading, because it is the single most common blind spot. An investor who holds a broad index fund and then adds a thematic AI ETF often believes they have taken two positions; in practice they have taken one position twice, because the thematic fund’s largest holdings are the same mega-caps that already sit at the top of the index. The result is a portfolio more concentrated than intended, with the thematic layer amplifying the index’s own tilt rather than diversifying it. The fee compounds the effect over time: paying an elevated expense ratio, year after year, for exposure a low-cost index already delivers is a cost with no matching new exposure. None of this makes a thematic ETF wrong; it makes it a decision that only pays off if the investor wants more of the same names, more concentrated, and is willing to pay for the tilt, which is a very different proposition from “getting into AI”.
Route 3: private and venture
The third route is where a great deal of the AI story is being written and where most investors cannot go: private companies and venture capital. Several of the most discussed AI firms are not listed, so their value is not accessible through a public fund, and the venture vehicles that hold them are generally restricted to institutional and accredited investors. This is a fact worth stating plainly rather than a route to pursue: the retail investor’s opportunity set is the listed one, and the main way the private layer reaches public portfolios is later, through eventual listings that broaden an index rather than through a product available today. Naming this boundary matters because it corrects the impression that the whole AI opportunity is investable; a large part of it, for now, is not.
There is one indirect bridge worth noting, and one caution. The bridge is that some listed companies hold stakes in private AI firms, so a public investor can gain a sliver of private exposure second-hand through the listed parent, though the effect on a diversified fund is usually small. The caution is that when a large private AI company does list, its addition to an index is not a free lunch for existing holders: it broadens the market but can also concentrate the top of the index further if the newcomer is large. For the retail investor the honest summary is that the private layer is mostly a spectator sport today, and the realistic exposure decision remains the one between a broad index already carrying the theme and a thematic tilt layered on top.
What valuations already price
Any route’s outcome depends on what the market has already paid for the theme, and that valuation question is not this page’s to answer. Rich valuations mean a large share of expected AI growth is already in the price, so the return to a new buyer depends on whether reality exceeds an already-high bar, the analysis that lives in the dedicated pages on the entry price and on the concentration-and-rate risks of AI ETFs, both linked in the route above. This page’s contribution is upstream of price: it establishes how much exposure a portfolio already carries and through which layer, which is the measurement that any valuation judgement then acts on. Put plainly, valuation tells you whether the theme is expensive; this page tells you how much of it you are holding before you decide.
What do you already own?
The tool below makes the overlap visible. It shows the AI-linked block inside two generic profiles, a broad index and a thematic AI ETF type, and lets you apply a move to that mega-cap block to see how each profile responds. It uses generic categories, names no fund, treats the block move as a sensitivity rather than a forecast, and picks no winner: its only job is to show how much of the theme you already hold. The lesson it points to is not which profile to prefer, but that the two overlap far more than their labels suggest, so the marginal exposure a thematic route adds is smaller, and more concentrated, than it first appears.
[eco3min_ai_exposure_sim lang=”en”]The routes, side by side
The grid reduces the choice to what actually differs between routes. Read it by the exposure column: much of the AI bet is already present in a broad holding, and the thematic route mostly intensifies it rather than adding something new.
| Route | Real exposure to the theme | Concentration | Cost | The trap |
|---|---|---|---|---|
| Broad index | Large, via mega-cap top holdings | High and rising, but diversified across sectors | Low | Not realising how much AI you already own |
| Thematic AI ETF | Very high, but overlapping the index | Very high, few names | Higher | Doubling up on names you already hold |
| Private and venture | Direct, but inaccessible to most | Concentrated and illiquid | High, restricted | Assuming the whole theme is investable |
No route is the answer on its own. The broad index already carries the theme; the thematic ETF intensifies and overlaps it for a higher fee; the private layer is largely closed. The disciplined sequence is to measure first and add second, and the wider placement of a single theme against the whole menu of investments is the sub-pillar on AI among the broader menu of investments, read inside AI within a broader allocation.
- A broad market-cap index already holds a large AI position: its top ten names were about 38% of the S&P 500 in early 2026.
- AI exposure reads as four layers, chips, cloud, models, adopters, so any route can be checked for which layer it actually weights.
- A thematic AI ETF concentrates far more and overlaps the index, so it often intensifies an existing bet rather than adding a new one, at a higher fee.
The theme read through the macro regime
How AI-linked valuations behave is a question about the macro regime, and specifically about real rates. Because the value of a fast-growing company sits far out in the future, its present value is unusually sensitive to the discount rate: falling real rates lift long-duration growth valuations, and rising real rates weigh on them. That is why an AI position is, at the level of price, a bet on the rate regime as much as on the technology, a relationship read against inflation and rates in real versus nominal returns. Where the current setting sits is shown on the dashboard for the current regime, and the specific case of a disinflationary environment, which tends to favour long-duration valuations, is mapped in the Atlas on the disinflationary regime and long-duration valuations.
Two further links complete the regime reading. How sectors and factors behave across different regimes, so that a concentrated growth tilt can be placed rather than assumed, is the tool comparing asset performance by regime. And the wider point that a market’s concentration and its passive flows interact, so that the index’s own structure amplifies the mega-cap block, is the subject of index concentration and passive dispersion, with the geographic version, how much of a global fund is really the same US names, in regional allocation in global equity ETFs.
The regime reading closes the loop the page opened. If a broad index is already an AI bet, then its behaviour in the next phase depends less on the technology’s progress than on the direction of real rates and on whether the concentration keeps rising or broadens out. A disinflationary, falling-rate setting has tended to reward the long-duration mega-cap block; a rising-rate setting has tended to pressure it and to favour the rest of the index. Neither is a forecast, and this page makes none; the point is that the same holding sits inside a regime, and reading the regime is part of reading the exposure. That is why the sequence this page argues for, measure what you already own, read it by layer, then decide whether to add, ends not in a recommendation but in a framework the reader can apply to their own portfolio and their own view of rates.
The first move in investing in AI is not to buy the theme but to measure the theme you already own, then decide whether a concentrated route adds exposure or merely repeats it.
Frequently asked questions
What are the routes to AI exposure?
Three: a broad market-cap index, which already carries a large AI position through its mega-cap top holdings; a thematic AI ETF, a far more concentrated and pricier tilt that overlaps the index; and private or venture vehicles, where much of the AI story sits but which most investors cannot access. The private route aside, the practical choice is between broad exposure you likely already hold and a concentrated tilt on top of it.
Does a broad index fund already hold AI?
Yes, substantially. Because the index is market-cap weighted and the largest companies are the AI-linked mega-caps, a broad fund’s top holdings are dominated by them: the ten largest S&P 500 names were roughly 38% of the index in early 2026, up from about 22% in 2020. A global index fund is majority-US and carries the same names, so it too holds a large, unlabelled AI position. Reading the top-ten weight of a fund reads most of its AI exposure.
How does a thematic AI ETF differ from a broad ETF?
A thematic AI ETF concentrates most of its weight in a small number of AI-linked names, so it is a much sharper, more volatile bet than a diversified index, and it usually charges a higher fee. Crucially, it overlaps heavily with a broad index’s top holdings, so held alongside one it often doubles up on the same names rather than adding genuinely new exposure. The difference is intensity and overlap, not access to something the index lacks.
How is a thematic ETF’s concentration measured?
The simplest observable measures are the number of holdings and the cumulative weight of the top few: a fund with most of its weight in its top ten names is highly concentrated. Comparing that top-weight against a broad index shows the overlap, and comparing the fund’s holdings by layer, chips, cloud, models, adopters, shows which part of the chain it actually bets on. These are all published in a fund’s factsheet, which is why concentration is a fact to read rather than a claim to trust.
How do AI-linked valuations respond to real rates?
Strongly, because their value is weighted toward distant future earnings. A long-duration growth valuation is highly sensitive to the discount rate: falling real rates raise its present value, and rising real rates lower it. An AI position is therefore, at the level of price, partly a bet on the rate regime, which is why the same holding can look cheap or expensive depending on where real rates are, independent of the technology’s progress.
This content is published for information only. It is not investment advice, recommends no fund, product or allocation, and names no security. Concentration and weighting figures reflect S&P index data available in 2026 and change with the market. The four-layer grid is an analytical framework, not a ranking. Sources: S&P Dow Jones Indices and published index data (top-ten and Magnificent Seven weights); fund factsheets for concentration.
Last updated — 8 July 2026
Disclaimer – Financial Information: The analyses, commentary, and content published on eco3min.fr are provided for informational and educational purposes only. They do not constitute investment advice or a solicitation to buy or sell financial instruments. Past performance is not indicative of future results. All investment decisions involve risk and are the sole responsibility of the reader.