
Global Equity ETFs: When the US Weight Outruns the US Economy
US issuers made up 61.4% of a fund tracking the MSCI ACWI in July 2026, against 48.8% of world stock market value and 26.0% of world GDP in 2025: markets and index rules explain the gap.

A global equity ETF weighted by market capitalization mirrors the hierarchy of stock markets, not the size of economies. That hierarchy now gives the United States a weight more than twice its share of world output.
Three measures put a number on the gap: the US weight in the main global index, the US share of all listed companies worldwide, and the US share of world GDP. They do not say the same thing.
TL;DR
A global ETF puts 63.6% of its assets in a country producing 26.0% of world GDP: markets create most of the gap, index construction the rest.
- US issuers made up 61.4% of the net assets of a fund tracking the MSCI ACWI on July 31, 2026 (SEC EDGAR, N-PORT filing of the ACWI fund).
- US listed companies accounted for 48.8% of world stock market capitalization in 2025, against 26.0% of world GDP (World Bank).
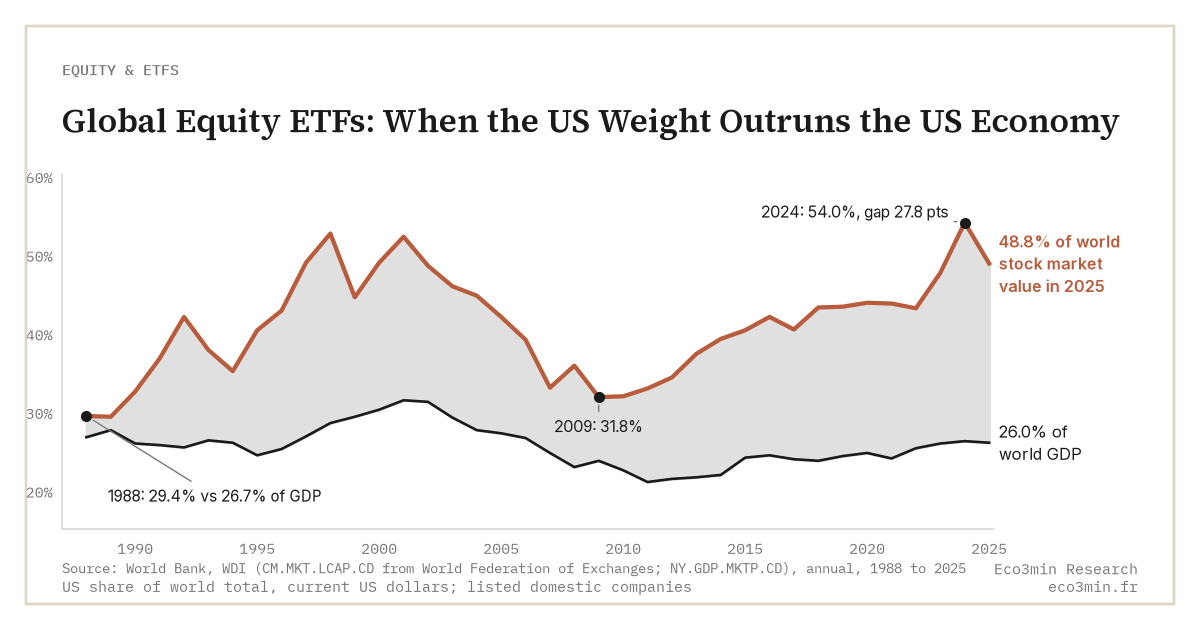
- The gap between the two World Bank shares reached 27.8 points in 2024, its widest since 1980, before narrowing to 22.8 points in 2025.
Three weights for one country
The MSCI ACWI is the benchmark of most global equity ETFs. In the latest N-PORT filing of a fund that tracks it (SEC EDGAR, holdings at July 31, 2026), US issuers made up 61.4% of net assets, Japanese issuers 5.0% and British issuers 3.2%.
A broader measure gives a lower figure. In 2025, US listed domestic companies were worth $68.9 trillion out of $141.3 trillion worldwide. That is 48.8%, according to World Bank data compiled from the World Federation of Exchanges (market capitalization of listed domestic companies). The same year, the United States produced $30.8 trillion of a world GDP of $118.4 trillion: 26.0%.
The ETF weight exceeds the GDP weight by 37.6 points. Two layers explain it. Markets first: US companies are worth far more relative to output than companies elsewhere, which accounts for the 22.8-point gap between market share and GDP share. Then the index: the ACWI keeps only large and mid caps across 47 markets and covers about 85% of the global investable universe, which lifts the US weight by another 15 points over the exchange-wide measure.
The second layer is the one investors see least. It owes nothing to prices: it comes from what the index chooses to include, and it changes only when the rules or the eligible universe change.
How the gap built up
The current imbalance is not permanent history. In 1988 and 1989, at the height of the Japanese bubble, US companies represented 29.4% and 29.3% of world market capitalization, barely above the US share of GDP (26.7% and 27.6%). The US share then climbed to 52.6% in 1998, fell to 31.8% in 2009 after the financial crisis, and rose for fifteen years to 54.0% in 2024.
That 2024 peak put the gap with the GDP share at 27.8 points, the widest since 1980 on World Bank data, whose early years cover fewer exchanges. In 2025 the US share eased to 48.8%: the value of US listed companies rose 11% in dollar terms, while the rest of the world gained 37%. A cap-weighted global ETF adjusts automatically, because its weights follow prices.
The weights follow prices, by design.
That mechanism cuts both ways. When US stocks outperform, their weight rises and new money entering a global fund goes increasingly to them, a pattern traced in the analysis of equity ETF flows. When they lag, as in 2025, the same rule reduces exposure without any decision by the holder.
What sits inside the US weight
The US slice is itself concentrated. On August 31, 2026, the ten largest constituents of the S&P 500 made up 37.84% of the index, according to S&P Dow Jones Indices. In a global ETF, those ten companies therefore weigh close to a quarter of the whole portfolio (63.6% times 37.8%). This is an approximation, since the ACWI’s US segment and the S&P 500 do not hold exactly the same stocks.
Earnings back part of that weight. The net profit margin of the S&P 500 reached 17.0% in the second quarter of 2026, well above its five-year average. That is a record since FactSet began tracking it in 2009, according to its Earnings Insight of October 2, 2026. The forward price-to-earnings ratio stood slightly below its five-year average. On that measure, the premium rests more on profits than on multiples.
The rate backdrop has shifted under it. The Federal Reserve raised its target range to 3.75%-4.00% on September 17, 2026. The European Central Bank lifted its deposit rate from 2.00% to 2.50% in two steps, on June 17 and September 16, 2026, according to the ECB deposit facility rate. The 2010-2024 run of US outperformance had unfolded mostly with policy rates near zero.
Treating a global ETF as a neutral starting point that reflects the world economy. Its weights reflect market values filtered by index rules: 63.6% United States in the ACWI, against 48.8% of world listed capitalization and 26.0% of world GDP. Holding it expresses a view on those market values, whether or not the holder intends one.
Reading the gap without forecasting it
A wide gap between market weight and economic weight does not date a reversal. US corporations earn part of their profits abroad, 26.4% in 2025 against 35.8% in 2019 according to the BEA, so GDP understates their economic base. The depth and openness of US markets justify part of the index premium. The gap stayed above 15 points from 2013 to 2025 on World Bank data without closing.
Two series are enough to follow it. The first is the pair of World Bank shares, US market capitalization and US GDP as a share of the world, published annually. The distance between them measures how far valuations have pulled away from output. The second is the US weight in the ACWI factsheet, published monthly; its gap with the exchange-wide share measures what index construction adds. A narrowing first gap describes markets converging; a stable second gap describes index rules unchanged.
The choice of vehicle comes down to index construction, set out in the framework for reading an ETF, and to the liquidity of what the fund holds, discussed in the gap between ETF liquidity and underlying markets. In 2025 the world’s listed companies gave the United States less than half their value, and its main global index still gave it close to two thirds.
Last updated — 8 October 2026
Disclaimer – Financial and Legal Information: The analyses, commentary, and content published on eco3min.fr are provided for informational and educational purposes only. They do not constitute investment advice or a solicitation to buy or sell financial instruments. Past performance is not indicative of future results. All investment decisions involve risk and are the sole responsibility of the reader. Data, charts and calculated series are provided as is and may contain errors or lag behind their source: check any figure against the primary source cited before relying on it. Content describing laws, regulations or contracts reflects the law as of its publication date and does not constitute legal or tax advice; applying it to a specific situation requires a qualified legal or tax professional.
Read next
Full pillar →Why ETF Liquidity Looks Continuous Under Stress
ETF liquidity often appears continuous on screen while the liquidity of underlying markets weakens under stress. This analysis…
Equal-Weight ETFs: The Quiet Signal Behind Rising Indices
Equal-weight ETFs reveal the true health of the equity market behind mega-cap-driven indices. Their gap with cap-weighted ETFs…
Smart Beta ETFs: The Risk Lies in the Gap Between Factors
Over the eighteen months to August 2026, value gained 8.2% and profitability lost 17.7%: stacking factor ETFs adds…