Artificial Intelligence ETF: Invest Without Overpaying
How to use an artificial intelligence ETF to capture AI growth in 2026 without overpaying or blowing up portfolio risk — macro drivers, concentration traps and observed allocation frameworks.

[Editor’s note: Article initially published in late 2025, updated in April 2026 to reflect Q1 flows and the new policy rate environment.]
TL;DR
An AI ETF packs over 60% of its weight into 20 to 30 names, making it a bet on real rates, the dollar and energy as much as on algorithms.
- Many AI ETFs hold 40 to 50% of assets in just five names, so apparent thematic diversity is largely a concentrated bet on a few US megacaps.
- A speculative subset trades at multiples implying 25 to 35% annual revenue growth through 2030; with real rates stabilizing near 1.5 to 2% in early 2026, such valuations are harder to justify than in the 2019–2021 free-money period.
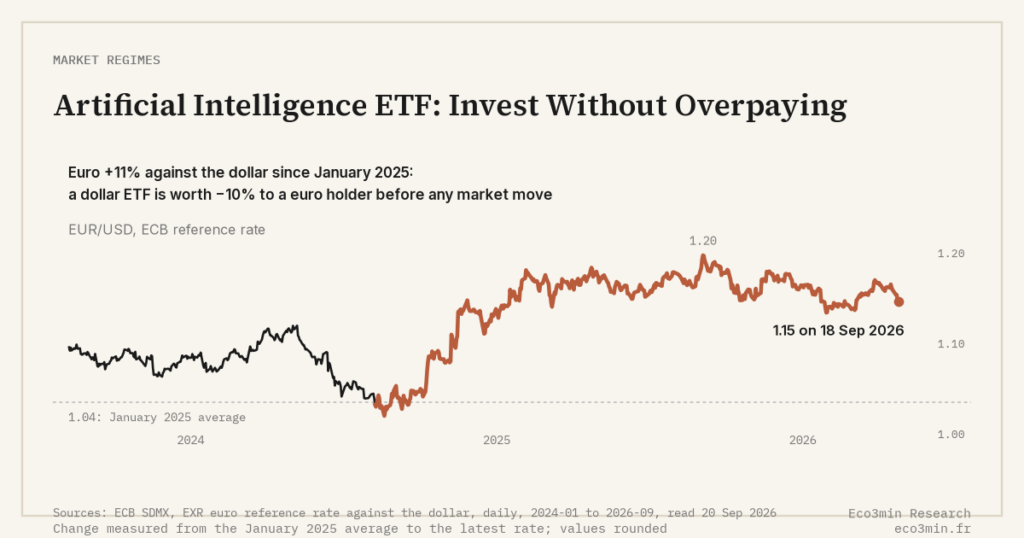
- For a euro-zone holder, a dollar-denominated AI ETF can lose around 10% in local terms purely through EUR/USD moves, independent of the underlying holdings.
How an artificial intelligence ETF can capture AI growth in 2026 without overpaying or blowing up portfolio risk.
This article focuses exclusively on equity ETFs linked to artificial intelligence and the listed companies that compose these indices. It does not cover crypto-assets, tokens, or investment mechanisms specific to blockchain markets.
AI ETFs: The Flow That Will Not Deflate
In Q1 2026, thematic ETFs linked to artificial intelligence still drew billions of dollars in net subscriptions, even as several of them post spectacular cumulative gains across 2024 and 2025. The complete panorama is in the routes into the AI theme. Meanwhile, policy rates in advanced economies remain capped around 3.5–4.5% (depending on the region), the rate-cutting cycle markets had hoped for having been slowed by resilient inflation.
This gap — massive flows into AI ETFs while the cost of capital stays high — raises a question: how is exposure to an artificial intelligence ETF taken without buying the theme at the worst point of the cycle? For a broader frame on how equity markets and listed products work, the pillar page on the fundamentals of equities and ETFs sets the general scene that this article applies to the specific case of AI.
What has shifted quietly in recent months is that AI has definitively moved from technological promise to macroeconomic variable: productivity, margins, capex, employment. AI ETFs are becoming the preferred vehicle to capture this transition — but also a formidable concentrate of risks if the hyper-enthusiastic scenario normalizes.
How AI ETFs Actually Work
Most artificial intelligence ETFs track proprietary indices labeled «AI & Robotics,» «AI Innovators» or similar. Concretely:
- around one hundred holdings at most, often concentrated on 20 to 30 names accounting for more than 60% of total weight;
- heavy overweight in US tech (often more than 70%), with a few Asian and European names;
- simultaneous presence of infrastructure producers (GPU, data centers, cloud) and AI users (software, platforms, services).
The key mechanic for the investor is that these ETFs combine three exposures:
- Growth bias: elevated valuations, intrinsically sensitive to real rates;
- Hyper-specialized tech exposure: very strong correlation with the Nasdaq and semiconductor indices;
- Momentum bias: indices are rebalanced to capture current market winners.
Part of the consensus treats these ETFs as simple «AI baskets» that smooth single-name risk. The actual stake is different: they package a macro positioning (rates, dollar, global capital flows) as much as a technological bet.
What the Market Is Misreading in AI ETFs
A parameter still poorly interpreted in 2026 concerns the revenue structure of the holdings inside these ETFs.
- A handful of giants (chip producers, cloud hyperscalers, large software vendors) already generate massive cash flows and justify their valuations.
- A second, much more speculative group trades at multiples that imply revenue growth of +25 to +35% per year through 2030 without a misstep.
Yet dominant projections often assume a linear scenario where the AI adoption curve accelerates without weakening. The implicit hypothesis: earnings will mechanically follow the enthusiasm.
A more lucid reading, indispensable today, distinguishes:
- AI as a macro productivity effect: diffuse gains, spread over time, often captured by end clients (non-tech corporates) rather than by AI providers as they compete on price;
- AI as a sellable product: licenses, APIs, managed services, generating recurring revenue but already exposed to a brutal price war.
If this dynamic persists with an inevitable normalization of margins, AI ETFs may remain structurally supportive while delivering annual performance less explosive than the initial bubble suggested.
The Real Question: Risk of Overpaying in Spring 2026?
What many seek to understand is whether buying an artificial intelligence ETF today amounts to arriving after the battle. The question is not «will AI keep growing?» (the answer is yes), but «at what perfect price is that growth already embedded in prices?» This question of already-absorbed valuation is one of the entry points to our framework on the less visible risks of artificial intelligence ETFs.
Two macro-financial parameters carry weight:
- Real rates: if inflation-adjusted rates stabilize around 1.5–2% in early 2026 in advanced economies, very high valuation multiples are far harder to justify than in the free-money period (2019–2021);
- Energy cost and physical constraints: generative AI consumes electricity. Tensions on power grids and access to cooling (data centers) physically constrain deployment and weigh on the margins of key players within AI ETFs.
The central «hype» scenario assumed a rapid rate decline to support tech. The analysis developed here differs: the trajectory of AI ETFs now depends exclusively on the ability of companies to convert the colossal capex of 2023–2025 into real net cash flow, no longer on an accommodative monetary environment.
Macro vs Micro: What Actually Drives Performance
Over a 3–5 year horizon, the performance of an AI ETF will result from three interlocking layers:
1. Macro Side: Rates, Inflation, Currencies, Flows
- Monetary policy: if central banks maintain restrictive rates beyond 2026, expensively valued growth names will become vulnerable. AI must be placed back into the cost-of-capital cycle.
- Inflation: stabilized inflation is neutral; a durable rebound would force a violent repricing of tech multiples.
- Currencies: many AI ETFs are denominated in dollars. A euro-zone investor therefore takes a direct currency risk (EUR/USD).
- Capital flows: the share of AI ETFs in global gathering is historic. A reversal of these flows after disappointment would amplify any correction through passive supply-demand mechanics.
2. Micro Side: Margins, Capex, Monetization
- Operating margins: for some leaders, margins jumped thanks to unprecedented pricing power. The commoditization of AI models in 2026 is starting to erode that advantage.
- The capex wall: investments in GPU and infrastructure exploded since 2023. If the return on investment (ROI) on the B2B client side takes time to materialize, orders will slow, penalizing the entire ETF supply chain.
- Business model: the ability to impose premium subscriptions and raise prices without driving users toward open-source alternatives will be the deciding factor.
3. AI — Business Cycle Interaction
In a global macro slowdown, companies will defer experimental AI projects to preserve cash. Budgets will concentrate on internal automation AI (which cuts costs immediately) at the expense of gimmicky generative AI. Some segments of the ETF will outperform while others collapse.
Common Error: Confusing «Structural Theme» With «Entry Point»
The most common reading error: «AI is a revolution like the Internet, so buying any AI ETF at any price will eventually pay off.» This logic confuses the underlying trend (real) with the timing of purchase on a listed financial product (subject to cycles). The Eco3min study of how financial markets form expectations and price risk carries the analysis further.
- Error #1: extrapolating past performance: an AI ETF that returned +80% in the euphoria phase will not reproduce that trajectory. The higher the starting multiple, the more future returns are mathematically clipped.
- Error #2: ignoring concentration: many AI ETFs have 40 to 50% of assets concentrated on 5 names. What looks like exposure to AI diversity is in reality a market bet on a few megacaps.
- Error #3: neglecting currency risk: for a European investor, a dollar-denominated AI ETF can lose 10% in local terms but end up flat or at –20% purely because of EUR/USD movement.
Correcting course means thinking in terms of risk allocation: what reasonable weight has historically been given to AI in long-term wealth structures?
Observational Framework for AI ETF Allocation
A pragmatic approach observed across portfolios treats the AI ETF as a growth satellite (booster) around a broad core.
- Conservative configurations: roughly 60% world fund / broad ETF, 30% bonds / euro funds, 10% satellites. AI ETF exposure has historically been observed at 2–3% of total assets.
- Balanced configurations: roughly 50% global equities, 30% bonds, 20% satellites. AI ETFs have been observed at 5–7% of the portfolio.
- Aggressive configurations: roughly 70% equities, 10% bonds, 20% satellites. AI ETF caps at 8–10% have been observed, often diversified with other uncorrelated themes (healthcare, infrastructure).
This calibration assumes that AI will remain a powerful earnings driver, but with volatility 1.5 times that of the global market. The relevant question is position size, not market timing.
Signals to Watch Before Adding Exposure
Quantitative Indicators
- Average price/earnings ratio (P/E) of the AI ETF versus a global index (MSCI World): a premium of more than 70–80% has historically signaled strong vulnerability to any disappointment.
- Inflows / outflows: record retail inflows over several consecutive weeks have historically marked short-term euphoria peaks.
- Earnings revisions: if expected earnings per share (EPS) growth for ETF leaders moves from +20% to +5% on a 12-month basis, the hyper-growth phase has historically ended.
Qualitative Indicators
- CEO commentary on earnings calls: when listed companies stop talking about the «AI revolution» and finally communicate on «the precise ROI of our AI spending,» the market gains maturity.
- Regulation and sovereignty: enforcement of strict frameworks (such as the EU AI Act) or trade wars on semiconductors modify barriers to entry.
- Energy constraints: refusals of building permits for new data centers (due to local power saturation) are the real ceilings on the industry in 2026.
What Could Invalidate the Scenario
Several risks could break the smooth trajectory of AI ETFs:
- Interest rate shock: if inflation reignites and forces central banks to raise rates again, AI multiples will collapse through the simple mathematical effect of discounting, even if the technology works.
- Commercial disillusion (the «Trough of Disillusionment»): if non-tech corporates realize that integrating AI costs much more in consulting and data adaptation than it brings in immediate productivity, budgets will freeze.
- Domino effect from another sector: if a crisis erupts elsewhere (private debt, commercial real estate), investment funds will urgently sell their most liquid and profitable assets (AI names) to cover losses, dragging ETFs down.
Conversely, if new AI models cross a major cognitive threshold drastically reducing software development or engineering costs, a new wave of highly profitable monetization could justify a second leg up.
What This Means Concretely for Three Profiles
1. Retail Investors
- Treating the AI ETF as a thematic complement, never as the foundation of long-term savings, has historically reduced concentration risk.
- Total exposures observed in retail portfolios have historically ranged between 3% and 8% of financial assets.
- DCA-style approaches (Dollar Cost Averaging: programmed monthly purchases) have historically smoothed valuation volatility better than emotional «all-in» entries.
2. Decision-Makers and Companies
- Rather than trading AI on equity markets, observed corporate strategies focus capital on implementing AI within internal processes to lift own profitability.
- Tracking the valuation of AI giants serves as a macro thermometer: multiples under pressure have historically meant B2B clients are starting to cut IT budgets.
3. Professional Investors
- Running the AI ETF within a «Barbell» approach has historically been observed: securing the portfolio base (Investment Grade bonds, money market) while taking ultra-targeted risk via the ETF on a small sleeve.
- Monitoring intra-index dispersion: when the ETF rises only thanks to 2 names out of 50, position trimming and rebalancing have historically been observed.
Reader Questions
Is a global AI ETF preferable to one focused on semiconductors?
A global AI ETF dilutes risk across the chain (chips, cloud, software, integrators). A semiconductor ETF is hyper-cyclical and dependent on data center order cycles. For retail investors, diversified AI ETFs have historically been more suitable; chip-focused products typically remain expert tactical tools. In depth: How this capex wave compares historically.
Can an AI ETF be the sole equity exposure in a portfolio?
It would concentrate sector risk, style risk (growth) and geographic risk (United States) in a single line. As sole exposure, it transforms savings into a lottery ticket on US tech, a profile rarely observed in diversified frameworks.
How is a falsely diversified AI ETF identified?
By reading the KIID (Key Investor Information Document) and looking at the top 10 holdings. If 5 companies represent 55% of the fund, the diversification is a marketing illusion. Equal-weight indices or those with weight caps (capping) have historically reduced this concentration.
Capitalizing or distributing AI ETF: which is more common?
The vast majority of these tech companies pay little or no dividend, reinvesting in growth. A capitalizing ETF (which automatically reinvests the small dividends received) has therefore become the default observed across European retail flows, both fiscally and logically.
💡 3 takeaways
- An artificial intelligence ETF is not just a technological bet — it is a macro-financial bet on steroids: its value depends as much on real rates and energy as on algorithm performance.
- The principal risk in 2026 is not AI failure, but adoption normalizing with classic margins. Disappointment would then come from a deflation of equity valuations, not from the technology itself.
- The AI ETF is best read as financial «salt»: a useful seasoning at modest weights (3 to 7% of allocation) within diversified portfolios, problematic when it becomes the main course.
Last updated — 20 September 2026
Disclaimer – Financial Information: The analyses, commentary, and content published on eco3min.fr are provided for informational and educational purposes only. They do not constitute investment advice or a solicitation to buy or sell financial instruments. Past performance is not indicative of future results. All investment decisions involve risk and are the sole responsibility of the reader.
Read next
Full pillar →Euro Below Parity in 2022: What Parity Means
In September 2022, the euro fell below parity with the dollar, to around 0.95, a low not seen…
Eurozone Fragmentation: Sovereign Spreads and the Euro
The euro is issued by a monetary union without a complete fiscal union: nineteen sovereign debts coexist under…
The Euro’s Energy Import Bill: the Gas Shock and the Currency
In 2022, the surge in gas prices turned the euro area's historic current-account surplus into a deficit and…