Japan’s Lost Decades (1989-2003)
The bursting of Japan’s twin bubble in 1990-91 did not lead to an ordinary recession but to a decade of private-sector deleveraging, banking fragility and deflation — which neither zero interest rates nor quantitative easing proved able to halt.
In 1990-91, the bursting of a twin bubble in equities and real estate tipped Japan into a lasting balance-sheet recession and deflation, whose destination is the structural framework of secular stagnation (○). The policy rate fell to zero in 1999 and quantitative easing followed in 2001, without breaking the stagnation.
Five phases of the regime shift
The episode is not a single dated crash: it unfolds in stages, from the boom to the entrenchment of deflation. Each phase sets up the next, and it is the sequence — more than any isolated shock — that turns an asset correction into prolonged stagnation.
Phase 1 — The twin bubble (1985-1989)
After the Plaza Accord of September 1985, the rapid appreciation of the yen threatened exporters and pushed the Bank of Japan into pronounced easing. The financial deregulation of the decade also made land-backed bank credit easier. The two currents converged: liquidity flowed into equities and land. The Nikkei 225 peaked at 38,915.87 points at the close on 29 December 1989, while residential property prices followed a parallel path. Rising land collateral expanded borrowing capacity, which in turn fed asset valuations — a self-reinforcing loop characteristic of credit bubbles.
Phase 2 — The tightening and the burst (1989-1991)
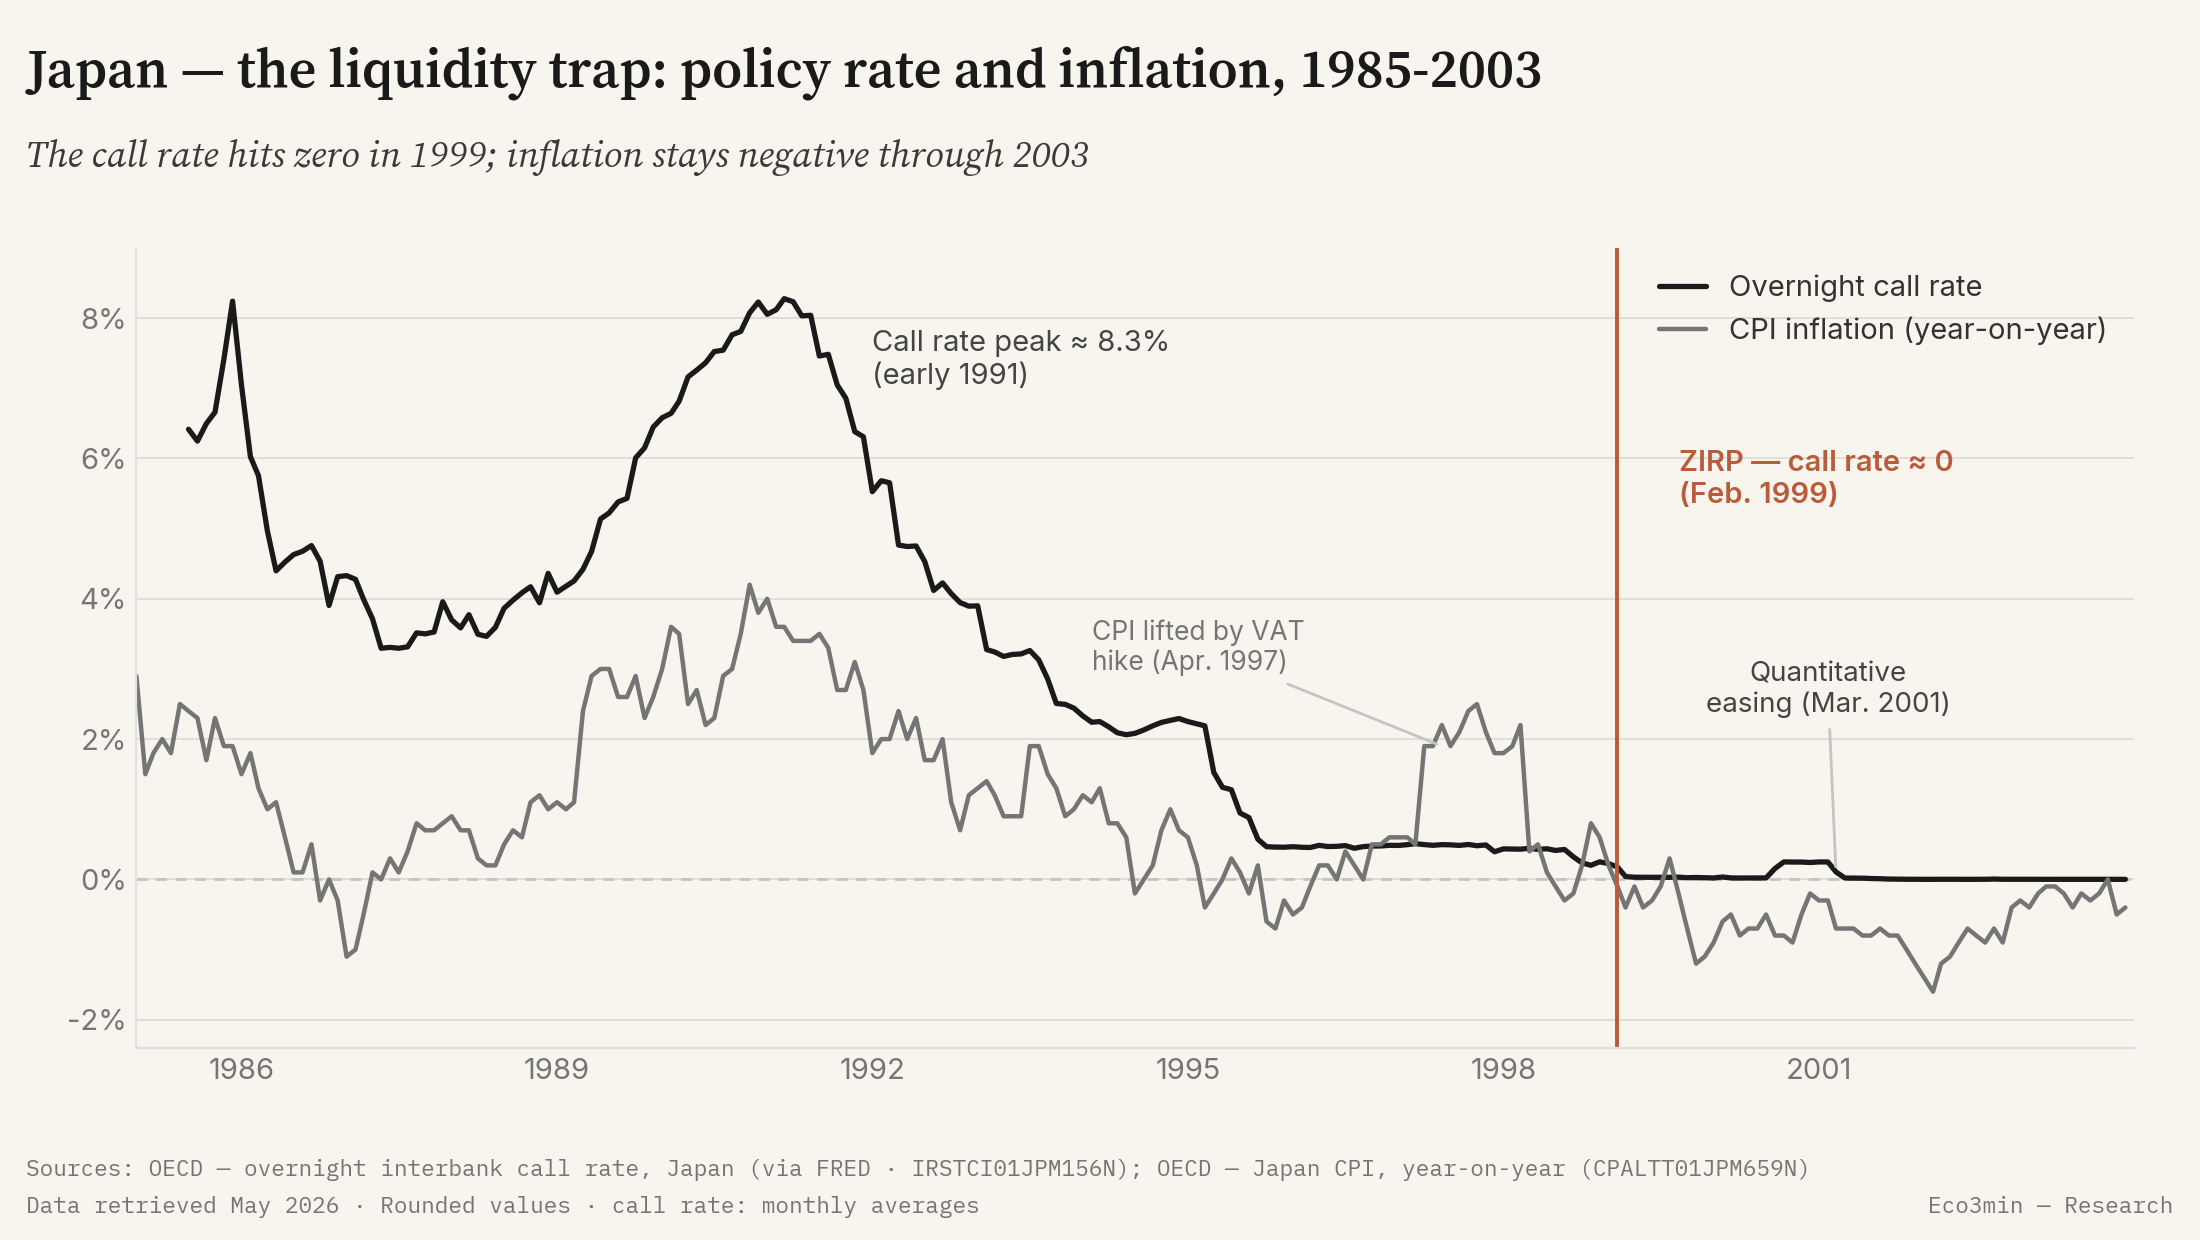
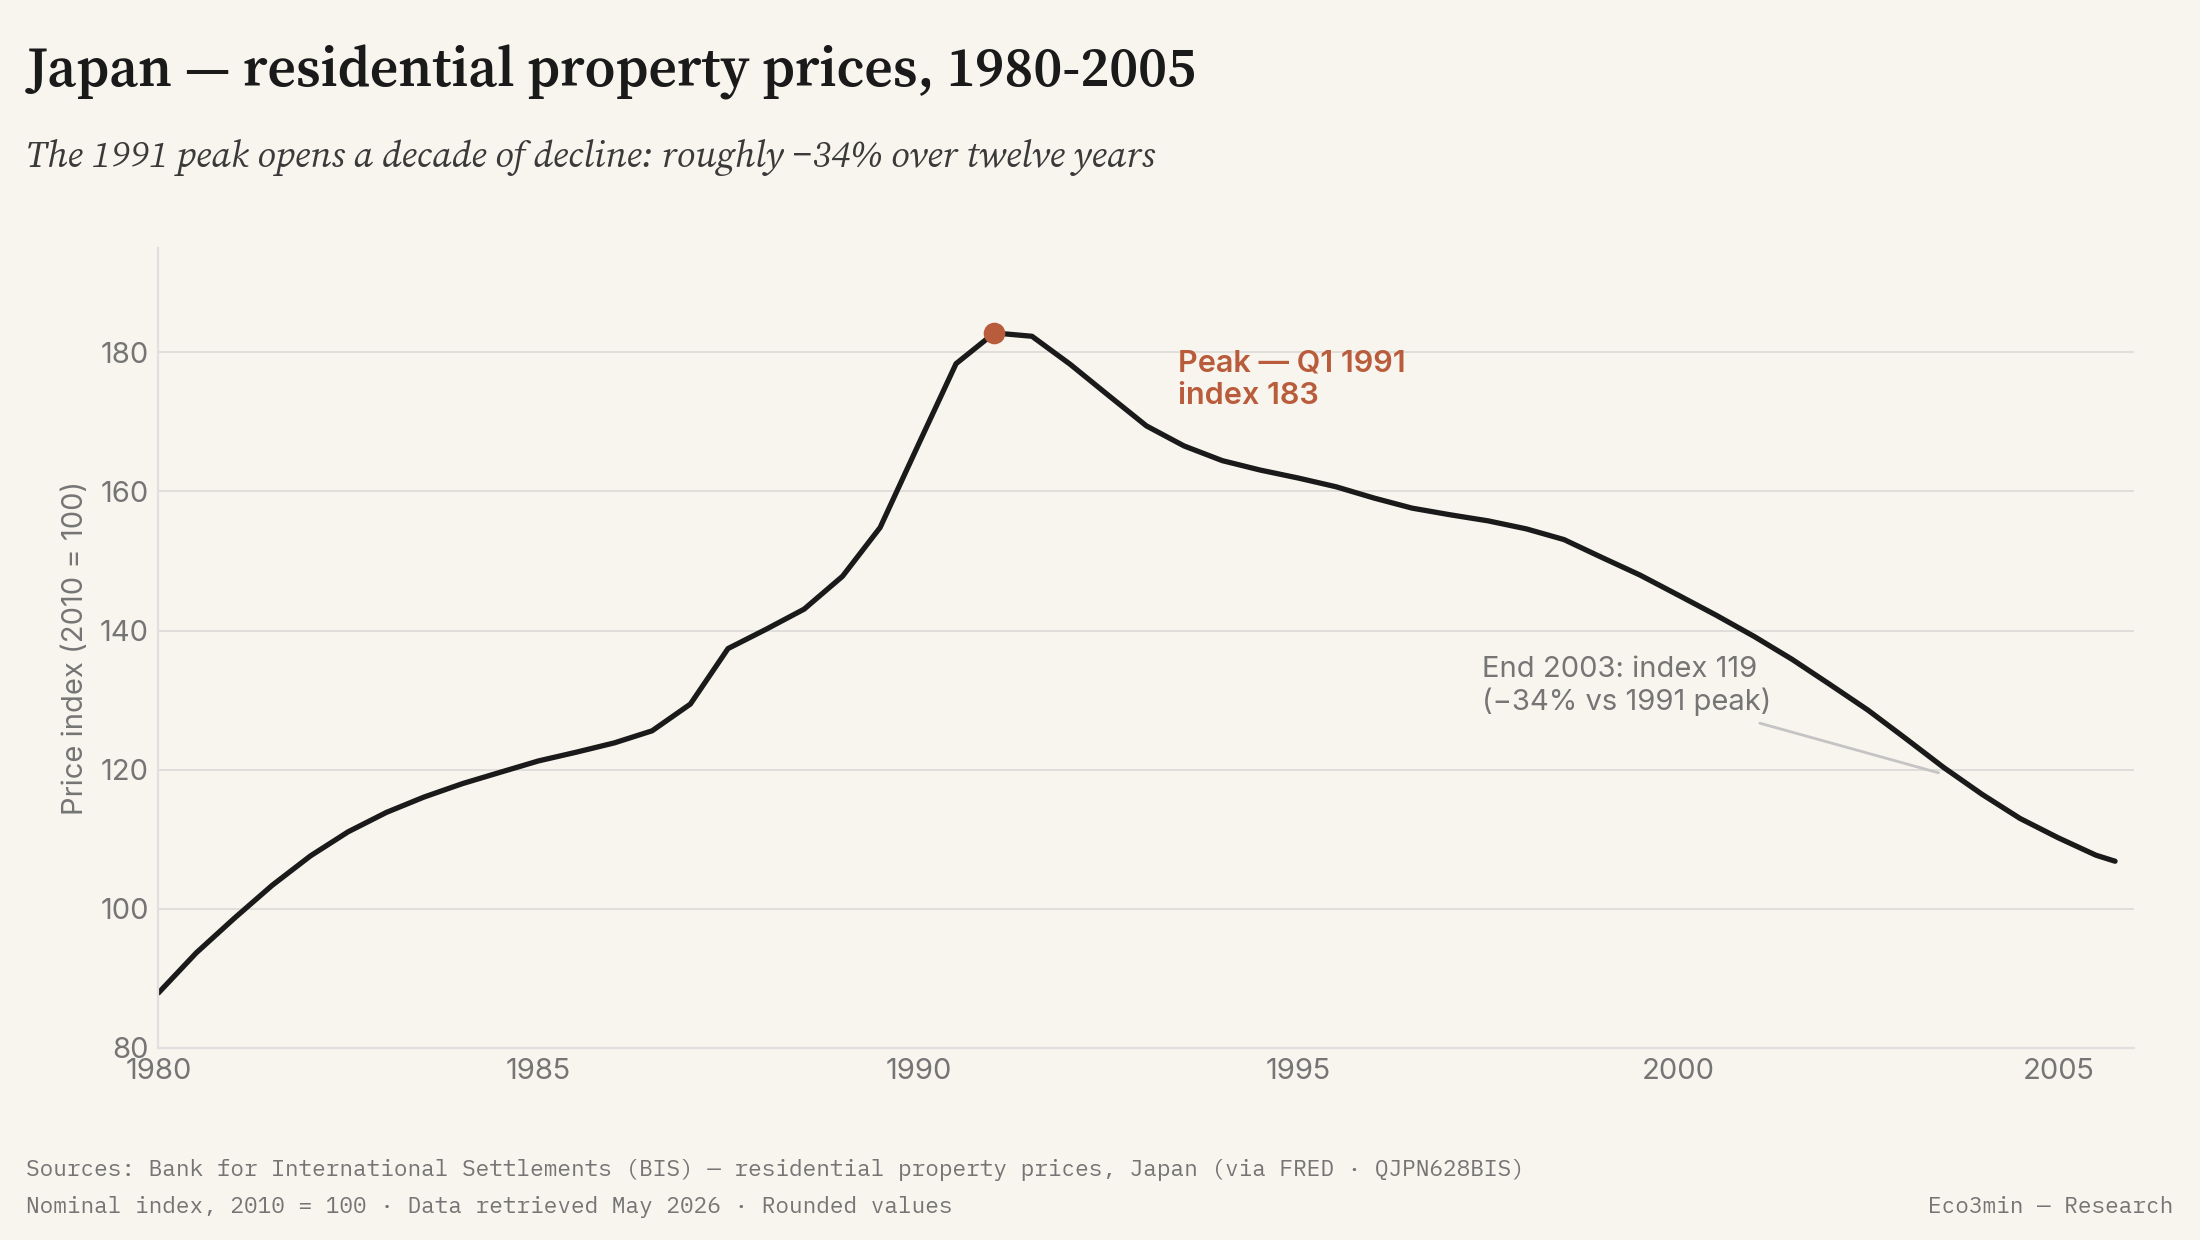
To deflate land speculation, the Bank of Japan abruptly reversed course. The tightening, begun in 1989 and intensified under Governor Yasushi Mieno, raised the official discount rate from 2.5% in January 1989 to 6.0% in August 1990; the overnight call rate approached 8.3% in early 1991. Equities fell first, from 1990. Residential property prices, more inert, peaked only in the first quarter of 1991 — index ≈ 183 (2010 = 100) — before beginning a decline that would last more than a decade. This roughly one-year gap between the equity peak and the land peak illustrates the gradual transmission of the downturn across assets.
Phase 3 — The latent banking crisis (1992-1997)
Falling asset prices eroded the value of the collateral on banks’ balance sheets. Non-performing loans accumulated, but without being fully recognised: the tradition of the “convoy system”, in which the authorities spread losses and tied weaker institutions to stronger ones, delayed the cleanup. The Bank of Japan cut its policy rate to 0.5% by the autumn of 1995, without reviving credit: firms and banks prioritised repairing their balance sheets over investment. The fragility remained largely implicit, and the economy settled into soft growth punctuated by relapses.
Phase 4 — The systemic crisis (1997-1998)
The latent crisis turned overt. In November 1997, Hokkaido Takushoku Bank, one of the major city banks, and the securities house Yamaichi Securities collapsed — failures that broke the assumption that large institutions do not fall. The VAT hike from 3% to 5% in April 1997 and the Asian crisis deepened the contraction in demand. In October 1998, the Long-Term Credit Bank was nationalised, followed in December by the Nippon Credit Bank. Over the decade, an estimated ¥100 trillion in non-performing loans would be written off — one of the heaviest post-war banking cleanups.
Phase 5 — Zero rates, quantitative easing and deflation (1999-2003)
In February 1999, the Bank of Japan brought the overnight call rate close to zero: the first zero interest rate policy (ZIRP). It lifted that policy in August 2000 — an exit often judged premature, as deflation resumed at once — then launched quantitative easing on 19 March 2001. The shift was qualitative: the central bank no longer steered a rate but a quantity, banks’ current-account balances, whose volume it markedly expanded. Inflation nonetheless stayed negative — between −0.3% and −0.9% year-on-year from 1999 to 2003, with a trough of −1.6% in February 2002. The deflation was mild but persistent, and quantitative easing would not be withdrawn until March 2006.
Three drivers of the boom
Before the turn, three interlocking mechanisms drove the dynamic. They shed light on why the correction that followed proved so hard to arrest.
Equities and land rose together from 1985 to 1989. The Nikkei peak in late 1989 and the property peak in early 1991 mark the apex of a joint valuation rarely seen on this scale.
The expansion of bank credit rested on overvalued real-estate collateral. When land prices receded, the value of the collateral contracted and mechanically weakened lenders’ balance sheets.
The discount rate went from 2.5% in early 1989 to 6.0% in mid-1990, before falling back towards zero in under a decade. The scale of the initial tightening shortly preceded the bursting.
Regime and reading frame
For years, Japan’s slowdown was often read as an ordinary cyclical recession that more accommodative monetary policy would eventually correct. The sequence contradicts that reading. The dominant mechanism is not the cost of credit but the excess debt inherited from the bubble: a private sector whose wealth had collapsed devoted its income to repayment rather than spending. In this configuration — a balance-sheet recession, in the phrase of economist Richard Koo — rate cuts lose their grip, because credit demand stays weak even at the zero floor.
This page is a retrospective study. Its reading frame is the “Secular stagnation” Atlas, a long-term structural framework that the regime classification method does not assess monthly: no calculated signal triggers it (status ○, unlike the cyclical regimes ● tracked in real time). The distinction lies in the nature of the phenomenon: a cyclical shock overlays a state, whereas a lasting stagnation deforms the frame itself — what “normal growth” means is no longer the same. By construction, the Eco3min engine reads US and global inputs; it does not measure the Japanese economy. Japan is therefore not “classified” by the machine — it illustrates, after the fact, what this framework designates.
Beyond monetary-policy choices, structural factors weighed independently: the working-age population peaked around the mid-1990s, and the pace of productivity gains slowed. These forces belong to the long term, not the cycle, and help explain why the exit took so long.
The Bank of Japan’s response
Faced with deflation, the Bank of Japan first exhausted the conventional weapon, then the unconventional one. The overnight call rate reached the zero floor in February 1999; for want of a restart, the quantitative easing of March 2001 shifted the operating target to bank reserves and markedly expanded the central bank’s balance sheet. The sequence made Japan the first large-scale laboratory for zero-rate and balance-sheet-expansion policies — tools other central banks would take up a decade later. Inflation nonetheless remained negative through 2003, a sign that monetary transmission worked poorly as long as private deleveraging was incomplete.
Asset markets
The asset adjustment spread over a full decade, without a lasting rebound. By the spring of 2003, the Nikkei 225 was trading around 7,600 points, roughly 80% below its 1989 peak. Residential property followed a comparable path, slower but just as continuous.
By the end of 2003, the residential property price index had fallen by about 34% from its first-quarter 1991 peak. This decline, drawn out and uninterrupted, sets the episode apart from sharp corrections that are quickly reabsorbed: it is the duration, as much as the magnitude, that is its signature.
The trajectories and levels described here are retrospective, for the purpose of historical analysis. They constitute neither a projection nor an investment recommendation, and past performance does not prejudge future performance.
An external comparison: the US relapse of 1937-1939
The Crisis Hub does not feature an episode belonging to the same structural framework. As an external comparison — not covered by the Crisis Hub — the US relapse of 1937-1939 offers a limited but instructive parallel.
Common ground. In both cases, a premature withdrawal of support prolonged the convalescence: in the United States, the increase in reserve requirements and the fiscal tightening of 1936-37 set off a fresh recession; in Japan, the early exit from zero rates in 2000 and the 1997 VAT hike interrupted fragile recoveries. In both episodes, the error stemmed from a cyclical reading of a situation that was not cyclical.
Three fundamental differences. First, the nature of the ailment: Japan went through a balance-sheet recession, where the private sector repays its debt rather than investing, whereas 1937-39 prolonged a contraction in demand within a depression already under way. Next, the duration: the US relapse lasted about a year before the rearmament stimulus, whereas Japan’s stagnation stretched over more than a decade. Finally, the intensity of the deflation: chronic but mild in Japan (−0.3% to −0.9%), it occurred in the United States in the wake of a far more violent collapse in prices in the early 1930s.
What invalidates the cyclical analogy. In Japan, the maintenance of a zero rate, quantitative easing and the persistence of deflation show that the brake was not the price of credit — a cyclical lever — but excess private debt and long-term forces. The 1937-39 relapse found an external trigger, wartime spending, which closed the episode within a few years; Japan had no equivalent, and it is this absence of a quick exit that places the episode within a structural rather than a cyclical framework.
In Japan, a policy rate brought to zero did not revive an economy busy repaying its debt rather than taking on more.
Where this crisis leads
This page describes the sequence of the regime shift, phase by phase; the Atlas page describes the destination state in its generality.
An environment of durably low growth and inflation, where conventional monetary levers lose their grip. A long-term reading frame, not calculated monthly by the Eco3min engine.
Atlas — secular stagnationFrequently asked questions
Why are Japan’s 1990s and 2000s called the “lost decades”?
The phrase refers to the long stretch of weak growth, deflation and stagnant asset prices that followed the bursting of the 1989-91 bubble. The term went from one to two decades as the exit kept being delayed.
What is a balance-sheet recession?
It is a recession in which the private sector, whose wealth has fallen, prioritises repaying its debt over investment and consumption. Credit demand stays weak even when rates approach zero, which limits the effect of monetary policy.
Why did zero interest rates not revive Japan’s economy?
When borrowers’ priority is to reduce their indebtedness, lowering the cost of credit does not mechanically create new borrowing. Monetary transmission then works less well, which led the Bank of Japan to supplement zero rates with quantitative easing in 2001.
How did Japan’s deflation differ from that of the 1930s?
Japan’s deflation of 1999-2003 stayed mild, between −0.3% and −0.9% per year, without the violent spiral seen in the United States in the early 1930s. Its main feature is its persistence rather than its magnitude.
- The bursting of the 1989-91 twin bubble triggered a balance-sheet recession: the private sector prioritised deleveraging over spending.
- The policy rate reached zero in 1999 and quantitative easing followed in 2001, without durably bringing inflation back above zero.
- Residential property fell by about 34% between its 1991 peak and the end of 2003; the Nikkei was trading in spring 2003 some 80% below its 1989 peak.
- Structural factors — demographics, slowing productivity — place the episode within a long-term framework, distinct from a mere cyclical trough.
Sources
- Bank of Japan — monetary policy statements (zero interest rate policy, February 1999; quantitative easing, March 2001).
- Work on balance-sheet recession and the lost decades (notably Richard C. Koo).
- Eco3min data: residential property prices (Bank for International Settlements), overnight interbank call rate and consumer price index (OECD), official discount rate (IMF), via FRED.
Last updated — 31 May 2026
Disclaimer – Financial Information: The analyses, commentary, and content published on eco3min.fr are provided for informational and educational purposes only. They do not constitute investment advice or a solicitation to buy or sell financial instruments. Past performance is not indicative of future results. All investment decisions involve risk and are the sole responsibility of the reader.