
Common mistakes about the Fed and monetary policy
Most mistakes about the Fed come from one confusion: treating the central bank as an all-powerful money printer that directly sets every rate and drives asset prices. In reality, the Fed administers one short-term rate, influences the rest through expectations, and creates bank reserves — not household purchasing power. This guide corrects thirteen common beliefs and links each to a full explanation.
In this guide
- The Fed prints money when it “creates money”
- QE is money printing that guarantees inflation
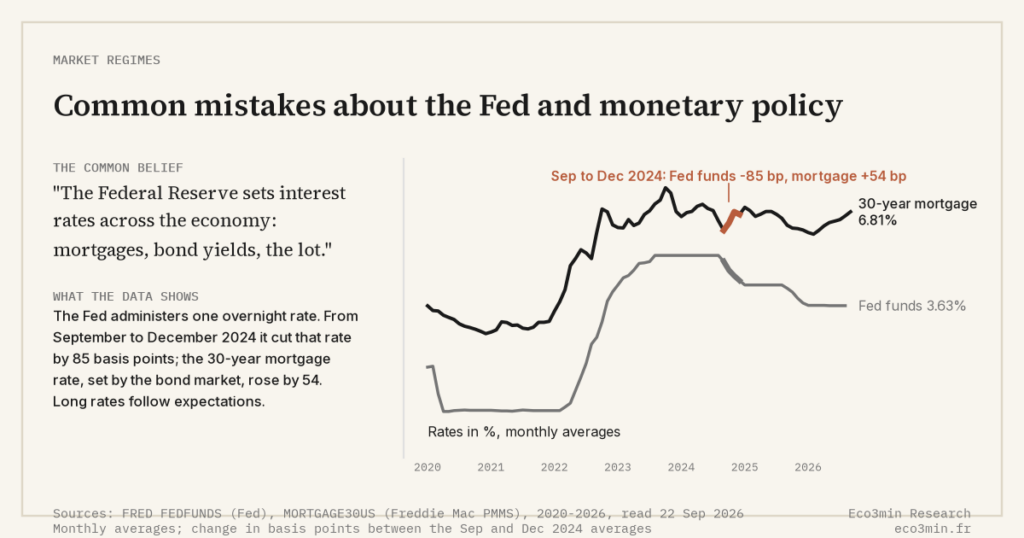
- The Fed sets all interest rates
- The Fed raises rates to punish the economy
- The Fed only cares about inflation
- The 2% target is a proven optimum
- The Fed follows a mechanical formula
- The Fed’s balance sheet drives the S&P 500
- QT will inevitably crash the market
- Forward guidance is a firm promise
- Negative rates are absurd and useless
- The dot plot reliably predicts rates
- The Fed has always targeted exactly 2%
- The pattern behind these mistakes
- Practical observation
- Frequently asked questions
Why these mistakes persist
The Fed sits at the center of financial coverage, yet most public intuitions about it date from a textbook world that no longer matches how a modern central bank works. Quantitative easing, interest on reserves and forward guidance are post-2008 tools that broke older mental models. The result is a set of durable beliefs — the Fed “prints money,” “sets all rates,” “controls the stock market” — that survive because they are intuitive, not because the data support them. Contrary to the image of an omnipotent money printer, the Fed sets a single policy rate and influences everything else indirectly, through channels it controls only imperfectly. Further reading: correlation shifts during regime changes.
→ New to central banking? Investing for beginners hub
The Fed prints money when it “creates money”
The common belief: When the Fed “creates money,” it runs the printing presses and floods the economy with new cash.
What the data shows: The Fed creates electronic bank reserves by buying assets; it does not hand cash to households. Its balance sheet peaked near $8.97 trillion in April 2022, yet most of that expansion sat as reserves inside the banking system rather than as circulating money. Broad money (M2) is created mainly by commercial bank lending, not directly by the central bank.
→ Full explanation: How does the Federal Reserve actually create money?
QE is money printing that guarantees inflation
The common belief: Quantitative easing is money printing, so large-scale QE inevitably produces high inflation.
What the data shows: QE swaps one asset (bonds) for another (reserves); it does not directly add purchasing power to household pockets. The clearest evidence is the contrast between two episodes. The Fed ran roughly $3.5 trillion of QE between 2008 and 2015 while PCE inflation averaged below 1% from 2012 to 2016, whereas the 2021-2022 inflation that peaked at 9.1% in June 2022 coincided with M2 rising about 27% year-over-year in February 2021 (St. Louis Fed) — a surge driven by direct fiscal transfers and credit, not QE alone. Contrary to the textbook reflex, the inflationary channel in 2021 was the fiscal cheque, not the bond purchase.
→ Full explanation: What is quantitative easing and how does it differ from QT?
The Fed sets all interest rates
The common belief: The Federal Reserve sets interest rates across the economy — mortgages, bond yields, the lot.
What the data shows: The Fed administers one rate, the federal funds target, mainly through interest on reserves and the reverse repo facility. Long-term yields are set by the market — expectations of future policy plus a term premium. Between March 2022 and July 2023 the Fed lifted its policy rate by 525 basis points, but the 10-year Treasury yield followed its own path and at times diverged from the short rate. Source data: Our 10-year term-premium data.
→ Full explanation: How does the Fed control short-term interest rates operationally?
The Fed raises rates to punish the economy
The common belief: The Fed hikes rates to deliberately slow growth or punish the economy.
What the data shows: Descriptively, rate hikes tighten financial conditions to cool aggregate demand and return inflation toward target — a transmission mechanism, not a penalty. The 2022-2023 cycle added 525 basis points as headline CPI ran near its June 2022 peak of 9.1%. The intent documented in FOMC statements is price stability, with the labor market as a constraint, not a target for harm.
→ Full explanation: Why do central banks raise interest rates?
The Fed only cares about inflation
The common belief: The Fed has a single job: keeping inflation low.
What the data shows: The Federal Reserve Reform Act of 1977 gave the Fed a statutory mandate usually summarized as a dual mandate — maximum employment and stable prices (the law also names moderate long-term rates). The two goals can conflict: in a supply shock, fighting inflation can raise unemployment. This distinguishes the Fed from the ECB, whose primary mandate is price stability.
→ Full explanation: What is the Fed’s dual mandate and how is it balanced?
The 2% target is a proven optimum
The common belief: The 2% inflation target is a scientifically proven optimal number.
What the data shows: The Fed formally adopted the 2% goal only in January 2012, under Ben Bernanke, and it was not strictly derived from theory. The 2% convention spread globally after New Zealand pioneered inflation targeting around 1990; its level partly reflects a safety margin against deflation and the zero lower bound rather than a calculated optimum.
→ Full explanation: Why does the Fed have a 2% inflation target?
The Fed follows a mechanical formula
The common belief: The Fed sets rates by plugging numbers into a formula like the Taylor rule.
What the data shows: FOMC decisions are discretionary and data-dependent, informed by projections rather than an automatic rule. The Taylor rule is a reference benchmark, not an autopilot; policymakers regularly deviate from it, as the “transitory” debate of 2021 illustrated before the 2022 pivot.
→ Full explanation: How does a central bank decide interest rates?
The Fed’s balance sheet drives the S&P 500
The common belief: The Fed’s balance sheet directly drives the stock market — QE means stocks go up, full stop.
What the data shows: The correlation looked tight from 2009 to 2021, but it is not a mechanical law. In 2022 the balance sheet remained near record highs while the S&P 500 fell 19.4%, its worst year since 2008, as rates rose. Liquidity is one input among many — earnings, rates and risk appetite all matter.
→ Full explanation: Does the Fed’s balance sheet drive stock prices?
QT will inevitably crash the market
The common belief: Quantitative tightening drains liquidity so aggressively that it must crash markets.
What the data shows: Between June 2022 and 2025 the Fed shrank its balance sheet from about $8.97 trillion toward $6.5 trillion — roughly $2 trillion — without a systemic crash. Much of the drain was absorbed by the overnight reverse repo facility, which fell from about $2.5 trillion in late 2022 toward a few hundred billion, cushioning bank reserves. The market impact of QT depends on whether reserves are abundant or scarce.
→ Full explanation: What is the market impact of quantitative tightening?
Forward guidance is a firm promise
The common belief: When the Fed signals its future rate path, that guidance is a binding promise.
What the data shows: Forward guidance is conditional communication, not a contractual commitment. The Fed can and does change course: through 2021 it described inflation as “transitory,” then pivoted sharply to hiking in 2022. Guidance shapes expectations, but it is revised as the data evolve.
→ Full explanation: What is forward guidance and how does it work?
Negative rates are absurd and useless
The common belief: Negative interest rates are an absurdity that does nothing — nobody would lend at a negative rate.
What the data shows: Several central banks ran negative policy rates — the ECB from 2014 to 2022, alongside Japan, Switzerland and Denmark. They measurably affected money-market and exchange rates, though their effectiveness is debated because they compress bank margins. The Fed itself has never adopted them.
→ Full explanation: What are negative interest rates and have they worked?
The dot plot reliably predicts rates
The common belief: The Fed’s dot plot is a reliable forecast of where rates are heading.
What the data shows: The dots are individual, non-binding projections and have been poor predictors. The 2021 dot plot, for instance, pointed to far lower rates than the path actually taken in 2022, when the Fed hiked by 525 basis points. The dots show a snapshot of opinion, not a committed trajectory.
→ Full explanation: How does the dot plot shape market expectations?
The Fed has always targeted exactly 2%
The common belief: The Fed has always rigidly targeted 2% inflation.
What the data shows: In August 2020 the Fed shifted its framework to flexible average inflation targeting (FAIT), explicitly tolerating temporary overshoots to make up for past undershoots. After inflation surged in 2021-2022, the Fed effectively de-emphasized the average-makeup logic — evidence that the framework itself evolves with circumstances.
→ Full explanation: Why did the Fed shift to flexible average inflation targeting?
The pattern behind these mistakes
Nearly all of these errors conflate the Fed’s balance sheet (base money and bank reserves) with circulating money and household purchasing power, and they overstate how directly the Fed controls outcomes. Regime synthesis: in the 2009-2019 era of abundant reserves, low real rates and weak money velocity, the Fed expanded its balance sheet roughly fivefold yet inflation stayed below 2% — reserve liquidity did not translate into goods inflation. In 2020-2021, by contrast, M2 jumped about 27% year-over-year (St. Louis Fed) on the back of direct fiscal transfers and credit, and headline CPI reached 9.1% by June 2022; the inflationary channel was fiscal, not QE alone. The 2022-2024 transition — QT plus 525 basis points of hikes — drained liquidity without a systemic break, partly because the reverse repo facility absorbed the shock. The pivot to watch is the shift from the bank-reserve channel to the fiscal-and-credit channel: the same Fed tool produced very different outcomes depending on where new money actually landed.
The Fed’s printing press creates bank reserves, not household purchasing power — which is why 2009 looked nothing like 2021.
→ Interpretive framework: Monetary regimes, interest rates and liquidity
Practical observation
What the data suggests for framing your own analysis:
- Question to ask yourself: when a commentator says a Fed action will “inevitably” move markets, which channel carries the effect — bank reserves, credit, expectations or fiscal policy?
- Data to monitor: the effective federal funds rate against the 10-year Treasury yield (the slope), plus the overnight reverse repo balance as a reserve buffer.
- Historical parallel: 2009-2015 saw roughly $3.5 trillion of QE with PCE inflation below 1% (2012-2016), while 2020-2021 saw M2 rise about 27% and CPI reach 9.1% in June 2022.
- What the literature documents: the St. Louis Fed has documented a lag of roughly 18 months between the February 2021 peak in M2 growth and the June 2022 peak in inflation, consistent with Friedman’s “long and variable lags.”
This is descriptive information to help you frame your own analysis. Eco3min does not provide investment advice.
Go deeper
📊 Full write-up: Restrictive monetary policy: delayed effects and credit transmission
📁 Datasets: Federal funds rate history · Fed balance sheet
Related guides
Frequently asked questions
Is the Fed’s balance sheet the same thing as the money supply?
No. The balance sheet records the Fed’s assets (mostly Treasuries and mortgage securities) and liabilities (mostly bank reserves and currency). Bank reserves are “base money” that sits inside the banking system; they are not the same as M2, the broad money supply held by the public. The two can move very differently — the balance sheet expanded sharply from 2009 while broad money and inflation stayed subdued, because reserves did not automatically flow into household spending. This distinction is why “the Fed printed money” rarely maps cleanly onto consumer inflation.
If QE creates money, why didn’t 2009-2015 produce the inflation of 2021-2022?
Because the two episodes ran through different channels. QE between 2008 and 2015 added reserves to banks, but with weak loan demand and low velocity, that liquidity largely stayed in the financial system; PCE inflation averaged below 1% from 2012 to 2016. The 2021-2022 inflation, peaking at 9.1% in June 2022, coincided with direct fiscal transfers to households and a roughly 27% year-over-year jump in M2 — money that landed in spendable accounts, not just bank reserves. The lesson is that what matters is where new money ends up, not the label “money printing.”
How does the Fed influence long-term rates if it only sets the short-term rate?
The Fed sets the federal funds rate directly, but long-term yields reflect the market’s expectations of the average short rate over the bond’s life, plus a term premium for uncertainty. So when the Fed signals a higher path, long rates can rise in anticipation; when markets expect cuts or a recession, long rates can fall even as the Fed holds. This is why the 10-year Treasury yield sometimes moves opposite to the policy rate, and why the Fed’s control over the long end is indirect and incomplete. Where control is indirect and incomplete, interpretation takes over — the natural habitat of the disagreements economists cannot close.
Last updated — 22 September 2026
Disclaimer – Financial Information: The analyses, commentary, and content published on eco3min.fr are provided for informational and educational purposes only. They do not constitute investment advice or a solicitation to buy or sell financial instruments. Past performance is not indicative of future results. All investment decisions involve risk and are the sole responsibility of the reader.
Read next
Full pillar →Common mistakes about real estate
Most mistakes about real estate come from treating it as a price story when it is first an…
Common mistakes about bonds and interest rates
Most bond mistakes come from textbooks written during a decade of falling rates and negative term premium, when…
Common mistakes about credit and spreads
Most credit misconceptions share one root: treating the credit market as a system that reacts to the economy…