
Common mistakes about real estate
Most mistakes about real estate come from treating it as a price story when it is first an interest-rate and supply story. Housing is a long-duration asset: rates move transactions and construction before they move prices, and the 2022-2023 cycle froze supply rather than deflating values.
In this guide
- Home prices always rise, whatever rates do
- The cost of a home is its purchase price
- Paying off a mortgage early is always best
- Affordability is only about prices
- Mortgages work the same everywhere
- Real estate reacts to the economy after the fact
- High rates automatically push prices down
- Institutional investors caused the price surge
- Buying is always better than renting
- Commercial real estate is too small to matter
- REITs are a reliable inflation hedge
- Empty offices only hurt their owners
- The pattern behind these mistakes
- Practical observation
- Frequently asked questions
Why these mistakes persist
Real estate is the asset most people own and least often analyse as a financial instrument. The intuition built over decades of falling rates – that housing only rises and that price is the whole story – collided with the fastest tightening cycle in forty years. Most errors below share one root: confusing what happens to prices with what happens to transactions and supply.
→ New to real estate cycles? Real estate, credit and rate cycles
Home prices always rise, whatever rates do
The common belief: Property is a one-way market that climbs regardless of the interest-rate environment.
What the data shows: Housing is a long-duration asset and historically tracks real-rate cycles with a lag. When the average 30-year fixed mortgage moved from a record low near 2.65% in January 2021 to above 7% in 2023 (Freddie Mac), borrowing capacity compressed sharply and existing-home sales fell. Prices and transaction volumes do not move together, and prices can stay elevated even as activity collapses.
→ Complete explanation: How do real estate prices follow interest-rate cycles?
The cost of a home is its purchase price
The common belief: What a home costs is the sticker price, or at most the monthly payment.
What the data shows: The real cost includes interest, property taxes, insurance, maintenance (roughly 1-2% of value per year) and the opportunity cost of capital tied up in equity. In a high-rate environment, interest dominates the early years of a loan: at 7% versus 3%, a far larger share of each payment services debt rather than equity.
→ Detailed explanation: What is the real cost of owning a home?
Paying off a mortgage early is always best
The common belief: Clearing mortgage debt as fast as possible is always the optimal financial move.
What the data shows: The guaranteed return from prepaying equals the loan rate. A borrower who locked in around 3% during 2020-2021 faces a very different trade-off from one borrowing above 7% in 2023, because the bar a competing investment must clear differs by several percentage points. The arithmetic depends on the rate, the horizon and the tax treatment, not on a universal rule.
→ In-depth explanation: Early mortgage repayment or investing: what has historically made the difference?
Affordability is only about prices
The common belief: Housing becomes affordable when prices fall and unaffordable when they rise.
What the data shows: Affordability is a function of prices, mortgage rates and incomes together. Between 2021 and 2023, the monthly payment on a given loan amount rose far more than prices, because higher rates inflated financing costs. Mortgage capacity contracts mechanically as rates climb, so affordability can deteriorate even when prices are flat.
→ The full explanation: What drives housing affordability besides prices?
Mortgages work the same everywhere
The common belief: A mortgage is a mortgage; the 30-year fixed is a normal product like any other.
What the data shows: The 30-year fixed-rate mortgage is a near-unique U.S. feature, made possible by agency guarantees (Fannie Mae, Freddie Mac) and mortgage-backed securitisation. It transmits monetary policy differently: existing borrowers are insulated from rate increases, unlike variable-rate markets such as the United Kingdom, Australia and parts of Europe, where higher rates pass quickly into household budgets.
→ Full breakdown: How does the 30-year fixed mortgage shape US housing?
Real estate reacts to the economy after the fact
The common belief: Housing is a lagging sector that confirms a downturn only once it has already begun.
What the data shows: Housing starts are among the most leading indicators of the cycle. Edward Leamer (2007) documented that residential investment turns down ahead of most U.S. recessions, because the decision to build is highly sensitive to financing costs. When rates rise, construction reacts quickly – well before consumption or employment register the shift.
→ Fuller explanation: Why do housing starts lead the economic cycle?
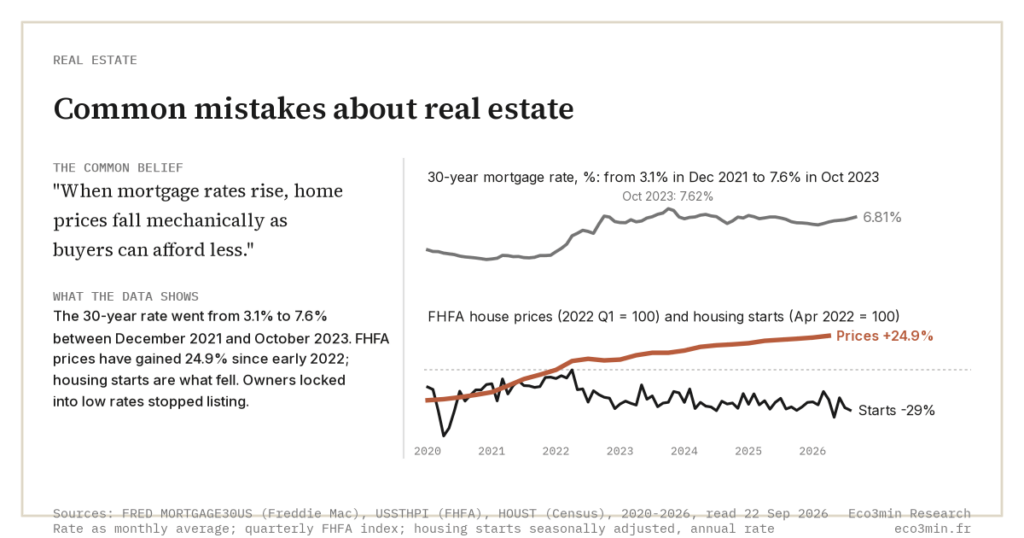
High rates automatically push prices down
The common belief: When mortgage rates rise, home prices fall mechanically as buyers can afford less.
What the data shows: The 2022-2023 increase froze supply before it deflated prices. At the mid-2022 peak, around 93% of U.S. mortgage holders had a rate below 6% (Redfin analysis of FHFA data); locked in, they stopped listing. The FHFA estimated the lock-in effect prevented roughly 1.72 million home sales between 2022 and 2024, and existing-home sales fell about 25% versus 2019. Scarcer supply supported nominal prices even as transactions collapsed – the clearest example of why price intuition fails for housing.
→ Extended explanation: What is the mortgage lock-in effect?
Institutional investors caused the price surge
The common belief: Wall Street firms bought up the housing stock and drove the surge in prices.
What the data shows: Institutional investors own roughly 2-3% of the U.S. single-family rental stock and less than 0.5% of the total single-family housing stock (GAO 2024; Urban Institute). Their presence is concentrated in a few southeastern metros – about 25% of single-family rentals in Atlanta, 21% in Jacksonville – but nationally marginal. The price surge owes far more to a structural shortage of supply than to institutional buying.
→ The complete explanation: How do institutional investors affect housing?
Buying is always better than renting
The common belief: Renting is throwing money away; buying always wins financially.
What the data shows: The price-to-rent ratio is a valuation metric: when it stretches well above its historical average, buying is expensive relative to renting. Robert Shiller popularised it as a signal of over- or under-valuation. The buy-versus-rent decision depends on that ratio, the holding period and transaction costs – not on the assumption that ownership is unconditionally superior.
→ Full account: What is the price-to-rent ratio and what does it tell us?
Commercial real estate is too small to matter
The common belief: Commercial property is a niche that poses no systemic risk to the broader economy.
What the data shows: U.S. banks hold around $2.7 trillion in commercial real estate (CRE) loans, close to a quarter of the average bank’s assets (Federal Reserve, 2024). Exposure is highly asymmetric: CRE makes up roughly 38% of the loan book at small regional banks (under $10bn in assets) versus about 12-13% at the largest banks (S&P Global, 2024). A wall of refinancings at higher rates concentrates the risk on regional lenders.
→ Complete breakdown: Why is commercial real estate a systemic risk?
REITs are a reliable inflation hedge
The common belief: Listed real estate trusts mechanically protect against inflation.
What the data shows: REIT behaviour depends on the sub-sector (offices versus logistics, residential or data centres) and on the real-rate regime. Over short horizons, listed REITs trade more like equities and are sensitive to rising real yields; only over long horizons do they behave like physical property. In 2022, higher real rates weighed on most listed REITs despite elevated inflation – the hedge is conditional, not automatic.
→ Complete explanation: How do REITs behave during inflation and recession?
Empty offices only hurt their owners
The common belief: Office vacancies are a problem for landlords alone.
What the data shows: The U.S. office vacancy rate reached a record near 20% in 2024-2025 (Moody’s Analytics), surpassing the prior peaks of 1986 and 1991. The consequences spill beyond owners: lower municipal property-tax receipts, pressure on exposed regional banks, and weaker downtown retail. The value of obsolete buildings can fall sharply at refinancing, transmitting stress into the local economy and the banking system.
→ Detailed explanation: Why do office vacancies matter for the economy?
The pattern behind these mistakes
The common confusion is reading housing through prices when the asset responds first through supply and financing. Real estate is long-duration and rate-sensitive, so regimes matter. In the negative-real-rate, abundant-liquidity regime of 2020-2021, cheap credit and mass refinancing pushed prices up. In the rising-real-rate regime of 2022-2023, purchasing power was compressed, yet the lock-in effect froze supply – transactions and starts fell while residential prices stayed resilient, the supply channel dominating the price channel. Commercial real estate, with no lock-in and a refinancing wall, instead took the hit through the valuation channel. The transition pivoted on the 30-year mortgage moving from about 2.65% in January 2021 to above 7% in 2023, alongside 10-year real yields swinging from negative to positive. The transposition to REIT shares is covered in our decoding of REIT valuation.
Rising rates do not deflate housing first – they freeze the transactions that would price it.
→ Framework: Interest rates, purchasing power and mortgage capacity
Practical observation
What the data suggests for framing your own analysis:
- Question to ask yourself: When rates move, am I looking first at prices, or at transaction volumes and new construction?
- Data to monitor: the 30-year fixed mortgage rate (Freddie Mac PMMS), existing-home sales volume, housing starts, and the office vacancy rate.
- Historical parallel: from January 2021 to 2023 the 30-year mortgage rose from about 2.65% to above 7%, and the FHFA estimated roughly 1.72 million home sales were prevented over 2022-2024.
- What the literature documents: Edward Leamer (NBER, 2007) argued residential investment leads the U.S. business cycle – “housing is the business cycle.”
This is descriptive information to help you frame your own analysis. Eco3min does not provide investment advice.
Go deeper
📊 Full study: Primary residence: savings, investing and wealth functions
📁 Datasets: US 30-year mortgage rate · US real housing price index
Related guides
Frequently asked questions
Do high mortgage rates always push home prices down?
Not directly, and the 2022-2023 cycle shows why. Higher rates first hit the supply side: most U.S. owners were locked into mortgages below 6%, so they stopped selling. The FHFA estimated the lock-in effect prevented around 1.72 million sales between 2022 and 2024, and existing-home sales fell roughly 25% versus 2019. With fewer homes listed, nominal prices stayed resilient even as transactions collapsed. Rates work through volumes and construction before prices – which is why treating housing as a simple price story misleads. Which of the two, rates or prices, has actually driven affordability is the question the rates-versus-prices reading of US housing affordability takes on directly.
Are institutional investors responsible for high housing prices?
National data does not support that view. Institutional investors own roughly 2-3% of the single-family rental stock and under 0.5% of the total single-family housing stock (GAO 2024; Urban Institute). Their footprint is concentrated locally – around 25% of single-family rentals in Atlanta and 21% in Jacksonville – which fuels the perception, but nationwide their weight is marginal. The dominant driver of elevated prices is a structural shortage of supply, not corporate buying.
How does commercial real estate stress reach the broader economy?
Mainly through banks. U.S. lenders hold around $2.7 trillion in CRE loans, close to a quarter of the average bank’s assets, and exposure is concentrated at smaller regional banks – roughly 38% of their loan books versus about 12-13% at the largest banks (S&P Global, 2024). As office vacancies hit a record near 20% in 2024-2025 (Moody’s), buildings refinancing at higher rates can lose value sharply, pressuring regional lenders and municipal tax bases at once.
Last updated — 22 September 2026
Disclaimer – Financial and Legal Information: The analyses, commentary, and content published on eco3min.fr are provided for informational and educational purposes only. They do not constitute investment advice or a solicitation to buy or sell financial instruments. Past performance is not indicative of future results. All investment decisions involve risk and are the sole responsibility of the reader. Data, charts and calculated series are provided as is and may contain errors or lag behind their source: check any figure against the primary source cited before relying on it. Content describing laws, regulations or contracts reflects the law as of its publication date and does not constitute legal or tax advice; applying it to a specific situation requires a qualified legal or tax professional.
Read next
Full pillar →Common investor behavioral mistakes
Most investor mistakes are not information failures but predictable patterns in how the mind weighs gains, losses and…
Common mistakes about inflation
Most inflation mistakes share one root: treating inflation as a single, mechanical number rather than a regime. This…
Common mistakes about commodities and gold
This guide corrects eight persistent misconceptions about commodities and gold. The common thread: commodities are treated as a…