
Share of U.S. Household Wealth by Generation (1989–2026)
The Federal Reserve’s Distributional Financial Accounts (DFA) measure how the total net worth of U.S. households is split across groups, quarter by quarter, back to 1989. This page documents one slice of that data set: the share of national household wealth held by each generation, and — because birth-cohort shares mix together two different effects — the parallel series for a fixed age band. The underlying quarterly data is available below as a downloadable file.
The narrower, defensible point established by the data is twofold. First, the distribution of wealth across living generations is highly concentrated in the cohorts now at or past their peak-earning years. Second, when the comparison is held at a constant age — households under 40, regardless of which generation happens to occupy that bracket — the share of wealth owned by younger households is materially lower today than it was a generation ago. The interpretation of that gap is contested, and the two leading readings are set out explicitly below.
Key Figures (2026 Q1, Federal Reserve DFA)
Series: Share of total U.S. household net worth, by generation, quarterly 1989 Q3 – 2026 Q1
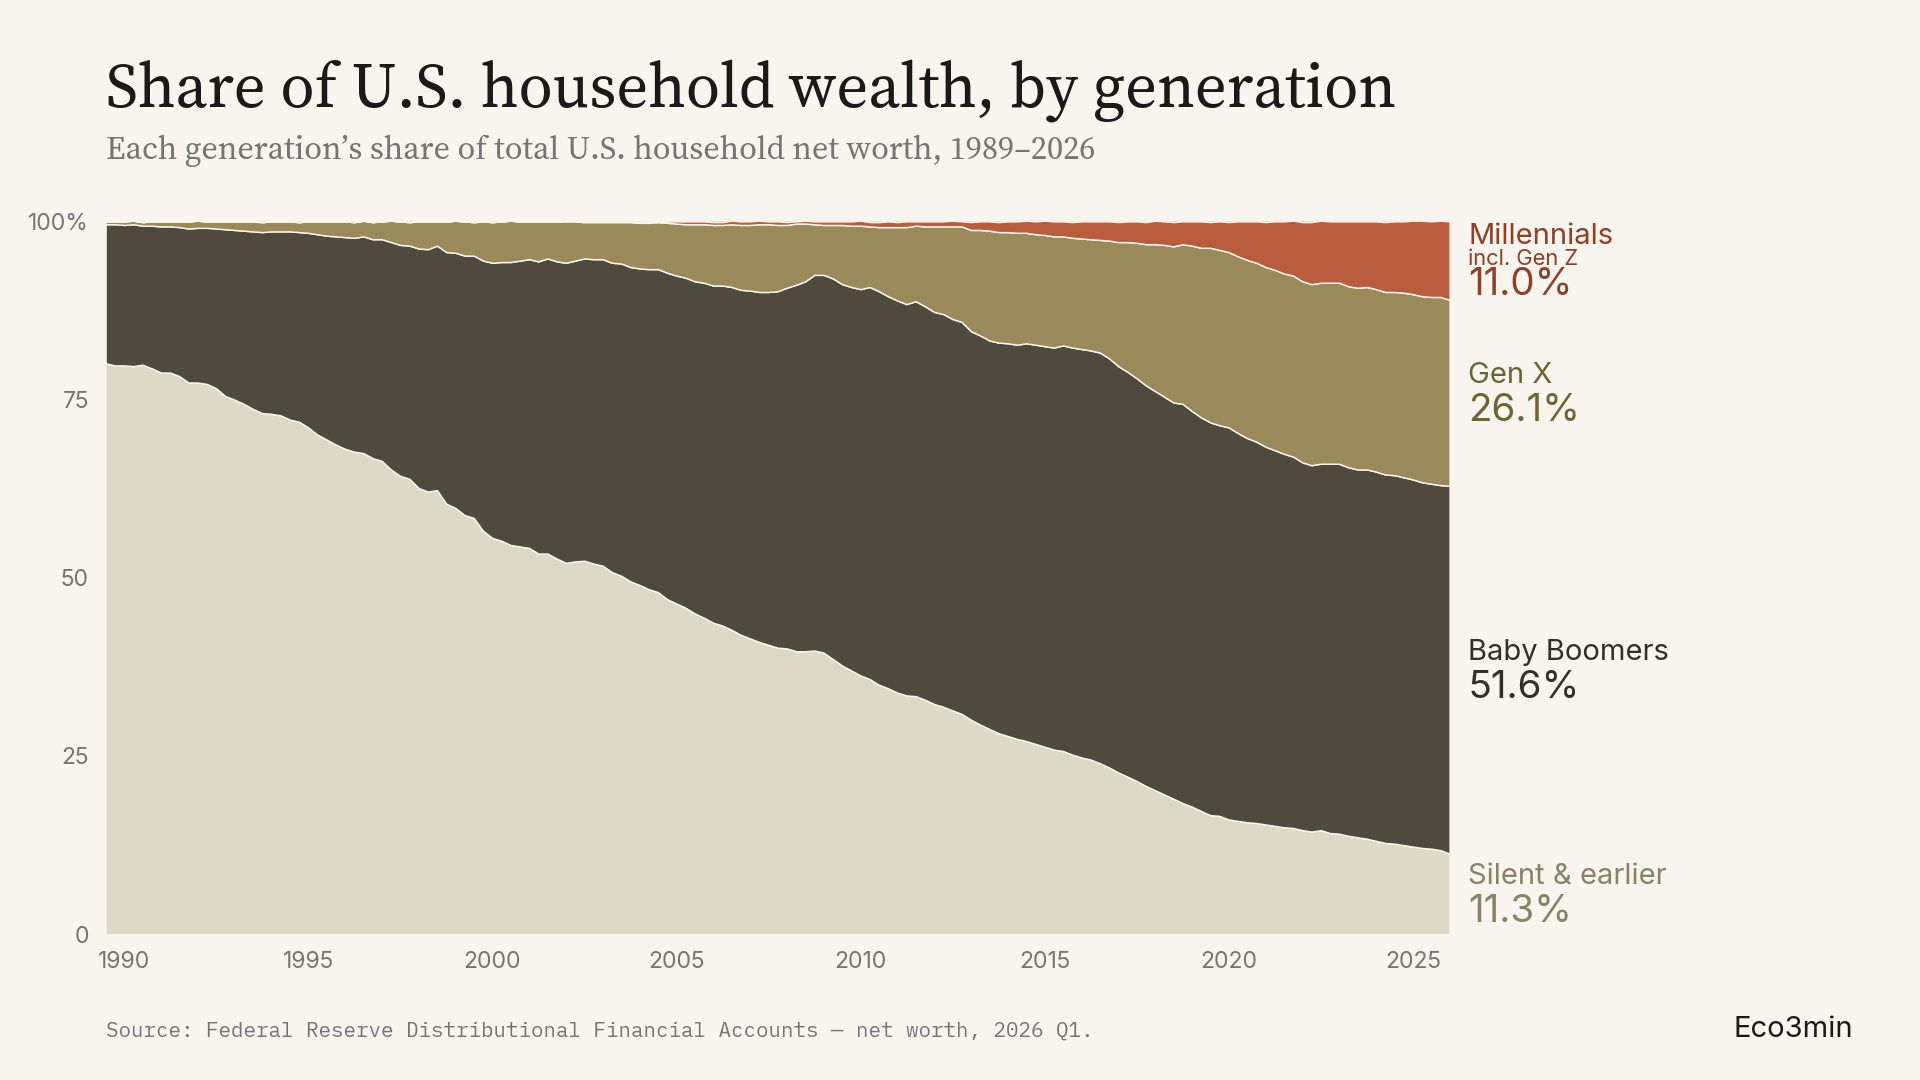
Baby Boomers (born 1946–1964): 51.6% of net worth (peak 57.6% in 2016 Q3)
Gen X (born 1965–1980): 26.1%
Silent generation and earlier (born before 1946): 11.3% (down from 80.1% in 1989 Q3 as the cohort ages out)
Millennials (born 1981 or later, Fed definition; includes Gen Z): 11.0% (up from 4.2% in 2020 Q1)
Households under 40 (age band, cohort-independent): 6.6% of net worth, versus 12.0% in 1989 Q3 — a decline of about 45%
Total U.S. household net worth: approximately $174 trillion (then-current dollars)
Net worth by generation, in dollars: Baby Boomers ≈ $89.8tn, Gen X ≈ $45.4tn, Silent ≈ $19.7tn, Millennials ≈ $19.1tn
A century-long handoff, in one series
In 1989, the Silent generation and those older than it held roughly four-fifths of all U.S. household net worth — 80.1% in the third quarter of that year. They were the adults: the youngest members of that cohort were in their forties, and the Baby Boomers behind them — then in their twenties, thirties and early forties — held 19.5%. Over the following three and a half decades, the bottom band of the chart — the oldest cohort — contracts steadily as its members age and the wealth passes on, falling to 11.3% by 2026 Q1.
The Baby Boomers absorbed most of that handoff. Their share rose from under a fifth in 1989 to a peak of 57.6% in 2016 Q3, and stood at 51.6% in 2026 Q1 — the band that visually dominates the chart. Gen X, the next cohort, rose to 26.1%. Millennials, who first register a non-zero share only in 2002 and held just 4.2% as recently as 2020 Q1, reached 11.0% by 2026 Q1 — a share that has more than doubled in six years but remains a sliver relative to the cohorts ahead of them.
Two features of this series are worth stating before any interpretation. It is a share of a moving total: U.S. household net worth grew to roughly $174 trillion by 2026 Q1, so a rising or falling share is a statement about relative position, not about whether a group’s dollar wealth went up or down. And generation here is a fixed birth-year cohort, so each band’s share rises as the cohort ages into its peak-earning and asset-accumulating years, then falls as the cohort declines — a pattern visible in the Silent band’s long descent.
The Four Generations, 2026 Q1
| Generation (birth years) | Share of net worth | Net worth ($tn) | Peak share to date |
|---|---|---|---|
| Baby Boomers (1946–1964) | 51.6% | $89.8tn | 57.6% (2016 Q3) |
| Gen X (1965–1980) | 26.1% | $45.4tn | still rising |
| Silent & earlier (before 1946) | 11.3% | $19.7tn | 80.1%+ (1989, declining) |
| Millennials (1981+, incl. Gen Z) | 11.0% | $19.1tn | still rising |
Source: Federal Reserve Distributional Financial Accounts, net worth, 2026 Q1 (release of June 18, 2026). Shares are percentages of total U.S. household net worth and sum to 100%. Dollar figures are net worth in then-current dollars. Generations defined by the Federal Reserve by birth year. Eco3min compilation.
The Age-Controlled View: the Same Bracket, Across Time
A birth-cohort share mixes two distinct things: how wealthy a generation’s members are, and where that generation sits in the lifecycle. Because the second effect is mechanical — any cohort holds more as it ages into its fifties and sixties — a cohort comparison alone cannot separate “this generation owns less” from “this generation is simply younger.”
The DFA provides a way to remove the lifecycle effect: the same data set reports wealth shares by age band, independent of birth year. The band for households headed by someone under 40 is the relevant one, because it always describes people at the same stage of life, whichever generation fills it. That share was 12.0% in 1989 Q3. It fell to a low of 3.9% in 2010 Q2 in the aftermath of the financial crisis, and stood at 6.6% in 2026 Q1 — about 45% below its 1989 level. In other words, the under-40 households of today hold a little over half the share of national wealth that the under-40 households of the late 1980s did, with the lifecycle effect held constant. Further detail: the shift from pensions to 401(k)s.
This age-controlled series is the more conservative of the two cuts, and it is the one on which the rest of this page leans. Cohort-level comparisons point in the same direction, but they are complicated by the Federal Reserve’s open-ended definition of “Millennial” — anyone born in 1981 or later — which folds in Gen Z and therefore a large number of households with little or no accumulated wealth, pulling the cohort share down for reasons of definition rather than economics. The age-band series has no such ambiguity.
Two Readings of the Same Data
The gap documented above supports more than one interpretation, and the data does not settle the question on its own. Both readings below are consistent with the series.
Reading one — the lifecycle is doing most of the work, and the gap will close. On this view, the concentration of wealth in older cohorts is largely the expected shape of the wealth lifecycle. People accumulate assets through their working lives and hold the most in their fifties and sixties; younger households have always held a small slice and always will at that age. The Boomers are also an unusually large cohort, which mechanically inflates their share. And the Millennial share is in fact rising — from 4.2% in 2020 to 11.0% in 2026 — exactly the catch-up this reading would predict as the cohort ages into its asset-accumulating years. Related work: our breakdown of choosing investments in the light of the macro cycle.
Reading two — younger households hold a structurally smaller slice than before. On this view, the age-controlled series is the decisive evidence: under-40 households hold 6.6% today against 12.0% in 1989, a gap that the lifecycle cannot explain because the age bracket is fixed. Something other than age — the timing of asset-price gains relative to when each cohort could buy in, the level of home prices and student debt relative to early-career income, the share of younger adults who own homes or equities at all — has compressed the wealth of the young relative to the young of a generation earlier.
The honest summary is that both effects are present. The cohort series shows a real catch-up underway; the age-controlled series shows that the starting point for today’s young households is materially lower than it was for their predecessors at the same age. Which effect dominates over the next decade is an empirical question that the current data cannot answer.
Counter-Arguments and Limitations
First, generational shares are dominated by the lifecycle and by cohort size. This is the central caveat, addressed above. A chart of birth-cohort wealth shares will always show older cohorts dominating, and a larger cohort will hold a larger share at any given age. This is why the page foregrounds the age-band series, which holds the lifecycle constant, rather than resting the argument on the cohort chart alone. By holding age constant, that cut sets aside how life horizon shapes what a portfolio holds, which operates fully everywhere else.
Second, the Federal Reserve’s “Millennial” category is open-ended. The Fed defines Millennials as everyone born in 1981 or later, so the category now includes the entirety of Gen Z. This depresses the Millennial cohort share for definitional reasons — many of its members are children or young adults with negligible net worth — and means the 11.0% figure should not be read as the share held by a closed 1981–1996 cohort, which would be somewhat higher.
Third, net worth is measured before inflation and at market prices. The dollar figures are in then-current dollars and reflect asset prices on the measurement date. A large share of older cohorts’ wealth is in equities and owner-occupied real estate, both of which have risen substantially; a market correction would lower the dollar totals and could shift the shares. Shares are a relative measure and can move without any change in a group’s own circumstances. A relative measure of a moving total inherits how much a wealth figure depends on when it is measured.
Fourth, the DFA is a modeled distribution, not a direct census of every household. It integrates the quarterly Financial Accounts aggregates with the triennial Survey of Consumer Finances. It is the standard source for distributional wealth questions and is widely used, but the between-survey quarters are interpolated, and the very top of the distribution is subject to the usual measurement difficulty. Income is measured on a different survey altogether — the Census CPS ASEC behind the published US household income percentiles since 1967.
Common Misinterpretations
Reading the cohort chart as proof that young people are getting poorer in absolute terms. The chart shows shares, not dollar levels. Millennials’ dollar net worth has grown; their share has grown too, from 4.2% in 2020 to 11.0% in 2026. The claim the data supports is about relative position at a given age, established by the age-band series — not about a fall in younger households’ dollar wealth.
Treating “Millennials hold 11%” as a like-for-like comparison with Boomers’ 51.6%. The two cohorts are at different points in the lifecycle, and the Millennial category is open-ended. A like-for-like comparison requires holding age constant, which is what the under-40 series does. Comparing a cohort’s current share directly against another cohort’s current share conflates wealth with age.
Equating “Gen Z aren’t Millennials” with an error in the chart. The chart follows the Federal Reserve’s own definition, which places everyone born in 1981 or later in a single “Millennial” category. The label on the chart states this explicitly. The categories are the Fed’s, not a stylistic choice, and the data cannot be disaggregated below them in the public series.
Methodology and Sources
Primary source. Federal Reserve Board, Distributional Financial Accounts (DFA), “Distribution of Household Wealth in the U.S. since 1989,” release dated June 18, 2026, covering through 2026 Q1. The DFA integrates the quarterly Financial Accounts of the United States (the household balance sheet, Table B.101.h) with the triennial Survey of Consumer Finances.
Series used. Two series, both for net worth (total assets less total liabilities): (1) share of aggregate household net worth by generation, and (2) share by age band. Both are quarterly from 1989 Q3 to 2026 Q1.
Generation definitions (Federal Reserve). Silent and earlier = born before 1946; Baby Boomers = born 1946–1964; Gen X = born 1965–1980; Millennials = born 1981 or later. The Millennial category is open-ended and includes Gen Z; the Federal Reserve does not publish a separate Gen Z series in the public DFA.
Age band. The “under 40” series refers to households whose reference person is under age 40. It is independent of birth cohort and is used in this analysis to hold the lifecycle effect constant when comparing younger households across time.
Units. Shares are percentages of total U.S. household net worth and sum to 100% in each quarter. Dollar levels are in then-current (nominal) dollars, in millions in the source and reported here in trillions. No inflation adjustment is applied; net worth reflects market prices on the measurement date.
Reproducibility. The full quarterly series for all four generations, the under-40 age band, and the dollar levels are available below as a downloadable file, with the source identifier in the header. The static chart is generated with Python (pandas, matplotlib).
Frequently Asked Questions
As of 2026 Q1, the generation the Federal Reserve labels “Millennial” — everyone born in 1981 or later, which includes Gen Z — held 11.0% of total U.S. household net worth, up from 4.2% in 2020 Q1. Because the category is open-ended, this understates the share of a closed 1981–1996 Millennial cohort.
Baby Boomers (born 1946–1964) held 51.6% of U.S. household net worth in 2026 Q1, down from a peak of 57.6% in 2016 Q3 as the oldest Boomers begin to draw down and pass on wealth.
Isn’t this just the normal wealth lifecycle?
Partly. Older cohorts hold more wealth at any point in history because people accumulate assets over their working lives. That is why this page also uses the age-controlled series: households under 40 held 6.6% of wealth in 2026 versus 12.0% in 1989. Because the age bracket is held constant, that gap is not explained by the lifecycle, and it indicates that younger households today hold a smaller slice than younger households did a generation ago.
Is Gen Z counted as Millennials here?
Yes. The Federal Reserve’s public DFA places everyone born in 1981 or later into a single “Millennial” category, which now includes all of Gen Z. The chart states this on the label. The Fed does not publish a separate Gen Z series.
No. Shares describe relative position within a total that is itself growing. A group’s share can fall while its dollar wealth rises, and vice versa. The dollar levels are provided separately in the downloadable file.
Why use net worth rather than income?
Net worth — total assets minus liabilities — is the measure of accumulated wealth, which is the subject here. The DFA reports the full balance sheet; income is measured by other Federal Reserve and Census series and would answer a different question. Once the full balance sheet is the reference, liabilities weigh as much as assets, which is the distance between gross and net wealth.
Download the Complete Dataset
Quarterly 1989–2026: net worth share by generation, the under-40 age band, and dollar levels per generation, with the Federal Reserve source identifier.
Source: eco3min.fr — Federal Reserve Distributional Financial Accounts. Free to use with attribution.
Conclusion
The Federal Reserve’s distributional data shows a U.S. household wealth distribution heavily weighted toward the cohorts now at or past their peak-earning years: Baby Boomers at 51.6% and Gen X at 26.1% in 2026 Q1, against 11.0% for the open-ended Millennial category and 11.3% for the Silent generation and earlier. Read across a fixed age band rather than by birth cohort, households under 40 held 6.6% of national net worth, against 12.0% in 1989.
The cohort figures are, in large part, the expected shape of the wealth lifecycle, and the rising Millennial share is consistent with a catch-up as that cohort ages. The age-controlled figure is the one the lifecycle does not explain, and it indicates that younger households today begin from a smaller share than their predecessors did at the same age. Whether that gap narrows as Millennials move through their forties, or proves to be a durable feature of the distribution, is the open question the data leaves on the table — and the one worth watching as the next quarters are released.
The data and analysis on this page are provided for informational and educational purposes only. They do not constitute investment advice or a recommendation to take any specific action.
Last updated — 21 August 2026
Disclaimer – Financial Information: The analyses, commentary, and content published on eco3min.fr are provided for informational and educational purposes only. They do not constitute investment advice or a solicitation to buy or sell financial instruments. Past performance is not indicative of future results. All investment decisions involve risk and are the sole responsibility of the reader.