
Where a Household Income Stood: U.S. Percentiles Since 1967
An inflation calculator answers one question: what a 1985 paycheck would be worth in today’s dollars. That answer is useful and incomplete. It describes what the money bought. It says nothing about where that household stood among American households at the time.
This tool adds the second reading. Enter a year and a household income, and it returns both the constant-dollar equivalent and the position of that income in the distribution of its own year — which quintile, how it compared with the median, and how far it sat from the top five percent. The two readings frequently disagree, and the disagreement is the point.
Eco3min tool · Census CPS ASEC, 1967–2024
Where a household income stood in its own year
Two readings of the same figure: what it is worth in today's dollars, and where it sat among American households at the time.
Equivalent today
—
Position that year
—
Household money income before tax, all households (including one-person and retired households). Percentile limits are interpolated log-linearly between the published anchors.
Source: U.S. Census Bureau, Current Population Survey ASEC — Historical Income Tables H-1 (income limits for each fifth and top 5 percent) and H-5 (median household income), 1967–2024. Constant-dollar conversion uses the Census deflator (C-CPI-U from 2000, R-CPI-U-RS before). Historical statistical observation, not a projection and not predictive. Survey-based estimates carry sampling error. Eco3min — educational tool, neither advice nor a recommendation.
What the tool computes
Two separate operations run on a single figure.
Purchasing power. The amount is restated in 2024 dollars using the Census Bureau’s own deflator — the chained CPI-U from 2000 onward, the research series R-CPI-U-RS before that. Using the Census deflator rather than headline CPI-U keeps the tool’s constant-dollar figures identical to the ones published in the Census historical income tables.
Position. The nominal figure is compared with the income limits the Census Bureau publishes for that exact year: the upper limit of each fifth of households, the lower limit of the top five percent, and the median. The result is expressed first as an interval between two measured anchors, then as an interpolated rank inside that interval. Four of the six Census limits are quintile boundaries, the edges of the five equal groups into which US households are divided by income.
A third line closes the loop: holding purchasing power exactly constant, where would that same income sit in the 2024 distribution?
One example: $30,000 in 1985
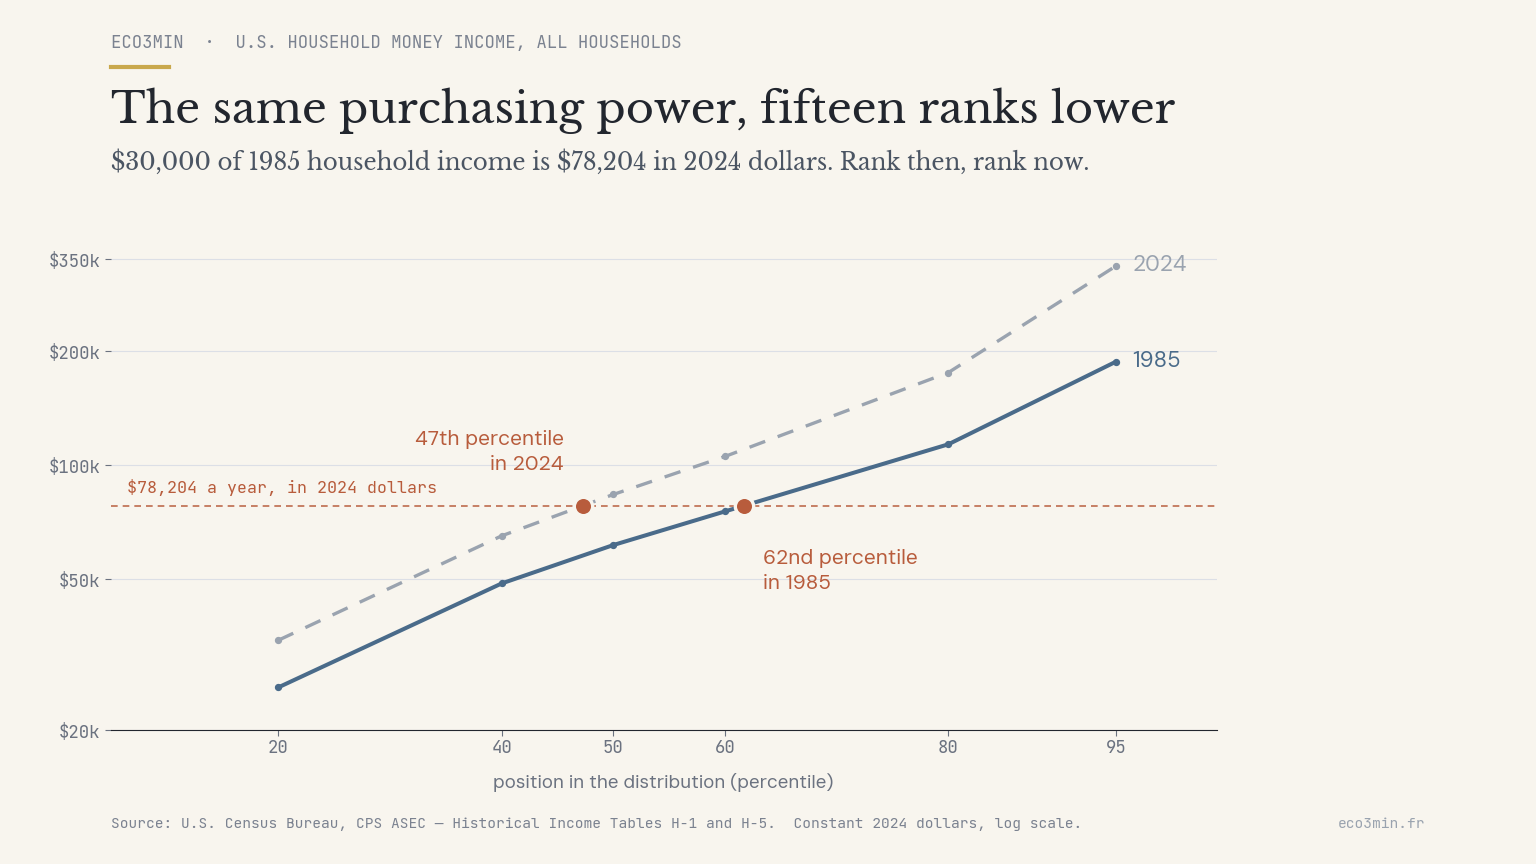
A household earning $30,000 in 1985 sat between the 60th and 80th percentiles, at roughly the 62nd — comfortably above the 1985 median household income of $23,620, at 1.27 times that level.
Restated in 2024 dollars, that income is $78,204. A household with exactly that purchasing power in 2024 falls between the 40th and 50th percentiles, at roughly the 47th — below the 2024 median of $83,730. Knowing the rank is one thing; deciding what to do with a real income that no longer stretches as far is where everyday financial trade-offs across economic regimes begin.
Why the rank falls when purchasing power does not
Two mechanisms act at once, and the tool does not separate them for you — but they are separable.
The first is a level effect. Real median household income rose 53% between 1967 and 2024, from $54,880 to $83,730 in constant 2024 dollars. A fixed real income traverses a rising distribution, so its rank declines arithmetically. Income is one side of that ratio; the other is what it buys, tracked in how many hours of work a US household item costs.
The second is a shape effect. The ratio between the top-five-percent threshold and the upper limit of the lowest fifth widened from 6.3 in 1967 to 9.7 in 2024. Part of that widening reflects changes in household composition rather than pay alone — single-person and dual-earner households have both grown as shares of the total, and household income aggregates whoever lives under the roof. The direction is robust across measures; the magnitude attributable to earnings specifically is not settled. Reading a position on such a distribution is the kind of skill that financial education around inflation, interest rates and money decisions is meant to build.
Where the level effect dominates, ranks slip uniformly. Where the shape effect dominates, they slip fastest in the middle — which is where the 1985 example lands. Behind a shape effect of that kind lies real household income growing at very different speeds across US percentiles since 1967.
Resolution and its limits
The Census historical income tables publish six anchors per year, unchanged since 1967: the upper limits of the four lower fifths, the median, and the lower limit of the top five percent. That yields seven zones, consistently, across all 58 years — no resolution ladder, no methodological cliff in the middle of the series.
What it does not yield is any resolution inside the top five percent. An income above the 95th-percentile threshold returns “above the 95th percentile” and nothing further. Distinguishing the top one percent from the top five requires tax-based sources with different definitions of income, and mixing them into a survey-based series would produce a number that looks precise and is not.
Limits worth knowing
- The unit is the household, not the worker. All households are included — single-person, retired, multi-earner. A one-earner household in 1985 and a two-earner household in 2024 can hold the same rank while representing very different amounts of labour.
- Money income before tax. The Census concept covers wages, self-employment income, interest, dividends, rents, Social Security and other cash transfers. It excludes capital gains, employer-provided benefits, and the value of non-cash transfers such as SNAP or Medicaid, and it is measured before federal and state income tax.
- Survey estimates carry sampling error. These figures come from the CPS Annual Social and Economic Supplement, not an administrative census. Small year-to-year moves in a single percentile are not necessarily signal.
- Two methodological breaks. The redesigned income questions first applied to income year 2013, and the updated processing system first applied to income year 2017, both create discontinuities. Where the Census publishes two rows for a year, this tool uses the newer methodology.
- Rank is not a life path. The tool places an income among all households at a point in time, not among households of the same age. Position typically rises with the age of the householder and then falls after retirement.
- Interpolation between anchors. Ranks inside an interval are estimated log-linearly between two published limits. That is a readable convention, not a measurement.
Data
The file behind the tool is downloadable: quintile limits, median and top-five-percent threshold for every year from 1967 to 2024, in current dollars, with the implied Census deflator to 2024 dollars.
Download the CSV (U.S. household income percentiles, 1967–2024)
Primary sources: U.S. Census Bureau, Current Population Survey ASEC, Historical Income Tables — Table H-1 (income limits for each fifth and top 5 percent of all households) and Table H-5 (households by median and mean income), both covering 1967 to 2024.
Frequently asked questions
Should I enter household income or my own salary?
Household income — the combined pre-tax money income of everyone in the dwelling. Entering one person’s salary in a two-earner household understates the rank substantially, because the benchmark distribution counts the household’s total.
Why does the series stop at 2024?
Income for a given calendar year is collected in the March supplement of the following year and published in September after that. The 2024 income figures released in 2025 are therefore the most recent complete distribution available.
Why is mean household income so much higher than the median?
Because the distribution is right-skewed: incomes extend far above the middle and are bounded below. In 2024, median household income was $83,730 while the mean was $121,000 — a gap of 45%. Skewed that far to the right, the distribution also places the thresholds of the top 10 and top 5 percent of US households at several times the median.
Can an unchanged income move between quintiles?
Yes, and it happens routinely during inflationary periods. If prices and incomes both rise 5% while one household’s income is unchanged, that household loses purchasing power and slips in rank. The two effects are separate and the tool reports them separately.
Does this say whether an income was “good”?
No. It reports a statistical position within a defined universe at a given date. It carries no information about household size, wealth, local housing costs, health coverage or hours worked — all of which shape material living standards and none of which a rank captures. Missing from that list is how old the householder is, a factor that the income-rank calculator by age of householder brings into the comparison.
Last updated — 6 October 2026
Disclaimer – Financial and Legal Information: The analyses, commentary, and content published on eco3min.fr are provided for informational and educational purposes only. They do not constitute investment advice or a solicitation to buy or sell financial instruments. Past performance is not indicative of future results. All investment decisions involve risk and are the sole responsibility of the reader. Data, charts and calculated series are provided as is and may contain errors or lag behind their source: check any figure against the primary source cited before relying on it. Content describing laws, regulations or contracts reflects the law as of its publication date and does not constitute legal or tax advice; applying it to a specific situation requires a qualified legal or tax professional.
Regulated and tax values: the rates, indices, caps and brackets with legal effect cited on this page are set by official decision, change over time and apply according to individual circumstances. Only the official publication in force on the relevant date is authoritative (for example the Journal officiel, INSEE, Banque de France, the IRS or the Social Security Administration). To revise a rent, sign or challenge a contract, or file a return, check the value at the source or with a professional.